TRX/USDT TRADE SETUP Hi guys, This is CryptoMojo, One of the most active trading view authors and fastest-growing communities.
Do consider following me for the latest updates and Long /Short calls on almost every exchange.
I post short mid and long-term trade setups too.
Let’s get to the chart!
I have tried my best to bring the best possible outcome in this chart, Do not consider it as an
According to this 2days chart, TRX is making this descending triangle .
Entry range:- CMP and more up to $0.06
Target:- 12%
SL:- If any daily candle close below $0.059
This chart is likely to help you in making better trade decisions, if it did do consider upvoting this chart.
Would also love to know your charts and views in the comment section.
Thank you
Trxusdtechnicalanalysis

TRONHello traders. I expect the value of Tron to fall to the bottom of the downtrend, 3 cents, after breaking the 6 cent level. Are you agree?

TRX/USDT 1DAY UPDATE BY CRYPTOSANDERSWelcome to this quick
TRX/USDT analysis update
I have tried my best to bring the best possible outcome in this chart.
Reason of trade:-TRX/USDT is triangle pattern create and buy the dip green zone and long term hold
Entry:- CMP And buy the dip in the green zone
Target:- 275%
Stop loss:- 0.035
Remember:-This is not a piece of financial advice. All investment made by me is under my own risk and I am held responsible for my own profit and losses. So, do your own research before investing in this trade.
Happy trading.
Sorry for my English it is not my native language.
Do hit the like button if you like it and share your charts in the comments section.
Thank you...

#TRX broke through the support aggresively. Price tried to hodl #TRX broke through the support aggresively. Price tried to hodl the level but ended up broking as #BTC break the support too. Now, #TRX can dump below $0.054 and expecting a major dip till the major support zone of $0.049 - $0.051.
By @CryptoAXEN

TRXTRX (USDT)
buy if the candle closes above the green line (4hr)
take your profit at TP1 OR TP2
Stop lose : if the candle closes under the red line (4hr) .
Good luck ......

TRX/BTC 1DAY UPDATEWelcome to this quick
TRX/BTC analysis update
I have tried my best to bring the best possible outcome in this chart.
Reason of trade:-TRX/BTC is triangle pattern conform and retest triangle and buy the dip. and long term hold
Entry:- CMP And buy the dip in the green zone
Target:- 50% to 75%
Stop loss:- 0.00000149
Remember:-This is not a piece of financial advice. All investment made by me is under my own risk and I am held responsible for my own profit and losses. So, do your own research before investing in this trade.
Happy trading.
Sorry for my English it is not my native language.
Do hit the like button if you like it and share your charts in the comments section.
Thank you...

longI think in the range are the best places to returneth and breaking the range and continue the process is very important. This analysis is only for your better perspective

TRXUSDT , Buy zone activatedHello everybody
According to that last analysis of TRX we published we shown on chart the one of the main support that the price and support and rise from there
Exactly happen and the price supported in here and because of the condtion of market is better than days ago , the targets we shown on chart is ready to reach for the price
The trend is upward and we only ready to buy and take long position
If the price want to dump more the sensitive zone that the price can support in there is shown to buy it
Previous analysis :
Good Luck
Abtin


TRONTron still in bullish scenario until now. Correction on support EMA 50 TF 1D, Support Trendline and Classic Support.
Correction happen after price touch fibonacci 0.618 on price 0.12867 (swing high to swing low).
Based on fibonacci -0.272 and -0.618 target price around 0.14329 and 0.16780 (swing low to swing high). Wait for confirmation before take position.

TRXUSDT , Its ready to jumpHello everybody
According to our analysis the price is impact to the resistance zone for the 2nd time and now we have support the trendline and we think it can be ready to jump to the 1st target that we shown on cahrt , the point of this analysis is until the price will not break the resistance zone more target is not in our way , we need to break the resistance zone then we can be ready to reach to the target that we shown on chart .
If you have any question or need any help just send us message in private
Dont forget stop loss and attention to money management
Good Luck
Abtin

TRON (TRX) 4H NEAR FUTURE PREDICTIONTechnical Analysis Summary
TRX/USDT
TREND ANALYSIS
We have 2 Downward trend in red color
We have 1 daily Uptrend in green
The wider the trend the stronger the trend
FUTURE PREDICTIONS
We have many resistanse and support levels that I have mentioned above.
I use thickness as an indicator of stregth of levels (ONLY FOR VISUALS).
Hourly levels can be found on the 1H trx chart.
Good luck everyone, stay safe!
If you need help don't hesitate to send me a message or comment
Trading Involves High Risk
Not Financial Advice
Exercise Proper Risk Management

TRXIn the last two months, it has always been traded with a good volume
If the heavy resistance of 0.123 fails, it can easily reach the first target
The range of medium-term targets is indicated in the chart
TRXUSDT - BUY Setup🔵 CYCLE 🔵 #ROyalQ
Buy TRX/USDT at Current Price: 0.11115
Potential Profit Target (PPT) =>
Trade settings
First buy: 20
Margin call limit: 5
NO Dip Calls Multiplier Buy in
1st call: 1.20% Buy 0.5 times
2nd call: 1.00% Buy 0.5 times
3rd call: 1.70% Buy 1 times
4th call: 2.50% Buy 0.5 times
5th call: 2.50% Buy 1 times
Change Mode to One-Shot after 5th Call/Profit or when price is near $0.12
Note: If the trade buys all the calls you should make about 10% profit on Investment

TRXUSDT Prediction 1D The direction of the price of TRXUSDT in daily time is indicated in the chart.

Price is trappedTRX price has been trapped between two downtrend and it is some how trading. for growth, TRX need to break upper trend line. trend which is under the price, is now supportive and if break it, it will Fall
EMA 200 is also a great support for TRX and have support price three or four time in past

TRXUSDT , In the exactly way of 1st target ...Hello guys
According to our last analysis we shown on chart buy zone area and exactly that zone was activated and with ascending cover candle we can take long position and buy TRX and wait until 1st target , and this time the market exactly is moving like our prediction and in the way of first Tp , we should wait for take new position after first Tp reach we can update chart for others target and we will publish new chart
And others things is in these 2-3 days Justin Sun is in dubai in Seminar of blockchain , this is a good news that can jump the price
Be patient and enjoy your profit
Previous analysis
Be with us and sleep comfortably
Good Luck
Abtin

Tron TRX Ready to MOON LONG NOW !!??? TRON TRXTaking a look at price action you can see that the most recent pullback was a retest of key support and resistance and on top of that we formed hidden bullish divergence on the daily time frame !!
A short term break and rest of our most recent high which lines up with an area of support is holding strong
In my view holding this level could allow us to run up to the next level of resistance
If we execeed that level expect TRX to ATH 30 cents !!!!!

TRX 12h How much more to grow The last time we did a global idea for TRXUSDT was in May of this year, less than two weeks before crypto prices started to collapse (ohhh, then we read a lot of hate .... "what are you writing, this growth can't be stopped, etc." but :)
Since then, the price of TRXUSD has managed to fall by -65%:
The TRXUSD price has been rising almost uncorrected for the past two months and has almost worked off all of its losses.
The TRXUSDT price has been trading in a 20% corridor of $0.10-0.12 for the last few days and most likely, buyers are preparing for another upward momentum.
To confirm their strength, buyers should at least keep the TRX price upper $0.10 for the next few days and at most hold above $0.12.
We assume that the growth retardation can start in the range of $0.13-0.144 , in this zone fully compensates for the May fall. Deceleration in this area may be provoked by the fact that traders, who had been in a drawdown for 5 months, will want to fix position at break-even and forget about this negative experience.
If the area of $0.130-0.144 will not have critically large trading volumes, it will be a signal that the sell-off time has not come yet , and the growth itself may continue at low volumes, as it has been doing for the last months.
Targets for a move higher are shown on the chart — $0.155 and $0.169
_____________________
Do you like the idea fulfilment? Does it help you trade and make a profit?
Do you want more forecasts from us?
Give us motivation! (Like, comment and donate). These little things won't make us rich, but they will warm the trader's soul while writing the next idea!

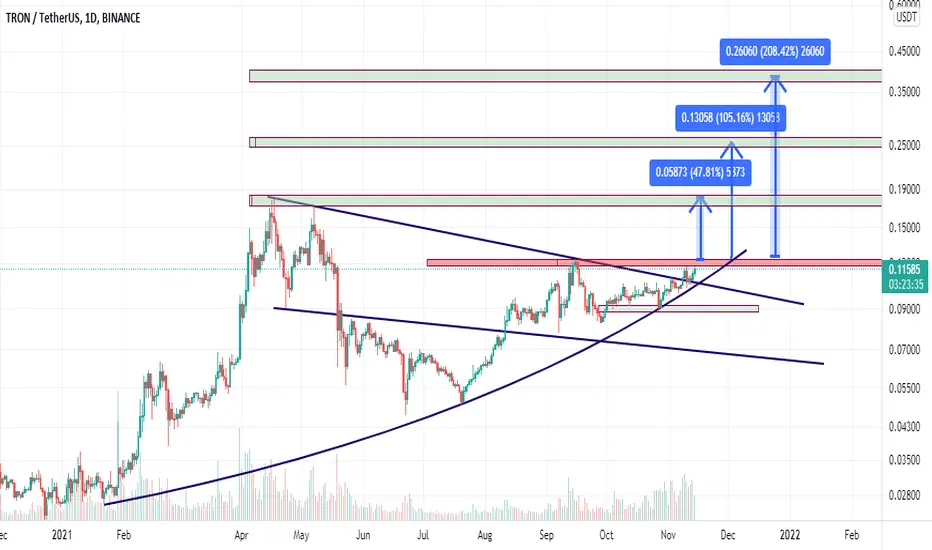
TRXUSDT(1D chart) - Trend Breakout!TRXUSDT (1D Chart) Technical analysis
TRX/USDT(1D Chart) Currently trading at $0.114
Buy level : Above $0.111
Stop loss: Below $0.081
TP1: $0.136
TP2: $0.166
TP3: $0.203
TP4: $0.252
Max Leverage 2x
Always keep Stop loss
Follow Our Tradingview Account for More Technical Analysis Updates, | Like, Share and Comment Your thoughts.

TRXusd daily scaleIt is currently in the resistance area and is likely to return when it stabilizes in the 0.0889 range. And it is possible to ascend to the next stage when it stabilizes above the area of 0.113

TRXUSD AnalysisTRX slipped down on its charts over the last 24 hours and was trading at $0.102. The altcoin had registered a multi-month high yesterday, however, it failed to topple the $0.104 resistance. Its immediate support zone lay at $0.0958, the additional support lines stood at $0.088 and at $0.0816. it's been three weeks since TRX last traded around $0.0816
Buying pressure fell near the 60-mark on the Relative Strength Index after the asset was overbought over the last 48 hours. Awesome Oscillator registered red signal bars. MACD’s green histogram receded and a red histogram was visible.
Feel free and get in touch for more updates, signals and trade alerts

TRON TRXUSDT to 0.128$ ??Tron started moving up
i think in couple days TRXUSDT can reach 0.128$
What you think About?
