$NVDA - $280 PT WEEKLY BULL FLAGStay Positioned with Nvidia's Weekly Bullish Chart. A Bull Flag is setting up with an imminent breakout. Long/Short Ratio is also very bullish at almost 60%. Price Target is $280. Remember Pole length of the flag = extended measured move at the breakout point of the flag.
Tesla Motors (TSLA)

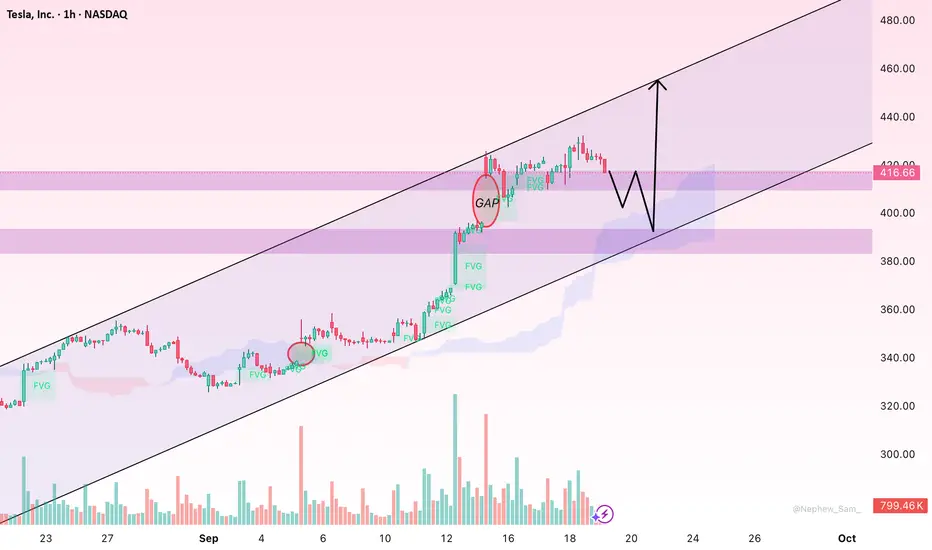
TSLA: Mild Pullback but Uptrend Remains IntactHello everyone,
Tesla’s share price (TSLA) slipped slightly today, closing at 416.66 USD, down 5.78 USD or 1.37% compared to the previous session’s high. After a strong rally earlier, the market is now watching closely to see whether Tesla can sustain its upward momentum or enter a deeper correction.
The main driver of this dip has been profit-taking after the stock approached the 430 USD level, creating selling pressure. Alongside this, Tesla’s prior upward moves have left several Fair Value Gaps (FVGs), which may serve as support zones if price revisits them, helping traders identify potential entry levels. In addition, trading volume has picked up significantly in recent sessions, showing strong inflows and active participation from major investors.
Looking ahead, despite the current mild pullback, Tesla shares are expected to extend their uptrend if they can hold above the 416 USD support. This is a crucial threshold—if it holds, price could revisit 430 USD and potentially move toward 440 USD in upcoming sessions.
The reasoning lies in the sustained capital inflows, the supportive role of FVG zones, and the Ichimoku cloud structure, which continues to back the bullish trend as long as price stays above it.
So, what’s your view? Will Tesla keep pushing higher toward 430–440 USD, or is a deeper retracement likely?
$TSLA - Bullish Flag Setup $510A Bullish Flag is setting up nicely on TSLA. If price breaks out of the flag, a measured move equaling the pole length would put its price objective roughly between $500-510.

Huge Dark Pools and Prints... Will this time be Different?Stock Market Forecast | Mag 7 TSLA NVDA AAPL AMZN
QQQ CME_MINI:NQ1! CME_MINI:ES1! SP:SPX NASDAQ:NDX stock market Forecast

Tesla (TSLA) BUYTesla (TSLA) is best known for electric cars, but its future depends on AI. From self-driving vehicles to its Optimus humanoid robot, Tesla is an AI-first company disguised as an automaker.

TSLA path to 550/650 USD Breakout Still Pending🔥 What specifically drives TSLA into 550–650
📦 Deliveries + mix surprise
If unit volumes beat whisper numbers and mix favors higher-trim/FSD attach, you get more gross profit per vehicle without needing price hikes. Watch the cadence of regional incentives and shipping vectors; strong NA/EU mix plus improving China utilization is the sweet spot.
🛠️ Margin stabilization → operating leverage
Gross margin base effect + opex discipline = powerful flow-through. Even a 100–150 bps lift in auto GM, coupled with energy GM expanding as Megapack scales, can push operating margin into low-mid teens. That alone recodes the multiple market is willing to pay.
🔋 Energy storage stepping out of auto’s shadow
Megapack/Powerwall growth with multi-GW backlogs turns “side business” into a credible second engine. As deployments and ASP/contract mix normalize, investors begin modeling $10–$15B annualized energy revenue with attractive GM — this is multiple-expanding because it looks more like infrastructure/software-tinted industrials than cyclical autos.
🤖 Autonomy & software monetization bridges
Two things move the needle fast: (1) clear progress toward supervised autonomy at scale (drives FSD attach + ARPU), and (2) licensing (FSD stack, charging/NACS, drive units). Even modestly credible paid-miles/seat-based models (think $50–$150/month vehicles on fleet) transform valuation frameworks.
🦾 Optimus/robotics as a real option, not sci-fi
The market doesn’t need commercial ubiquity — it needs line-of-sight to pilot deployments and unit economics where labor-substitute ROI < 3 years. A few high-credibility pilots (warehousing, simple assembly, logistics cells) can tack on optionality premium that pushes the multiple toward the top of the range.
💹 Options-market reflexivity
Flows matter. Elevated call demand near ATH turns dealers short gamma, forcing delta hedging that lifts spot, which triggers more call buying → a familiar feedback loop. On breakouts, watch open interest skew to short-dated OTM calls, and put-call ratios compressing; these magnify upside in a tight float day.
🌍 Macro & liquidity
If indices hold highs and the rate path doesn’t tighten financial conditions, growth duration gets rewarded. TSLA’s beta + story premium thrives in that regime.
________________________________________
🧠 Outside-the-box accelerants
🛰️ “Software day” packaging
A coordinated showcase that bundles FSD progress, energy software (fleet, VPP), service/insurance data, and Optimus pilots into a single capital-markets narrative could reframe TSLA as a platform. The Street responds to packaging; it compresses time-to-belief.
🤝 Third-party FSD/charging licensing headlines
A single blue-chip OEM announcing software licensing + NACS deep integration reframes the competitive landscape. The equity market pays a software multiple for recurring seats.
🏗️ Capex signaling for next-gen platform without GM hit
Announcing a modular, high-throughput manufacturing scheme (cell to structure, gigacasting tweaks, logistics compression) with proof that unit economics are accretive from ramp can flip skeptics who anchor to past ramp pain.
⚡ Grid-scale contracts + financing innovation
If Tesla pairs utility-scale storage with project-level financing (think repeatable ABS-like channels for Megapack), you de-risk cash conversion cycles and unlock a new investor constituency (infrastructure/green income). That tightens the multiple.
________________________________________
🏎️ Comparative playbook: RACE (Ferrari) & NVDA (NVIDIA)
👑 RACE — the scarcity & brand ROIC lens
Ferrari’s premium multiple rests on scarcity, orderbook visibility, and brand pricing power. TSLA doesn’t have scarcity, but it can borrow the RACE lens via (a) limited-run, ultra-high-margin trims that anchor halo pricing, (b) waitlist-like energy backlogs that create visibility, and (c) bespoke software packages that mimic “personalization” margin. In bull phases, RACE trades as a luxury compounder rather than an automaker; TSLA can earn a slice of that premium when the energy + software story dominates.
🧮 NVDA — the flywheel & supply-constrained S-curve
NVIDIA’s explosive run blended (1) clear demand > supply, (2) pricing power, (3) ecosystem lock-in. TSLA’s battery and compute stacks can echo that dynamic: limited 4680/cell supply + Megapack queues + proprietary autonomy data moat. The moment the market believes TSLA is supply-gated (not demand-gated) in energy/AI, it will award NVDA-like scarcity premia. Add toolchain stickiness (training data, fleet miles, Dojo/AI infra), and you get ecosystem multiples rather than auto multiples.
📊 What the comps teach for TSLA’s 550–650 zone
• RACE lesson: visibility + pricing power boost the quality of earnings → higher P/E durability.
• NVDA lesson: credible scarcity + platform control turbocharge EV/Sales and compress the market’s time-to-future state.
• Translation for TSLA: blend of luxury-like quality (energy contracts + premium trims) and platform scarcity (cells/AI stack) → multiple rerate into our target band.
________________________________________
🧾 Valuation outlook
🧮 Earnings path
• Units up mid-teens % Y/Y; ASP stable to slightly higher on mix; energy + software up strongly.
• Auto GM +100–150 bps; Energy GM expands on scale; opex +SMC disciplined → op margin 12–15%.
• Share count glide modest. Forward EPS ≈ $9–$11.
• Multiple: 50× (conservative growth premium) → $450–$550; 60× (software/autonomy visibility) → $540–$660.
• Why the market pays up: visible recurring high-margin lines (FSD, energy software, services) + AI/robotics optionality.
📈 EV/Sales path
• Forward revenue $130–$150B (auto + energy + software/services).
• Assign blended EV/Sales 6.5–7.5× when energy/software dominate the debate.
• Less net cash → equity value per share in $550–$650.
• Check: At 7× on $140B = $980B EV; equity ≈ $1.0–$1.1T with cash, divided by diluted shares → mid-$500s to $600s. Momentum premium and flow can extend to upper bound.
________________________________________
🧭 Technical roadmap & market-microstructure
🧱 Breakout mechanics
A decisive weekly close above prior ATH with rising volume and a low-volume retest that holds converts resistance to a springboard. Expect a “open-drive → pause → trend” sequence: day 1 impulse, 2–5 sessions of rangebuilding, then trend resumption.
🧲 Volume shelves & AWVAPs
Anchored VWAPs from the last major swing high and the post-washout low often act like magnets. Post-break, the ATH AVWAP becomes first support, then the $500 handle functions as the psychological pivot. Above there, $550/$590/$630 are classical measured-move/Fib projection waypoints; pullbacks should hold prior shelf highs.
🌀 Options & dealer positioning
On a break, short-dated OTM calls populate 1–2% ladders; dealers short gamma chase price up via delta hedging. Expect intraday ramps near strikes (pin-and-pop behavior) and Friday accelerants if sentiment is euphoric. A steepening skew with heavy call open interest is your tell that supply is thin.
________________________________________
🧨 Risks & invalidation
🚫 Failed retest below the breakout shelf (think: a fast round-trip under the $4-handle) downgrades the setup from “trend” to “blow-off.”
🧯 Margin or delivery disappointments (e.g., price-war resumption, regional softness) break the EPS/EV-Sales bridges.
🌪️ Macro shock (rates spike, liquidity drains) compresses long-duration multiples first; TSLA is high beta.
🔁 Flow reversal — if call-heavy positioning unwinds, gamma flips to a headwind and accelerates downside.
________________________________________
💼 Trading & portfolio expressions for HNWI
🎯 Core + satellite
Hold a core equity position to capture trend, add a satellite of calls for convexity. If chasing, consider call spreads (e.g., 1–3 month $500/$600 or $520/$650) to tame IV.
🛡️ Risk-managed parity
Pair equity with a protective put slightly OTM or finance it with a put spread. Alternatively, collars (write covered calls above $650 to fund downside puts) if you’re guarding a large legacy stake.
⚙️ Momentum follow-through
Use stop-ins above key levels for systematic adds, and stop-outs below retest lows to avoid round-trips. Size reduces into $590–$630 where target confluence lives; recycle risk into pullbacks.
💵 Liquidity & slippage
Scale entries around liquid times (open/closing auctions). For size, work algos to avoid prints into obvious strikes where dealers can lean.
________________________________________
🧾 Monitoring checklist
🔭 Delivery run-rate signals (regional registration proxies, shipping cadence).
🏭 Margin tells (bill of materials trends, promotions cadence, energy deployment updates).
🧠 Autonomy milestones (software releases, safety metrics, attach/ARPU hints).
🔌 Licensing/partnership beats (NACS depth, FSD/AI stack interest).
📊 Options dashboard (short-dated call OI ladders; put-call ratio shifts; gamma positioning).
🌡️ Macro regime (rates, liquidity, risk appetite).
________________________________________
✅ Bottom line
🏁 The 550–650 tape is not a fairy tale — it’s a stacked-catalyst + rerate setup where energy/software/autonomy rise in the narrative mix, margins stabilize, and options-market reflexivity does the rest. Execute the breakout playbook, respect invalidation lines, and use convex expressions to lean into upside while protecting capital.
esla (TSLA) — Breakout Playbook
🎯 Core Thesis
• Insider conviction: Musk’s ~$1B buy.
• Risk-on macro: equities at highs, liquidity supportive.
• Options reflexivity: call-heavy flows can fuel upside.
• ATH breakout (~$480–$490) = gateway to price discovery.
________________________________________
🚀 Upside Drivers to $550–$650
• Deliveries & Mix: Surprise beat + higher trim/FSD attach.
• Margins: GM stabilization + energy scaling → op margin 12–15%.
• Energy: $10–15B rev potential with infra-like multiples.
• Autonomy/Software: FSD attach, ARPU, licensing.
• Optimus/Robotics: Pilot deployments → ROI < 3 yrs adds optionality.
• Licensing Headlines: OEMs adopting NACS/FSD stack.
• Capital Markets Narrative: Packaged “software + energy + robotics” story reframes Tesla as a platform.
________________________________________
🏎️ Comparative Bull Run Lens
• Ferrari (RACE): Scarcity, orderbook, luxury multiples.
• NVIDIA (NVDA): Scarcity + ecosystem flywheel → EV/Sales premium.
• Tesla Parallel: Blend of luxury quality (energy backlogs, halo trims) + AI scarcity (cells, fleet data, Dojo).
________________________________________
📊 Valuation Bridges
• EPS Path: $9–$11 EPS × 50–60× = $450–$660.
• EV/Sales Path: $130–150B revenue × 6.5–7.5× = $550–$650.
________________________________________
📈 Technical Roadmap
• Breakout > $490 → retest holds → next legs:
o $550 / $590 / $630 / stretch $650–$690.
• Watch anchored VWAPs; ATH shelf flips to support.
• Options chase accelerates above round strikes.

Tesla - Technicals are pretty clear!🚨Tesla ( NASDAQ:TSLA ) respects the triangle:
🔎Analysis summary:
Ever since Tesla was listed on the Nasdaq, we saw perfect cycles playing out. Since 2021, Tesla has once again been consolidating within a bullish triangle pattern. Therefore with the recent bullish break and retest, it becomes more and more likely that Tesla will break out soon.
📝Levels to watch:
$400, $250
SwingTraderPhil
SwingTrading.Simplified. | Investing.Simplified. | #LONGTERMVISION

I am bullish on TSLAI have not changed my buy bias for this baby.
II will continue adding TSLA to my portfolio with $360 and $400 as my medium-term take profits.
Share your thought.
If you found this helpful, like, follow and share

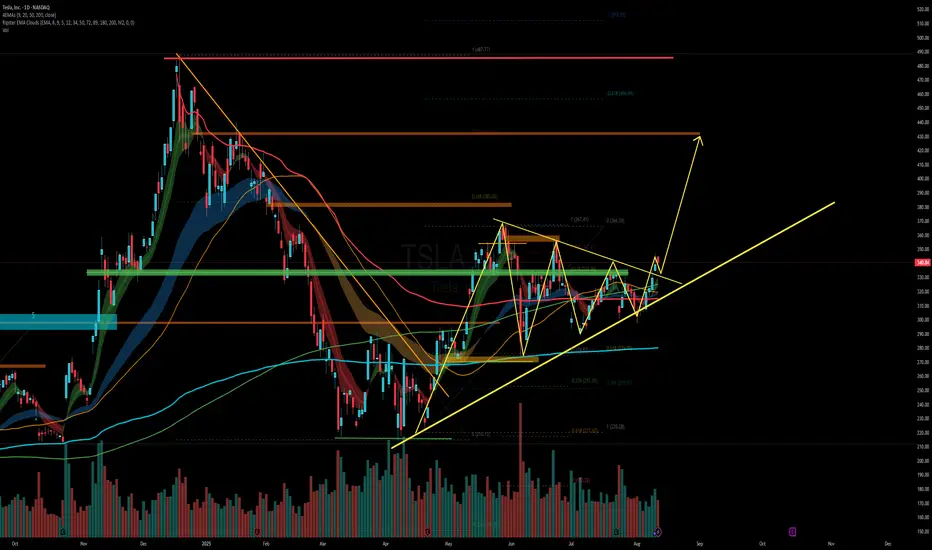
$TSLA: Let The Rally Speak For Itself - 9/16/2025Based on the analysis, it’s confirmed that NASDAQ:TSLA has initiated a new rally following the completion of a lengthy and complex corrective structure at $288.
The stock bounced twice off the 50-week moving average, signaling strong support as the correction neared its end.
Due to the depth and complexity of the structure, Wave 3 is expected to unfold with high momentum, potentially delivering an explosive rally. Key upside targets are displayed in the chart — we’ll be watching closely to see how price reacts at those levels.
📚 Note: The internal structure and labeling were intentionally left visible in the chart for educational purposes. This is especially useful for traders interested in Modern Trading Algorithms and their structural variations.
Happy Trading, and let the rally speak for itself. 🚀

Tesla (TSLA) Stock Price Rises Above $400Tesla (TSLA) Stock Price Rises Above $400
As the chart shows, Tesla (TSLA) stocks are displaying strong market momentum. In particular, the price:
→ is above the psychological level of $400;
→ has reached its highest levels since late January;
→ has gained around 25% since the beginning of September.
Why Is TSLA Rising?
The main news driving the price surge was a media report that Elon Musk had purchased $1 billion worth of Tesla stock. The market interpreted this as commitment and confidence in the company’s future from its founder, which sharply increased demand for the shares.
Other factors contributing to TSLA’s rise include:
→ Expectations of a Federal Reserve interest rate cut to stimulate the economy. This makes growth stocks such as Tesla more attractive to investors.
→ Reduced tensions between Elon Musk and President Trump’s administration. This removes some of the political risks that had weighed on the stock.
Technical Analysis of TSLA Stock
In our August analysis of the TSLA chart, we:
→ noted that the price had broken through the upper boundary of a broad contracting triangle with its axis around $317;
→ suggested that a correction might follow after the rally in early August.
Since then:
→ the price made a minor pullback before reversing upwards (as shown by the arrow);
→ the bullish trend resumed, providing anchor points to construct a rising (blue) channel.
Thus, the chart confirms:
→ a shift in sentiment in favour of buyers;
→ an improving fundamental backdrop (as highlighted in the news) and growth prospects linked to robotaxis and other innovations.
From a bullish perspective, the breakout of $355 followed by accelerated growth points to strong demand.
From a bearish perspective:
→ the RSI indicator has spiked into overbought territory;
→ the price is near the upper boundary of the rising channel;
→ the seven-month high could prompt profit-taking by investors – already reflected in yesterday’s pullback.
Taking this into account, we could assume that while the long-term outlook remains optimistic, a correction is possible, for example:
→ towards the 50% retracement level of the A→B impulse;
→ into the price expansion zone (a bullish imbalance signal, as described by the Fair Value Gap pattern in the Smart Money Concept methodology).
This article represents the opinion of the Companies operating under the FXOpen brand only. It is not to be construed as an offer, solicitation, or recommendation with respect to products and services provided by the Companies operating under the FXOpen brand, nor is it to be considered financial advice.

TSLA - is it the time for Fireworks ?TSLA - huge base, many breakout failures due to news.
Let's see if this time it sustains this bullish move.
CUP AND HANDLE $TSLA TO $515 MINIMUMThe cup and handle is a bullish chart pattern commonly used by traders to spot potential buying opportunities. It features a rounded "cup" formation followed by a slight downward drift forming the "handle." This pattern typically signals a continuation of an upward trend once the handle completes its consolidation phase.
ROBOTAXI BOOM
BUY NOW NASDAQ:TSLL NASDAQ:TSLA

Tesla - Here we goooooo!🚗Tesla ( NASDAQ:TSLA ) is finally breaking out:
🔎Analysis summary:
Finally, after a consolidation of four years, Tesla is attempting another all time high breakout. With the bullish triangle coming to an end, bulls are dominating this stock. It just comes down to the next couple of months but a triangle breakout remains far more likely.
📝Levels to watch:
$400
SwingTraderPhil
SwingTrading.Simplified. | Investing.Simplified. | #LONGTERMVISION

TSLA Tesla Options Ahead of EarningsIf you haven`t bought TSLA before the recent rally:
Now analyzing the options chain and the chart patterns of TSLA Tesla prior to the earnings report this week,
I would consider purchasing the 350usd strike price Calls with
an expiration date of 2025-8-15,
for a premium of approximately $14.90.
If these options prove to be profitable prior to the earnings release, I would sell at least half of them.
Disclosure: I am part of Trade Nation's Influencer program and receive a monthly fee for using their TradingView charts in my analysis.

Long TESLATrading Fam,
Today my indicator has signaled a BUY on $TSLA. The technicals align. M pattern looks to have completed at strong support (RED TL) and is bouncing upwards inside of a solid liquidity block. Buyers are stepping in. I'm in at $315 and will shoot for $430 (probably taking some profit along the way). My SL is currently $241 but will trail as we enter profit.
Best,
Stew

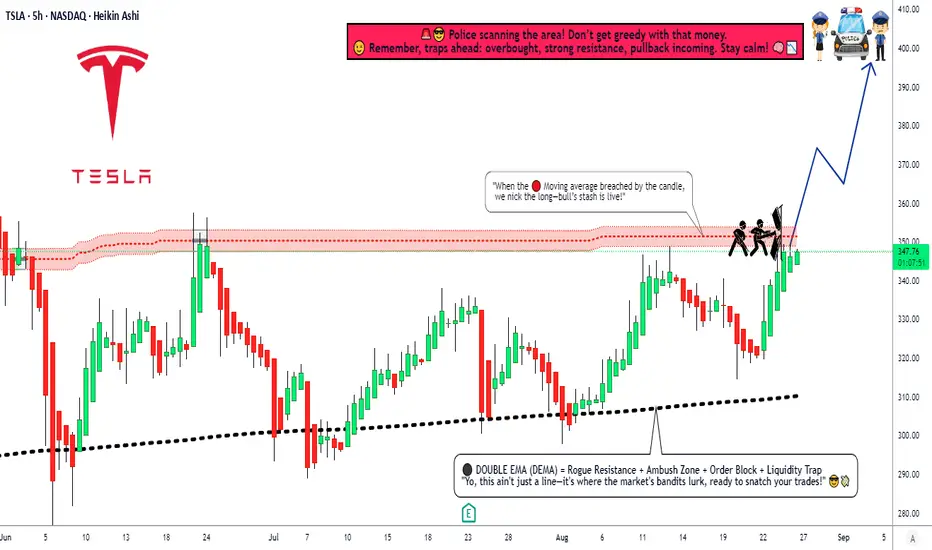
TSLA Breakout Play: Time to Steal Some Profits?🚨 TESLA INC (TSLA) HEIST PLAN - BULLISH SWING/Day LAYUP! 🚨
Yo, Thief OG's! 🐱👤🤑 Time to swarm the TSLA vault. The blueprint is set for a major bullish score. Our intel says the cops (bears) are losing their grip. Let's get this money! 💰💸✨
🎯 THE MASTER PLAN: BULLISH BREAKOUT (PENDING ORDERS)
Based on the Thief Trading Style™ technical analysis, we're plotting a bullish heist on TSLA. We wait for the breakout confirmation, then we strike with precision using our layered entry strategy.
Asset: TESLA INC (TSLA)
Trade Type: Swing / Day Trade
Bias: BULLISH ⬆️⚡
📍 ENTRY: THE HEIST INITIATES (SET YOUR ALARMS! ⏰)
Primary Entry: Breakout and close above $355.00 ⚡
THIEF'S LAYERED ENTRY STRATEGY: 🎯
Don't go all in at one price! We use multiple limit orders to layer into the position after the breakout confirms the move. This is how the pros (and thieves) do it!
Layer 1: Breakout Entry @ $355.00
Layer 2: Pullback Entry @ $350.00
Layer 3: Pullback Entry @ $345.00
Layer 4: Pullback Entry @ $340.00
Layer 5: Pullback Entry @ $335.00
(You can add more layers based on your own capital and risk appetite, you savage!)
📌 IMPORTANT: SET A TRADINGVIEW ALARM at $355.00! This is your signal that the heist is a GO! Don't get caught sleeping. 🛌💤
🛑 STOP LOSS: THE ESCAPE ROUTE
Thief SL for Breakout Entry: $320.00
⚠️ HEAR ME, HEAR ME! Dear Ladies & Gentleman (Thief OG's), adjust your SL based on your own strategy & risk! I am not your financial advisor; I'm just the guy with the blueprint. 🗺️ Place your SL ONLY AFTER the breakout happens. Protect your capital at all costs!
🎯 TARGET: CASH OUT & VANISH
Primary Target: $400.00 🚀
The police barricade is thick up there! 🚓🚧 Once the money is in the bag, don't get greedy! Escape with the stolen profits before they catch you!
Note: Dear Thief OG's, I am not recommending you use only my TP. Take profits at your own risk and based on your own analysis. Secure the bag when YOU feel comfortable! 💼🔥
💎 THIEF'S FINAL WORDS:
This is not a gamble; it's a calculated heist. Follow the plan, manage your risk, and let's eat! 🍽️
Hit the LIKE button if you're riding with us! ✅
BOOST this idea to empower the thief community! 💪❤️
Follow for more daily heist plans! 🎯
Stay sharp, stay profitable, and remember... in the market, be a thief, not a victim! 🐱💻🚀
NASDAQ:TSLA #TradingView #StockMarket #TradingPlan #SwingTrading #DayTrading #Investing #Bullish #TESLA #ThiefTradingStyle
Check if it can rise above 347.21
Hello, traders!
Follow us to get the latest updates quickly.
Have a great day!
-------------------------------------
(TSLA 1D chart)
The key is to determine which direction the price breaks out of the two support and resistance areas of 268.07-311.48 and 347.21-382.40.
For a step-up trend to occur, the price must remain above 334.09-347.21.
However, a step-up trend is highly likely only if the price rises above the support and resistance levels of 382.40 and 421.06 on the 1W and 1M charts.
Even so, a larger increase is likely if the price rises above the 334.09-347.21 range on the 1D chart.
-
The 268.07-311.48 range also falls within the HA-High indicator.
Therefore, it's important to remember that the current position is not a buy position, but rather a sell position.
However, for new buys, it's best to initiate them when support is found near the M-Signal indicator on the 1M chart, if possible.
Therefore, when the 268.07-311.48 range acts as a support zone, it can be considered a buying opportunity.
However, since it's within the HA-High indicator zone, trades should be executed with short and quick responses.
The key volatility period is around October 7th, but before that, we should check the movements around September 5th and September 12th.
At this time, the trend is likely to be determined by which direction the price moves: the 268.07-311.48 range or the 347.21-382.40 range.
-
Thank you for reading to the end.
I wish you successful trading.
--------------------------------------------------

LONG | TSLA NASDAQ:TSLA
TSLA is pressing against a key confluence zone $352–$356 (TP1), aligning with daily and weekly resistance. A confirmed breakout could open the path toward $367 (TP2) and $404 (TP3) in the medium term.
Supports: $326 / $318 – must hold to maintain bullish momentum.
Bias: Bullish if above $326; consolidation or pullback likely if rejected at $356.
A monthly close above $367 would confirm a long-term cup breakout, projecting toward the $500 area over the next cycles.

Huge Dark Pools... Will This Time be Any Different?QQQ CME_MINI:NQ1! CME_MINI:ES1! stock market Forecast
Nvidia Stock NASDAQ:NVDA Forecast
Apple Stock AAPL Forecast
Microsoft Stock MSFT Forecast
Google Stock GOOGL Forecast
Amazon Stock AMZN Forecast
Meta Forecast Technical Analysis
Tesla Stock NASDAQ:TSLA Forecast
Magnificent 7 stocks forecast

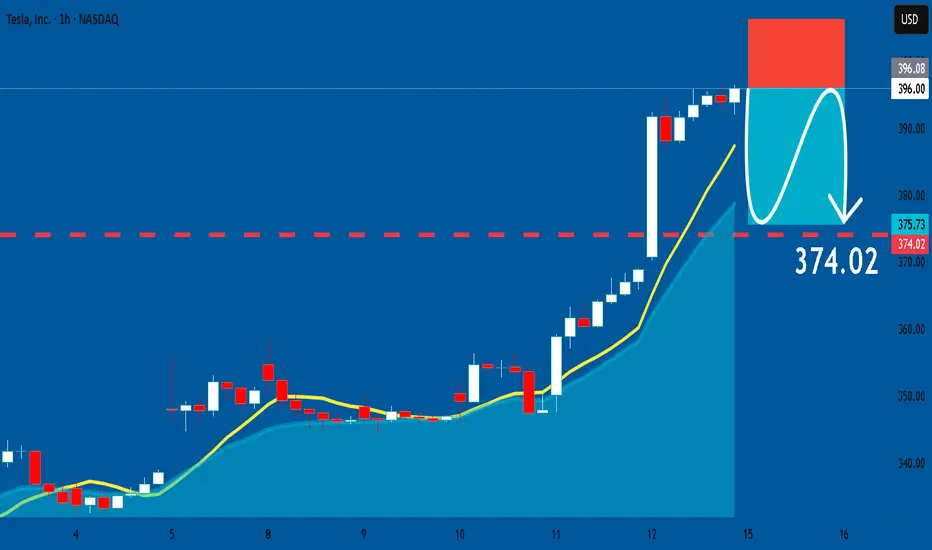
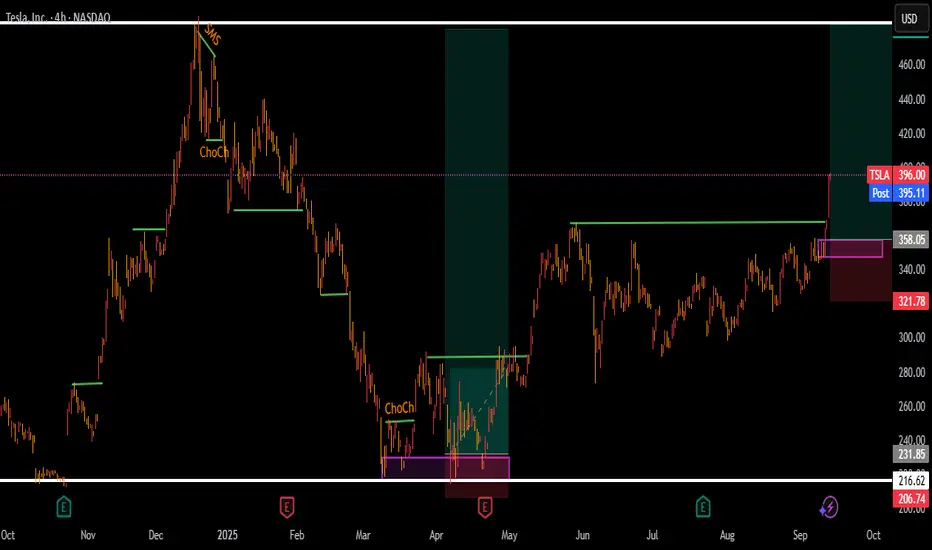
TESLA : Short Signal Explained
TESLA
- Classic bearish setup
- Our team expects bearish continuation
SUGGESTED TRADE:
Swing Trade
Short TESLA
Entry Point - 396.08
Stop Loss - 406.37
Take Profit - 374.02
Our Risk - 1%
Start protection of your profits from lower levels
Disclosure: I am part of Trade Nation's Influencer program and receive a monthly fee for using their TradingView charts in my analysis.
❤️ Please, support our work with like & comment! ❤️
TSLA UPDATE 13 SEP 2025I dont care what price does next. I have exited from Tesla at $390. I want it to go moon and I will buy it back again whenever I want but wont hold here or make new entries here. There is a big monthly supply zone here so I wont be touching Tesla now & wait for further price action

TESLA stock to gain more heights again!Tesla has finally broke out of that ardous consolidation it was in! investors can look for the buying opportunities for a probable pullback on a shown order block!
BUY NOW $LULU EASY MONEYRSI (14) 39.15
P/E 13.65 as of 08/13/2025
Buy now and you will thank me later.
This is super sale
