S&P500 | H2 Double Top | GTradingMethodHello Traders,
Watching the S&P for a potential double top.
It also aligns with the retest of the rising wedge, which is has already broken to the downside. This kind of confluence gives me extra excitement about a trade.
What I still need to happen for me to open the trade:
- H2 candle close in the entry range
- H2 candle that closes in the range needs a certain closure rate
- RSI needs to create another divergence
- Volume needs to be lower on T2, although my system does give exceptions if there is a data release, in this case FOMC, so exception will likely apply.
📊 Trade Plan:
Risk/reward = Between 3.3 and 4.3
Entry price = Between 6630 and 6639.9
Stop loss price = Between 6649.2 and 6656.8
Take profit level 1 (50%) = 6576
Take profit level 2 (50%) = 6553
I would ideally like my stop loss above the rising wedge, that way it needs to break through both barriers.
Also, if this pattern plays out, I think it will drag the crypto market down with it... Unfortunately.
💡 GTradingMethod Tip:
Always predefine your risk before entering a trade. This is a non negotiable to becoming a professional trader.
🙏 Thanks for checking out my post!
Make sure to follow me for updates and let me know in the comments — do you see the wedge retest as bearish, or do you think the bulls have more room to run?
📌 Please note: This is not financial advice. This content is to track my trading journey and for educational purposes only.
Peace
G
Tutorial

Gold | H4 Double Top | GTradingMethodHello Traders,
Is Gold about to confirm a double top on the 4H chart?
This pattern could mark the start of a short-term correction, but I’ll only take action if my trading system confirms all the right variables.
Gold has rallied strongly, but momentum looks to be fading. A double top is forming, and with RSI divergence building, this setup has my attention.
Some of the things my system would need to confirm are:
- H4 candle to close in the entry range
- That candle must close with a specific closure rate
- RSI needs to create another divergence
- Lower volume ideally, though this may be exempted due to upcoming data events
📊 Trade Plan:
Risk/Reward: 4.4
Entry: 3 703.0
Stop Loss: 3 719.7
Take Profit 1 (50%): 3 640.4
Take Profit 2 (50%): 3 616.5
💡 GTradingMethod Tip:
When trading double tops, I project the distance from the highest point to the neckline downward to identify profit targets. This keeps my trade plan systematic and objective.
🙏 Thanks for checking out my post!
Follow me to catch the next update and share your thoughts — I’d love to hear how you’re viewing Gold right now.
📌 Please note: This is not financial advice. This content is to track my trading journey and for educational purposes only.

S&P500 | H1 Head and Shoulders | GTradingMethod👋 Hello again fellow Traders,
I already have a short open from 6 633.7, but I’d love to see a Head & Shoulders pattern develop so I can scale into more shorts.
So far, the build-up looks promising — volume has picked up significantly on this drop, which is a bearish signal. That said, I’m still waiting on confirmation before committing further.
📊 Trade Plan:
Risk/Reward: 3.1
Entry: 6 614.3
Stop Loss: 6 625.4
Take Profit 1 (50%): 6 586.9
Take Profit 2 (50%): 6 570.2
🔎 What I Need to See First:
A 30m candle to reach and close in range
Lower volume on the candle that closes in range vs. the left shoulder
More candles forming the right shoulder
💡 GTradingMethod Tip:
Patience is key. The best trades usually come when all conditions align — not just some of them.
🙏 Thanks for checking out my post! Make sure to follow me for updates, and keen to hear what your prediction is.
📌 Please note: This is not financial advice. This content is to track my trading journey and for educational purposes only.

Gold | 30min Double Top | GTradingMethodHello Traders,
I’m watching a potential double top forming on the 3-minute timeframe. For me to confirm and take this setup, I’ll need additional signals to align before entering.
✅ Conditions before entry:
A 30-minute candle must close within the range.
That candle needs to close with a specific closure rate I require.
RSI must print another divergence to confirm weakening momentum.
📊 Trade Plan:
Risk/Reward: 3.0
Entry: 3,697.15
Stop Loss: 3,703.8
Take Profit 1 (50%): 3,681.2
Take Profit 2 (50%): 3,670.6
🙏 Thanks for checking out my post!
Follow me for the next update. Keen to hear what your predictions on gold are and if you have any questions on how I trade double tops!
📌 Please note: This is not financial advice. This content is to track my trading journey and for educational purposes only.

BTC - Drawing your own Heatmaps and Understanding how BTC MovesAs of late I’ve been noticing more and more YouTube videos of analysts referencing coinglass heatmaps as a means of understanding where liquidity is.
Coinglass - if you read the details and disclaimer - is a prediction based algorithm and is not true or accurate data.
In fact, exchanges have no enforcement that encourages them to disclose data such as stop loss locations, leverage ratios, or liquidation zones.
To draw your own liquidity heat map, I demonstrate here how you can do that.
1) Determine the candle sets that move straight up or down - without price reclaiming that area.
2) Draw a box extending out from that section. Respectively these will be buy orders or sell orders.
3) Unlike limit orders for buys and sells, stop losses are extremely important - as they are limit orders that don’t automatically fill if price is at a premium or discount. They only fill if price crosses the exact price, setting off the order.
4) Use your liquidation boxes to determine where these hidden limit orders are in the chart. As we see currently, there is a mass of leveraged sell limit orders (long stop losses) stacked with little to no gaps in between them.
From here, we can understand how Bitcoin moves.
1) The majority of the market cap is leveraging liquidity. Liquidity used by traders leveraging their longs or shorts.
2) These orders leave above (or below) stop loss orders or liquidation prices, that act in the opposite way of traders direction. For example if a trader longs with $100 using 100x, he is leaving underneath his entry a sell order for the entire position size, or $10,000.
3) These stop loss orders trigger a natural chain reaction that fill, one into the next, causing the price to move fluidly as it triggers off the order block areas.
Since Bitcoin has been moving steadily up, sideways, up, sideways - for such a long period, we can deduce that there is a massive chain reaction of sell orders which will allow the price to drop aggressively and fluidly, without any active sell orders being placed by traders.
Traders looking at coinglass or other similar platforms, and stating there is a mass of short liquidity in the chart - are entirely wrong. Zooming out, we can see an overwhelming offset to the long positions left intact in the chart.
The bottom of the price drop will be the end of these stop loss orders. From there, price will leave a quick and quickly start returning to the higher levels.
Hope you found this helpful.
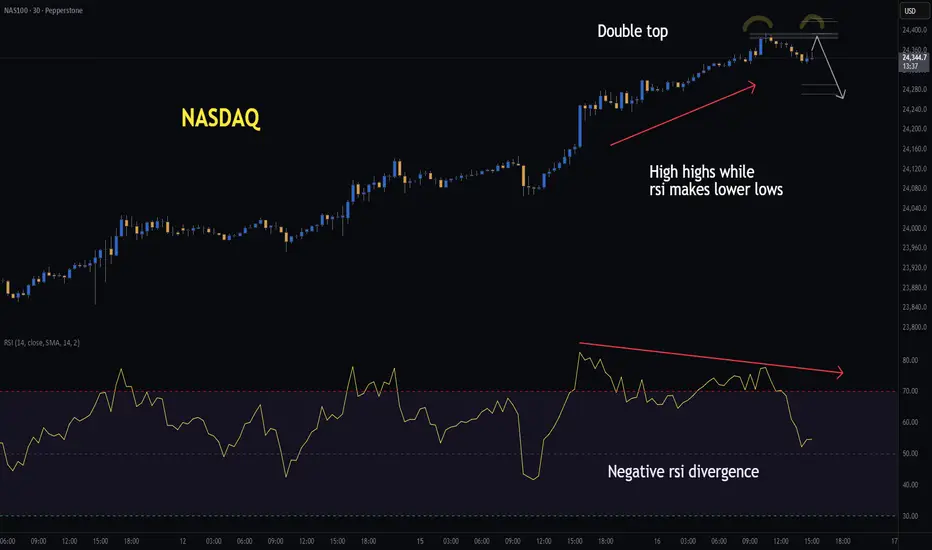
NASDAQ | H1 Double Top | GTradingMethodHello Traders,
I’m watching the Cash100 for a potential double top that could set up a short opportunity. Price is currently making higher highs while RSI is making lower lows — a clear sign of weakening buying momentum, also known as negative RSI divergence.
As further confluence, we have the FOMC tomorrow, and markets often prefer to de-risk ahead of such events. Also, there is a rising wedge on the S&P500 on the hourly chart and the chance that there is also a potential double top on the 30min timeframe.
✅ Conditions before entry:
- 30min candle must close within the range and at the correct level
- The closing candle must meet my required closure rate
- Ideally, volume should be lower (though I’ll allow an exception given it will be the U.S open)
- RSI should confirm with another divergence
📊 Trade Plan:
Risk/Reward: 2.9
Entry: 24,385.1
Stop Loss: 24,418.6
Take Profit 1 (50%): 24,290
Take Profit 2 (50%): 24,271
💡 GTradingMethod Tip:
Patterns like double tops are powerful, but they’re strongest when combined with momentum divergence. Always confirm multiple factors before entering.
🙏 Thanks for checking out my post!
Follow me for the next update and feel free to share your thoughts below — I’d love to hear them.
📌 Please note: This is not financial advice. This content is to track my trading journey and for educational purposes only.
S&P500 | H1 Double Top | GTradingMethod👋 Hello traders,
Tried shorting a potential head and shoulders on the 1H chart earlier — it failed. Thankfully, one of my exit rules triggered before my stop loss, so the loss was small, but still not pleasant. That’s trading.
🧐 Market Overview:
The bigger picture remains the same. On the detailed side, I am looking for a potential double top on the hourly chart. RSI is making lower highs while price is making higher highs, which shows weakening buying momentum. For me, this is a non-negotiable variable when trading double tops and head & shoulders setups.
I’ll be waiting for a candle closure in my entry range, alongside a few more confirmations, before taking the next shot. Patience is key here.
📊 Trade Plan:
Risk/Reward: 3.4
Entry: 6 598.4
Stop Loss: 6 608.3
Take Profit 1 (50%): 6 567.9
Take Profit 2 (50%): 6 557.9
💡 GTradingMethod Tip:
Losses are part of the process. The key is to keep them small, stick to your rules, and wait for probability to play out over time.
🙏 Thanks for checking out my post!
Follow me to catch my next setup, and let me know — do you think this head and shoulders will confirm, or will buyers push the S&P to fresh highs?
📌 Disclaimer:
This is not financial advice. This content is to track my trading journey and for educational purposes only.

S&P500 | H1 Head and shoulders | GTradingMethodHello Traders.
🧐 Market Overview:
I am still holding a short on the rising wedge visible on the 4-hour chart. While the S&P 500 has broken out to the upside of the wedge, there’s still a real chance this could be a fake out.
The RSI is showing overbought conditions across the 1H, 2H, and 4H timeframes, which makes it difficult for price to push higher without cooling off first. From a probability standpoint, I see the short as more favorable here than chasing longs.
With hindsight I should have waited for a reversal pattern to open shorts when trying to trade the risking wedge on the 4 hour chart.
If the head and shoulders pattern on the 1H chart fails, then a possible double top on the 2H chart may form. I’ll post an update if that scenario plays out and I have time.
NB! I do not have confirmation to enter the head and shoulders short yet. It is only on my radar for now.
📊 Trade Plan:
Risk/Reward: 3.8
Entry: 6 589.7
Stop Loss: 6 599
Take Profit 1 (50%): 6 560.2
Take Profit 2 (50%): 6 544.2
💡 GTradingMethod Tip:
A favorable setup doesn’t guarantee success, but managing risk and aligning with probability is how I stay consistent over the long term.
🙏 Thanks for checking out my post!
Make sure to follow me to catch the next idea and please share your thoughts — I’d like to hear them.
📌 Please note: This is not financial advice. This content is to track my trading journey and for educational purposes only.

GBP/USD Full Analysis: Can W e Break Through This Resistance!Price has been moving around a very strong area of resistance and as shown on the on the chart u will see multiple wicks trying to push through this res and failed completely. my prediction for this pair is that USD on the index is struggling to move to the upside and the maid direction is down, also if we combine fundamentals too i believe strongly that USD will continue melting.
for GBP/USD pair i will wait for a daily candle stcik closure above this area of resistance. if i get this then entering a buy trade will be the best and low risk setup

Mastering Market Rhythm Through Adaptation👋Welcome, everyone!
In my previous post, I shared “The Secret Formula: Time + Structure = 80% Win Rate!” – a powerful way to increase your trading accuracy. But here’s the truth: even the best formula won’t work if you apply it blindly to every situation.
That’s why today I want to dive deeper into the next key lesson:
👉 Mastering Market Rhythm Through Adaptation
Why is this important?
The market has its own rhythm. Sometimes it trends strongly, sometimes it ranges, and other times it becomes extremely volatile. If you try to force one strategy on every scenario, you’ll be out of sync – and out of money.
By adapting, you will:
Know when to trade aggressively and when to scale down.
Choose the right strategy for the right market phase.
Most importantly: protect your capital and survive long enough to thrive.
How to adapt in practice
- Identify the market condition: Trend – Range – High Volatility.
- Adjust your strategy:
Clear trend → trend-following.
Range-bound → trade support and resistance.
High volatility → reduce lot size, focus on risk control.
- Multi-timeframe analysis: H1 may look sideways while H4 shows a clear trend.
- Always prepare a Plan B: If the market shifts, you won’t be caught off guard.
Real-world examples
XAUUSD: Fed cuts rates → gold rallies → follow the trend.
EURUSD: Pre-news uncertainty, ranging between 1.0850 – 1.0950 → range trading.
BTCUSDT: ETF approval sparks huge volatility → cut position size, wait for stability.
Final thoughts
There is no “holy grail” in trading. The real edge comes from knowing how to dance in sync with the market’s rhythm . The formula Time + Structure shows you where and when, while market adaptation shows you how long you can stay in the game.
👉 Would you like me to share a live case study on XAUUSD , applying both Time + Structure and Market Condition Analysis step by step?

NASDAQ | H2 Double Top | GTradingMethodHello Traders! 👋
🧐 Market Overview:
CPI is out today — and it could be the spark the NASDAQ needs. Price is stalling at the previous all-time high, and that’s where I’m watching closely.
I’ve been tracking a double top on the daily for a while now, and today the H2 chart is starting to show the same structure. That kind of multi-timeframe alignment doesn’t happen often.
📊 Trade Plan:
I’ve entered a starter short on the daily structure. If the H2 confirms, I’ll scale in with a second position.
Risk/Reward:
Entry:
Stop Loss:
Take Profit 1 (50%):
Take Profit 2 (50%):
💡 GTradingMethod Tip:
Double tops work best when paired with other signals. In my system, I look for:
- RSI negative divergence
- Lower volume on the second top
- A confirmation candle close within my entry range
This reduces false signals and adds conviction.
🙏 Thanks for reading! Do you trade double tops?
📌 Disclaimer:
This is not financial advice. This content is to track my trading journey and for educational purposes only.

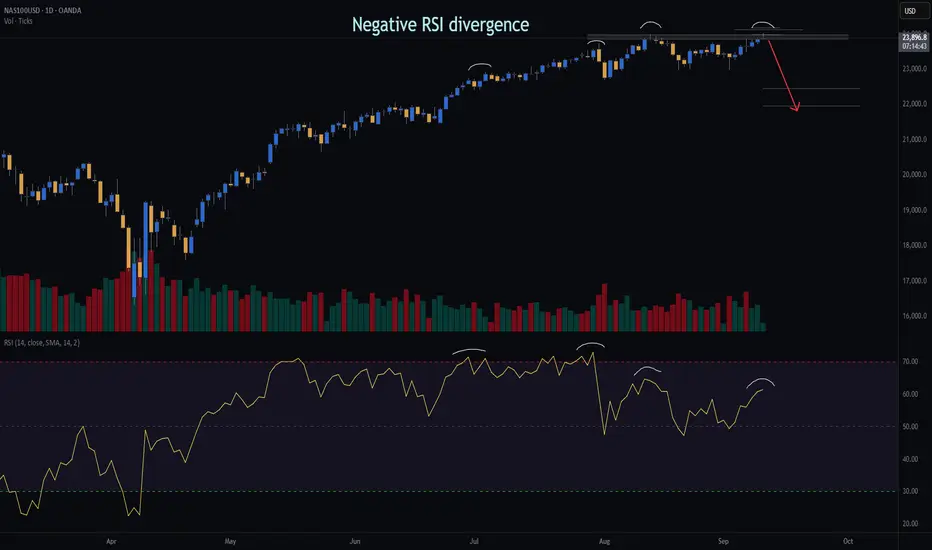
NASDAQ | Daily Double Top | GTradingMethodHello Traders 👋
🧐 Market Overview:
I’ve opened a short on the NASDAQ based on a clear double top setup that formed yesterday. Several of my key variables aligned, giving this trade a high-probability edge:
Negative RSI divergence → showing weakening buying momentum
Lower volume on the second top → indicating exhaustion
Daily candle closure within threshold → confirming structure validity
📊 Trade Plan:
RR: 9.1
Entry: 23 931
Stop Loss: 23 178
Take Profit 1 (50%): 22 453
Take Profit 2 (50%): 21 969
💡 GTradingMethod Tip:
When trading reversal patterns like double tops, I always wait for confirmation across multiple variables (momentum, volume, candle structure). This increases probability and reduces false entries.
🙏 Thanks for checking out my post!
Follow me for more setups and let me know — do you see this double top holding, or is there more upside left in the NASDAQ?
📌 Disclaimer:
This is not financial advice. This content is to track my trading journey and for educational purposes only.
Gold | H4 Double Top | GTradingMethodHello Traders,
🧐 Market Overview:
Over the last 3 weeks, gold has rallied just under 10% — a massive move. While my longer-term outlook remains bullish, my system is currently flagging a potential short. On the 4-hour chart, a double top pattern is forming, signaling a possible pullback.
My system looks for rsi divergence, which is currently present. It also needs to see lower volume on the second top, also already confirmed.
My system has given the green light for opening a short. Now I am just waiting for a good entry point. Time to be patient and follow all my rules.
📊 Trade Plan:
Risk/Reward: 3.5
Entry: 3 664.5
Stop Loss: 3 691.4
Take Profit 1 (50%): 3 592
Take Profit 2 (50%): 3 551
💡 GTradingMethod Tip:
Trading is about probability. This means I need to take every single trade when my edge is available. It also means I need to follow my rules on every single trade.
🙏 Thanks for checking out my post!
Follow me for more setups and let me know — do you think gold will respect this double top or continue its bullish momentum?
📌 Disclaimer:
This is not financial advice. This content is to track my trading journey and for educational purposes only.

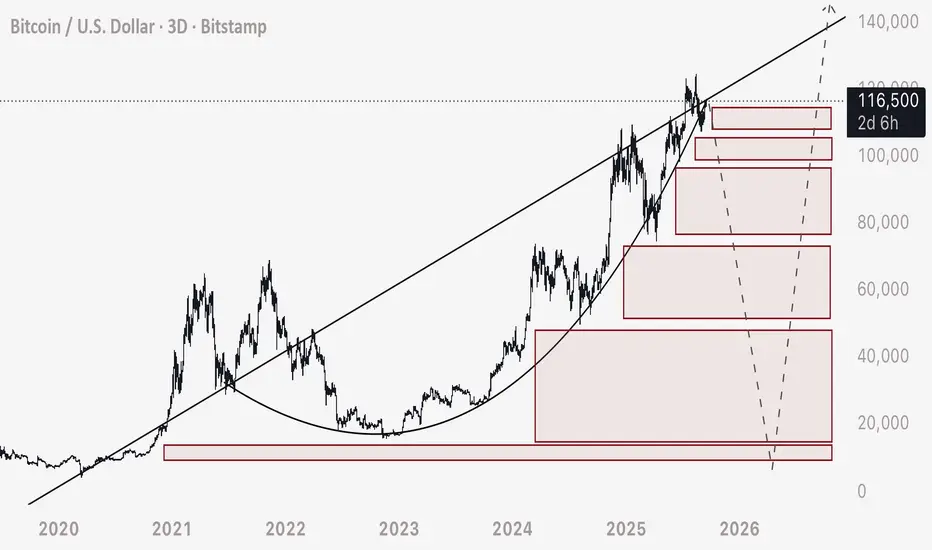
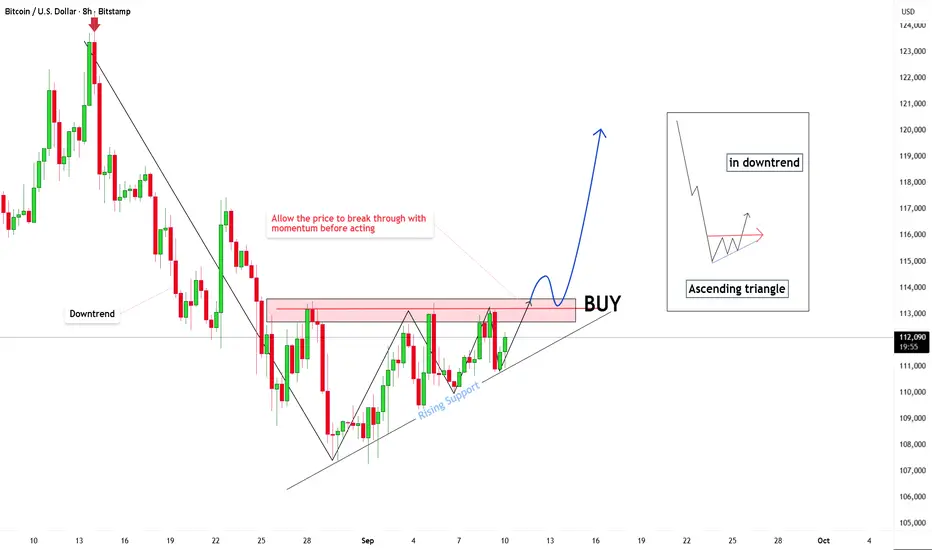
Unlocking the Power of Ascending Triangles in Bitcoin Trading!Hello everyone! 👋
In this analysis, we will explore a popular technical pattern in Bitcoin trading called the Ascending Triangle 🔺 . This is a useful tool that helps us identify potential trading opportunities, especially when the market is in a consolidation phase. Let's dive deeper! 🚀
1. Ascending Triangle Pattern 📊
An Ascending Triangle forms when the price consistently creates higher lows but faces resistance at a fixed price level. This indicates that buyers are in control, but the market needs a strong push to break through the resistance.
2. How to Identify and Read the Pattern 🔍
Higher Lows : In an ascending triangle, the price's successive lows create rising support levels. This shows increasing buying pressure and indicates that the price can’t drop below the established support. 📈
Horizontal Resistance: The resistance level is the area where the price fails to break through for an extended period, creating a horizontal line. For Bitcoin, the current resistance level is 113,000 USD. 🚧
3. Trading Strategy 💡
Wait for a breakout: This pattern typically leads to a breakout when the price exceeds the resistance level. However, it’s crucial not to enter the trade immediately when the price approaches resistance. You should wait for confirmation when the price breaks through the resistance and is followed by a strong candlestick. 🕯️
Enter after confirmation: When the price surpasses the resistance with high volume and a strong candlestick, that’s the ideal time to enter a buy position. This reduces risk when trading. ✔️
4. Support and Resistance Levels 🔄
Resistance: The current resistance at 113,000 USD is critical. If the price breaks this level, we can expect a strong bullish movement. 💥
Support: If the price fails to break through the resistance, keep an eye on support levels like 110,000 USD or lower. When the price returns to these levels, look for signs of a recovery to find a potential buying opportunity. 💪
5. Risk Management ⚖️
Use Stop-Loss: To protect your capital, place a Stop-Loss below the nearest support level. This helps minimize risk if the price doesn’t move as expected. 🔒
Reasonable Profit Target: Set your profit target at the next resistance levels, such as 113,000 USD, 115,000 USD, and even 120,000 USD, which is currently in focus. Always control the risk-to-reward ratio in every trade. 🎯
6. Conclusion 🎓
The Ascending Triangle pattern is a powerful tool for identifying trading opportunities. However, it’s important not to rush into a trade but to wait for confirmation from the market before making a decision. Always remember to manage risk appropriately and follow your trading strategies.
Now, it’s your turn to apply this knowledge in practice. Please like this post if you’ve understood everything and are looking forward to the upcoming lessons—it will be a huge motivation for me. 👍
Wishing you all the best on your journey to becoming an expert! 🌟 Trade safely! 🛡️
Gold | H2 Double Top | GTradingMethodHello Traders 👋
🧐 Market Overview:
I’ll be honest — I’m feeling a little hesitant about entering another Gold trade. The last few setups have gone against my system more than I would like. But trading is always a game of probability — clusters of losses are part of the process.
The key is staying disciplined. Over the long run, probability is in my favour, and that’s why I have to take this trade. My system is flagging a potential double top on the H2 chart, and the so far setup aligns with my rules.
Some of the variables I look for:
- Negative rsi divergence
- decreasing volume on the second top
- Need candle to close in range to take the trade
📊 Trade Plan:
Risk/Reward: 3.7
Entry: 3666
Stop Loss: 3689
Take Profit 1 (50%): 3592
Take Profit 2 (50%): 3565
💡 GTradingMethod Tip:
Even the best systems go through losing streaks. The edge comes not from avoiding them, but from executing consistently and letting probability work itself out over time.
🙏 Thanks for checking out my post!
Make sure to follow me for more setups and share your thoughts — will this H2 double top play out, or does Gold still have momentum to push higher?
📌 Disclaimer:
This is not financial advice. This content is to track my trading journey and for educational purposes only.

Silver | H4 Double Top | GTradingMethod
🧐 Market Overview:
All my variables have been met.
Some of the variables I look for are as follows:
- RSI divergence
- Lower volume on top 2 (In this case JOLTS came out, which causes an exception to the volume rule)
- Attack candle closes in range
Opened a short position on Silver.
📊 Trade Plan:
Risk/Reward: 3.9
🎯 Entry: 41.29
🛑 Stop Loss: 41.67
💰 Take Profit 1 (50%): 39.93
💰 Take Profit 2 (50%): 39.34
💡 GTradingMethod Tip:
Sometimes news events (like JOLTS) can disrupt normal volume behavior. That’s why it’s key to use multiple variables together, not rely on just one signal.
🙏 Thanks for checking out my post!
Make sure to follow me to catch the next idea and please share your thoughts — I’d love to hear them.
📌 Please note:
This is not financial advice. This content is to track my trading journey and for educational purposes only.

Understanding Consolidation & Trading itWhat Consolidation Is
Consolidation is a market phase where price moves sideways within a defined range, showing indecision or balance between buyers (bulls) and sellers (bears).
Characterized by low volatility, overlapping candles, and no clear trend direction.
Often occurs after strong moves (as the market pauses) or before breakouts (accumulation/distribution).
Impact on Bulls & Bears
Bulls: View consolidation near highs as accumulation (buyers building positions before a breakout upward).
Bears: View consolidation near lows as distribution (sellers unloading before a breakdown).
Both sides place stop orders outside the range → creating liquidity pools that smart money hunts.
How Traders Can Take Advantage
Range Trading – Buy near support of the range, sell near resistance, until breakout occurs.
Liquidity Strategy – Wait for fakeouts beyond consolidation, then trade in the opposite direction (stop hunt setup).
Consolidation Across Timeframes
Lower Timeframes (1m–15m):
Looks like noise but is often where scalpers range trade.
Breakouts can give small but quick moves.
Mid Timeframes (1H–4H):
Shows clear accumulation/distribution phases.
Useful for intraday & swing traders.
Higher Timeframes (Daily–Weekly):
Represents major market indecision.
Breakouts from these zones often fuel massive trend moves.
✅ Summary:
Consolidation = sideways range = balance of bulls & bears.
Inside range → fade the extremes.
Outside range → trade support & resistance or liquidity sweep.
On different timeframes → the same consolidation can be noise on 5M, but a critical accumulation on the Daily chart.

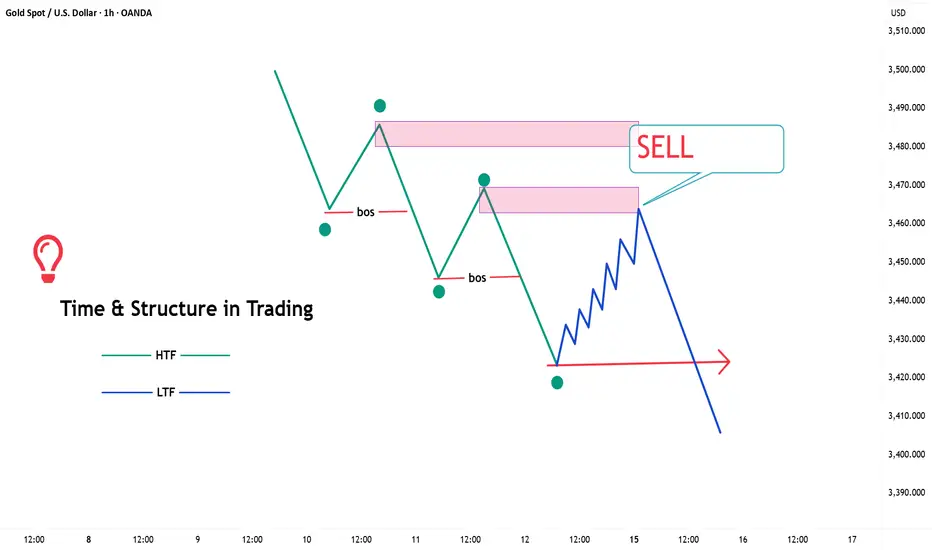
The Secret Formula: Time + Structure = 80% Win Rate!Hello everyone,
If you’re struggling to combine Time (multi-timeframe analysis) and Structure (market framework) to build a solid foundation for predicting what’s likely to happen in the market, this post will reveal the secret many professionals use — with up to 80% win probability!
1. The Core Mindset – Time & Structure
Every timeframe speaks a different language:
- H4, D1 = the bigger picture (overall trend).
- M15, M5, M1 = the micro view (entry signals, internal flow).
The key is: never rely on one timeframe alone – always align them.
2. POI – Points of Interest
- Each timeframe has its own POI (Points of Interest).
- Example: When you find a POI on H4 , don’t rush in.
Zoom into M15 or M5 to see what’s happening inside that zone.
3. Multi-Timeframe Alignment – The Smart Money Way
For example:
- H4: Price taps into a demand zone.
- M15: Structure shifts from bearish → bullish inside that demand zone.
This means H4 is preparing for a rally, and M15 confirms your BUY entry with higher precision.
When multiple timeframes align in the same direction, your probability skyrockets.
4. Why Always Respect the Bigger Picture?
- LTF (Lower Timeframe) = just noise or details.
- HTF (Higher Timeframe) = the real storyline.
If M15 shows a BUY but H4 is strongly bearish, you’re fighting the market.
But if M15 and H4 point the same way , you have a High Probability Setup .
5. Keys to High-Probability Trading
Identify the higher timeframe trend (H4, D1).
Mark strong POIs.
Drop to lower timeframes (M15, M5, M1) to watch for structure shifts.
Only trade when Time & Structure are aligned.
Always manage risk – place SL beyond OB/POI zones.
6. Final Takeaway
High-probability trades appear when multiple timeframes confirm the same direction.
Don’t trade on gut feeling — let Time + Structure guide you, just like Smart Money does.
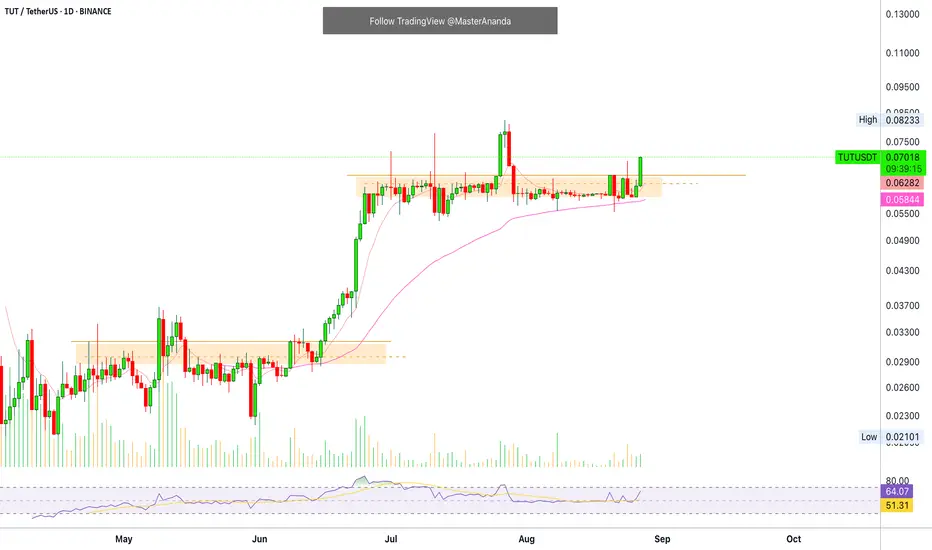
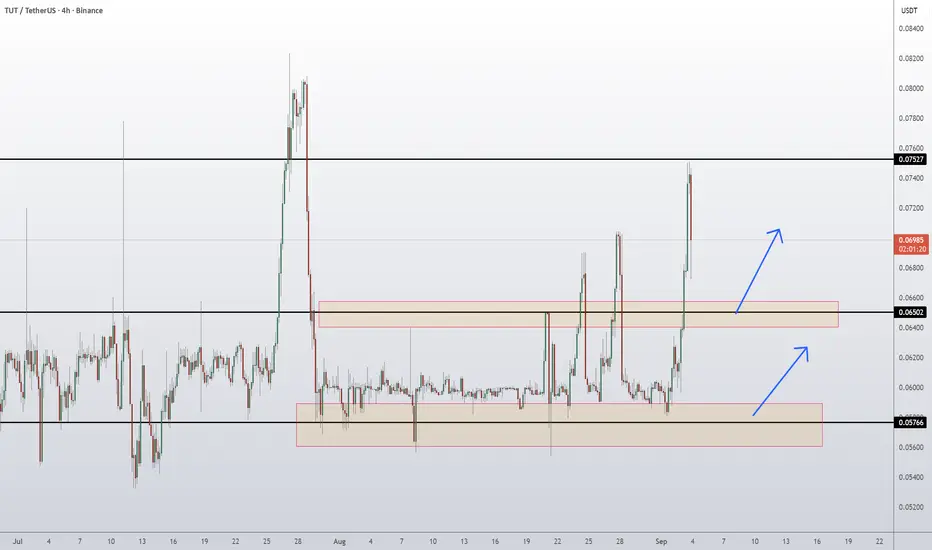
TUT Coin Tutorial Token Price News Today - Price PredictionTUT has recently surged from the 0.0585 support zone, breaking through mid-range resistance at 0.0650 and testing the upper resistance near 0.0755. Price has shown strong bullish momentum, but the sharp rejection wick at the top suggests sellers are defending the 0.0755 barrier. This aligns with the historical supply zone seen in late July.
As long as price remains capped below 0.0755, there is risk of a downside retracement back into the 0.0650 zone. If buyers reclaim and sustain above 0.0755, however, momentum could extend toward new highs.
📊 Key Levels
Support 1: 0.0650 (mid-level support)
Support 2: 0.0585 (major base support)
Resistance: 0.0755 (major cap zone)
Trading Scenarios
📉 Bearish Setup
Sell trigger: Rejection at 0.0755
Sell zone: 0.0735 – 0.0755
Target: 0.0650 support
Invalidation: Break and close above 0.0765
📈 Bullish Setup
Buy trigger: Break and hold above 0.0755
Buy zone: Retest of 0.0750–0.0760 as support
Target: 0.0820–0.0850 extension
Invalidation: Drop back below 0.0730
Summary
Momentum is bullish short-term, but 0.0755 is a key decision level.
A rejection favors a move back to 0.0650.
A breakout above 0.0755 opens path to higher highs.
👉 Follow me for More Real Time Opportunities.
Share your Thoughts if you have any?
Gold | 15min Head and Shoulders | GTradingMethodHello Traders.
Welcome to today's trade idea by GTradingMethod.
🧐 Market Overview:
There’s a potential head and shoulders pattern forming on the 15-minute chart. Gold broke to a new high yesterday, and a healthy breakout often comes with a retest before continuing higher.
This 15-minute head and shoulders could signal that retest — or potentially lead to a deeper correction.
One of the variables I will be looking for is lower volume on the right shoulder.
📊 Trade Plan:
Risk/reward = 3.3
Entry price = 3 536.3
Stop loss price = 3 543.5
Take profit level 1 (50%) = 3 516.8
Take profit level 2 (50%) = 3 506
💡 GTradingMethod Tip:
Patterns can provide an edge, but waiting for confirmation helps you avoid false signals and emotional decisions.
🙏 Thanks for checking out my post!
Make sure to follow me to catch the next idea and please share your thoughts - I would like to hear them.
📌 Please note:
This is not financial advice. This content is to track my trading journey and for educational purposes only.

Gold | H1 Double Bottom | GTradingMethodHello Traders.
Welcome to today's trade idea by GTradingMethod.
🧐 Market Overview
Gold has been making higher highs while RSI has been making lower highs, which is known as negative RSI divergence. This is an indication of weakening buying strength. For further confluence, this potential double top is at the ATH level, which could provide further resistance.
📊 Trade Plan
Risk/reward = 2.9
Entry price = 3 497.6
Stop loss price = 3 515.5
Take profit level 1 (50%) = 3 456.4
Take profit level 2 (50%) = 3 431.9
💡 GTradingMethod Tip
Always predefine your risk for every trade and always accept this risk. If you accept the risk, there can be no emotional pain. If you do not get emotional, you will interpret the market's information objectively.
🙏 Thanks for checking out my post!
Make sure to follow me to catch the next idea and please share your thoughts - I would like to hear them.
📌 Please note:
This is not financial advice. This content is to track my trading journey and for educational purposes only.

Gold | H2 Double Top | GTradingMethod🧐 Market Overview:
Gold is testing a key diagonal resistance level while forming a potential double top on the H2 timeframe. This setup suggests that sellers may step in at this level if resistance holds.
📊 Trade Plan:
Risk/Reward: 4.6
Entry: 3423.1
Stop Loss: 3429.6
Take Profit 1 (50%): 3397.8
Take Profit 2 (50%): 3385.5
💡 GTradingMethod Tip:
Double tops near major resistance often provide high R:R opportunities, but confirmation from price action is key before entering.
🙏 Thanks for checking out my post!
Make sure to follow me to catch the next idea and share your thoughts — I’d love to hear them.
📌 Please note:
This is not financial advice. This content is to track my trading journey and for educational purposes only.

Altcoins Market Bullish Continuation, Supporting SignalsTUTUSDT (Tutorial) has been leading the altcoins market. This pair tends to move ahead of the rest of the altcoins.
Here I am seeing a breakout from a sideways trading range, something similar to May.
Let's say TUTUSDT starts to move forward and this is day one. Why now? Because the market is ready. It starts to move forward and prints a bullish wave similar to June, we know the rest of the market will follow.
The fact that this chart shows perfect sideways action followed by bullish breakouts means that the people behind it are in the know. They know about the 2025 bull market, they know about the altcoins and they aren't about to sell when everything is set to grow.
So there you have it. This signal supports an altcoins market bullish continuation, what I've been saying in the past few days. It is still early, but the retrace already reached its end.
We are going up.
Namaste.