FTSE Challenges Key Resistance - Breakout or False Dawn?UK100 Technical Analysis: 🇬🇧 FTSE Challenges Key Resistance - Breakout or False Dawn? 🌅
Asset: UK100 (FTSE 100 Index CFD)
Analysis Date: September 5, 2025
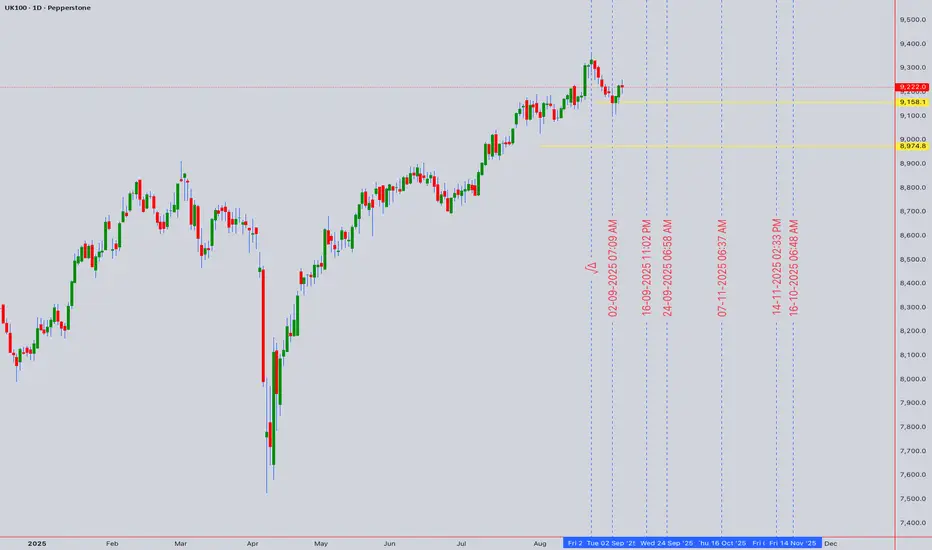
Current Closing Price: 9,222.0 (as of 11:54 PM UTC+4)
Timeframes Analyzed: 1H, 4H, D, W
Executive Summary & Market Outlook 🧐
The UK100 is testing a critical technical and psychological resistance zone between 9,200 and 9,250. 🚧 This level has acted as a significant barrier in the past. The index is in a near-term uptrend but remains in a broader multi-month consolidation phase. A decisive breakout above 9,250 could signal the start of a new bullish leg, while a rejection here would reinforce the range-bound narrative and trigger a pullback. This analysis provides a clear roadmap for intraday 🎯 and swing traders 📈 navigating this pivotal level.
Multi-Timeframe Technical Analysis 🔍
1. Trend Analysis (Daily & 4-Hour Chart):
Primary Trend: 🟡 Range-Bound (Neutral). Price is trapped within a larger consolidation rectangle between ~8,800 and 9,250.
Short-Term Trend: 🟢 Bullish. The recent rally from the 9,000 support has been strong, bringing price to the upper boundary of the range.
2. Key Chart Patterns & Theories:
Range-Bound Consolidation 📊: The dominant pattern is a large rectangle. The current test of the range high (~9,250) is a make-or-break moment. A breakout would be significant, while a rejection is a classic range-trading signal.
Elliott Wave Theory 🌊: The move off the recent low looks corrective (3 waves), suggesting it may be a B-wave or part of a larger consolidation pattern within the range. This reinforces the importance of the 9,250 resistance.
Ichimoku Cloud (H4/D1) ☁️: Price is trading just above the Cloud on the daily chart, indicating a tentative bullish bias. However, the Cloud is relatively flat, reflecting the lack of a strong trend. A clear break above 9,250 would see price move decisively above the Cloud.
Wyckoff Method: The price action could be interpreted as part of a potential re-accumulation phase near the top of the range. A breakout on increasing volume would confirm this.
3. Critical Support & Resistance Levels:
Resistance (R1): 9,220 - 9,250 (Key Range High & Technical Ceiling) 🚨
Resistance (R2): 9,400 (Projected Target if breakout occurs)
Current Closing Price : ~9,222
Support (S1): 9,100 - 9,150 (Immediate Support & 21-period EMA) ✅
Support (S2): 9,000 - 9,050 (Major Range Support - Must Hold) 🛡️
Support (S3): 8,800 (Ultimate Range Low & 200-day EMA)
4. Indicator Consensus:
RSI (14-period on 4H/D): Reading is near 62, in bullish territory but not yet overbought. This suggests there is room for further upside if buyers can maintain control. A bearish divergence here would be a strong sell signal.
Bollinger Bands (4H) 📏: Price is pressing against the upper band, a sign of strong short-term momentum. A rejection here could see price move back towards the middle band.
Moving Averages: The 50 and 200-day EMAs are flat, confirming the range-bound nature. The 21-period EMA on the 4H chart is key short-term dynamic support.
Volume & VWAP: A breakout above 9,250 needs to be confirmed with a significant increase in volume to be trusted. Low-volume breakouts are often false.
Trading Strategy & Forecast 🎯
A. Intraday Trading Strategy (5M - 1H Charts):
Bearish Scenario (Range Rejection Play) ⬇️: This is a classic range trade. Fade the resistance with a short position.
Entry: On clear rejection signals at 9,240-9,250 (e.g., bearish pin bar, engulfing pattern).
Stop Loss: Tight, above 9,270.
Target: 9,150 (TP1), 9,100 (TP2).
Bullish Scenario (Breakout Play) ⬆️: If price breaks out with conviction, wait for a pullback for a better entry.
Entry: On a pullback to re-test 9,220-9,230 as new support.
Stop Loss: Below 9,200.
Target: 9,350 (TP1), 9,400 (TP2).
B. Swing Trading Strategy (4H - D Charts):
Strategy: RANGE TRADING OR BREAKOUT WAIT. The most logical play is to trade the range until it breaks.
Ideal Long Zone: Near the 9,000 - 9,050 support area. ✅
Ideal Short Zone: Near the 9,220 - 9,250 resistance area. ✅
Breakout Strategy: A daily close above 9,270 would be a strong buy signal targeting 9,400+. A daily close below 8,950 would be a strong sell signal.
Risk Management & Conclusion ⚠️
Key Risk Events: UK economic data (GDP, CPI, BoE decisions) and GBP volatility are key drivers. 🔥 As a heavily international index, the FTSE is also highly sensitive to global risk sentiment and commodity prices (particularly oil and mining stocks).
Position Sizing: Trading within a range requires tight stop losses. Ensure your position size allows for a stop placed just outside the range boundaries without incurring excessive risk.
Conclusion: The UK100 is at a critical juncture. ⚖️ The battle between the bulls and the bears is concentrated at the 9,220-9,250 resistance wall. Until a decisive break occurs, the range-bound strategy is favored. Swing traders should be patient for entries near support or a confirmed breakout. Intraday traders can fade the range extremes. The next major move will be dictated by the resolution of this level. 📊
Overall Bias: 🟢 Bullish above 9,270 | 🔴 Bearish below 8,950 | 🟡 Neutral/Range-Bound between 9,000-9,250
For individuals seeking to enhance their trading abilities based on the analyses provided, I recommend exploring the mentoring program offered by Shunya Trade. (Website: shunya dot trade)
I would appreciate your feedback on this analysis, as it will serve as a valuable resource for future endeavors.
Sincerely,
Shunya.Trade
Website: shunya dot trade
⚠️Disclaimer: This post is intended solely for educational purposes and does not constitute investment advice, financial advice, or trading recommendations. The views expressed herein are derived from technical analysis and are shared for informational purposes only. The stock market inherently carries risks, including the potential for capital loss. Therefore, readers are strongly advised to exercise prudent judgment before making any investment decisions. We assume no liability for any actions taken based on this content. For personalized guidance, it is recommended to consult a certified financial advisor.
Ukindex
FTSE 100 Index Closes at an All-Time HighFTSE 100 Index Closes at an All-Time High
Earlier, when analysing the chart of the UK’s FTSE 100 stock index, we outlined an ascending channel and anticipated a scenario with a continued upward trend and an attempt to establish a new historical high.
Since then:
→ The index has risen by almost 5%. The channel structure has shifted slightly, but not dramatically – after adjustment, it remains relevant given the latest price dynamics.
→ Yesterday, the stock index climbed to 9,325, thereby setting an all-time high.
Bullish sentiment was supported by news of a shrinking public sector deficit and increased private sector output. How might the situation develop further?
Technical Analysis of the FTSE 100 Chart
From a bullish perspective:
→ The market remains in bullish territory.
→ The price successfully broke through the resistance zone at 9,180–9,200 (in effect since late July).
→ The 0→1 impulse was strong, signalling buyers’ dominance.
→ The price remains above the 50% Fibonacci retracement of the 0→1 impulse, which may serve as support during a pullback.
→ Additional support could come from the green zone, where bulls were strong during the breakout above the 9,180–9,200 resistance area.
From a bearish perspective: the upper boundary of the channel has confirmed its role as resistance. At the same time, peaks 1 and 2 have formed:
→ They show signs of a bearish Double Top pattern, creating bearish divergence with the RSI indicator.
→ The fact that the second peak is slightly above the first adds weight to the bearish case: this could have been a bull trap for late buyers, while in reality the rally may already be exhausted.
The ability of bulls to keep the price above the green zone may confirm the strength of the FTSE 100. Nevertheless, in the short term, scenarios involving pullbacks and retests of the mentioned support levels might be realised (as seen in early August, when the 9,040 level was tested in an aggressive manner).
This article represents the opinion of the Companies operating under the FXOpen brand only. It is not to be construed as an offer, solicitation, or recommendation with respect to products and services provided by the Companies operating under the FXOpen brand, nor is it to be considered financial advice.


short @6217we propose a downward move on UK INDEX and this will indicate that pairs which one side is GBP will be affected
the downward move is toward 6217 and then 5990

FTSE: LONG OR SHORT ?Following the world economic recovery, FTSE is now in a bullish cycle and here's our view for the upcoming days:
1.LONG : If the price retests the lower trendline and forms back a green bullish candle on the H4 timeframe, a Long position can entered there. And when the price reaches the green doted line, an additional Long position can be entered with more confidence since the price will be breaking a peak that was reached before.
2.SHORT : If the price breaks successfully the lower trendline with many bearish candles, then and only then a Short position can be entered.

UY100 FTSE100 - Wave AnalysisLet's do some Wave counting on the UK100 the FTSE100
4 weeks ago, I did an analysis but it did not do that.
Now once again its showing signs of another Wave 5 down.
This is confusing me though.
Now I'm thinking all the worlds buying stocks so will they sell the UK 100 companies? lets find out
I will also use the 10 Seconds to Elliott Wave Concept to Count The 5 Waves inside what could be a Wave 1 down.

FTSE100: Double Buy Target.The index has broken above both the 1D MA50 and MA200 this week and 1D turned bullish (RSI = 57.795, MACD = 3.690, Highs/Lows = 85.3366) towards the 7,440 Resistance. It appears to be repeating the April - July sequence, currently being at the start of the final (and most aggressive) bullish leg. The obvious short term target is the 7,440 Resistance but in our opinion, and with the 1D RSI potential, if the 1D candle that breaks the Resistance closes above that level, we can extend the uptrend as high as 7,620.
** If you like our free content follow our profile (www.tradingview.com) to get more daily ideas. **
Comments and likes are greatly appreciated.

FTSE UK Stock Index ( 7,190 is a very strong support)Updated View On FTSE (16 Apr 2019)
Back Ground: The bullish "immediate" momentum has definitely slowed. There may be pullback along the way. Watch out the region of 7,190 regions as it may act as strong support.
Target(s): Neutral
SHTF: It will use 7170 to 7190 as strong support region.
DYODD, all the best and read the disclaimer too.
Feel Free to "Follow", press "LIKE" "Comment".
Thank You!
Legal Risk Disclosure:
Trading foreign exchange or CFD on margin carries a high level of risk, and may not be suitable for all investors.
The high degree of leverage can work against you as well as for you. Before deciding to trade foreign exchange you should carefully consider your investment objectives, level of experience and risk appetite.
The possibility exists that you could sustain a loss of some or all of your initial investment and therefore you should not invest money that you cannot afford to lose.
You should be aware of all the risks associated with foreign exchange trading, and seek advice from an independent financial advisor.
DISCLAIMER:
Any opinions, news, research, analyses, prices or other information discussed in this presentation or linked to from this presentation are provided as general market commentary and do not constitute investment advice.
Sonicr Mastery Team does not accept liability for any loss or damage, including without limitation to, any loss of profit, which may arise directly or indirectly from use of or reliance on such information.

FTSE UK Stock Index (Nov 2018) *Wacth 6,980 level!This will be my views of FTSE UK 100 (Nov 2018)
Please make sure to read the "update" comment as there will be changes along the way.
Cheers.
S0nic
Disclaimer:
The information contained in this presentation is solely for educational purposes and does not constitute investment advice. We may or We may not take the trade.
The risk of trading in securities markets can be substantial. You should carefully consider if engaging in such activity is suitable to your own financial situation.
We, Sonicr Mastery dot com is not responsible for any liabilities arising from the result of your market involvement or individual trade activities.
You should be aware of all the risks associated with foreign exchange trading, and seek advice from an independent financial advisor if you have any doubts.

UK100 POTENTIAL WAVE DOWN CONTINUATIONUK100 seems accellerating to the downside with a strong impulse. I'm expecting a pullback to the level posted on chart for one more wave down.

Updated: FTSE UK Stock Index Aug 2018 (Bullish)This will be my views of FTSE Index (Aug 2018)
Please make sure to read the "update" comment as there will be changes along the way.
Cheers.
S0nic
Disclaimer:
The information contained in this presentation is solely for educational purposes and does not constitute investment advice. We may or We may not take the trade.
The risk of trading in securities markets can be substantial. You should carefully consider if engaging in such activity is suitable to your own financial situation.
We, Sonicr Mastery dot com is not responsible for any liabilities arising from the result of your market involvement or individual trade activities.
You should be aware of all the risks associated with foreign exchange trading, and seek advice from an independent financial advisor if you have any doubts.

FTSE UK Stock Index (Ready to hunt Blind investors?)UK Stock Index
Now it is at decent double top, around 7800 region and now bears are clawing back.
If you have long, try to take profit for now as it can go lower for now.
The immediate support is near 7720 and it may get go to 7575 level. DO NOT LONG now.
DYODD and Trade Safe
s0nic
Disclaimer:
The information contained in this presentation is solely for educational purposes and does not constitute investment advice. We may or We may not take the trade.
The risk of trading in securities markets can be substantial. You should carefully consider if engaging in such activity is suitable to your own financial situation.
We, Sonicr Mastery dot com is not responsible for any liabilities arising from the result of your market involvement or individual trade activities.

UK100, what's next?Hello guys! happy new year.
UK100 indice is printing a nice range here and as we can see, it's at a very important point. Break or reversal? Our 2 most important questions. AS usual, we're not the one to decide, so let's watch it and see what the market will decide in the next coming candles.
As for a personal analysis, I bet for a reversal. Price is at the resistance, we have a doji candle and not much volume in the market for price to break the 3 months high. Still, let's wait for the upcoming candles.


UK 100 (FTSE) Daily Update 25 Oct 2016I am still sticking to my Bearish Bias for now... (I am watching other indexes as well, and US index is getting bullish, so i am watching closely)
7050 seem to be a nice resistant level for any bounce..
Trade Safe
s0nic
