LULU Bullish Reversal Alert, +43% Upside Potential on the Table?Hey Realistic Traders!
With the Fed cutting rates, investors rotated out of overpriced AI stocks and into value names. Lululemon stands out after a sharp sell-off compressed valuations to historically attractive levels, and we now turn to technical analysis to see whether price action confirms the bullish case.
Technical Analysis
On the daily chart, NASDAQ:LULU has been trading consistently below the EMA200, reflecting a broader bearish trend. However, a breakout from a wide symmetrical triangle has emerged, signaling a potential bullish reversal.
The breakout was accompanied by a spike in trading volume, while a bullish MACD crossover added confirmation to the bullish bias. Based on this combination of signals, we anticipate a move toward the first target at 221.87, followed by a potential minor pullback before advancing toward the second target at 274.00.
This bullish outlook remains valid as long as price stays above 160.90. A move below this level would invalidate the setup and shift the outlook back to neutral.
Support the channel by engaging with the content, using the rocket button, and sharing your opinions in the comments below.
Disclaimer: "Please note that this analysis is solely for educational purposes and should not be considered a recommendation to take a long or short position on Lululemon."
Undervalued

ALI BABA : SELL OR BUY ??The last time that the price was around 100 $ was at the IPO (2014) and then between AUG 2016- JAN 2017
TOTALL ASSET :
IPO(2014) : 41.27 B
2016: 73.55 B
2017: 114.01 B
2020: 257.86 B
2021 :276.25 B (UNTIL Q3)
GROSS PROFIT :
IPO(2014) : 8.12 B
2016: 14.05 B
2017: 20.66 B
2020: 42.09 B
2021: Q1 + Q2 +Q3 =37.25 + Q4(9.03)(IF WE CONSIDER SAME AZ Q4 OF 2020) = 46.28 B
P/E FORWARD = 7.40 !!!
P/S =2.12 !!!
P/CASH FLOW = 0.10
P/B = 1.79
RETURN ON ASSET = 3.86%
QUICK RATIO = 1.65
DEBT / ASSET RATIO = .08
All these items show the prices are not permanent.

Get Ready for a Strong Recovery on Theta in the Near Future! I believe Theta will see a strong recovery very soon based on this ABC correction, the same pattern BCH experienced. This will lead to a sharp recovery and a strong bullish move in the near future. It could be very profitable and mark the beginning of a massive run for this coin in the bigger picture. Theta is heavily undervalued and ready for big things.
As always, stay profitable.
– Dalin Anderson

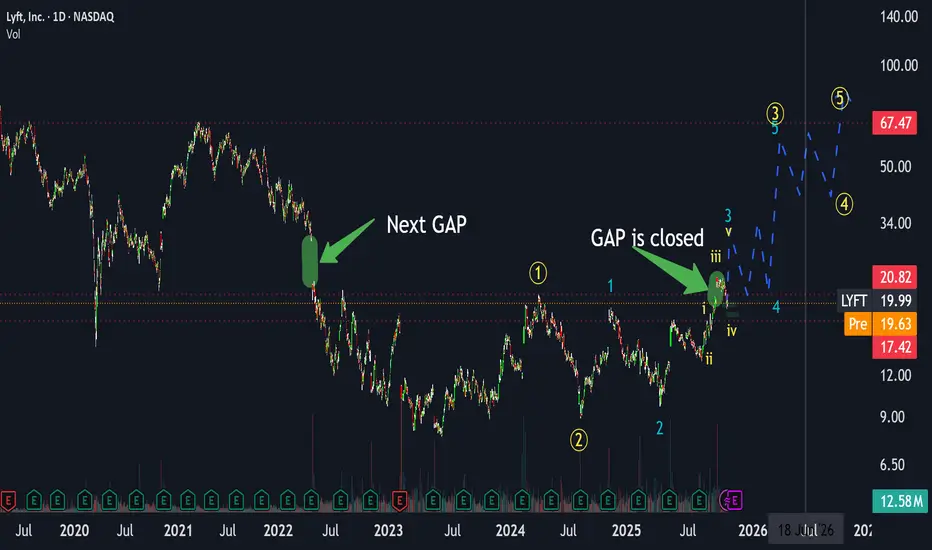
LYFT: The Hidden Gem in My October Top 3 PicksAs I’ve mentioned in my recent videos, LYFT is one of my top 3 priority stocks for October — and for good reason.
The fundamentals have exploded while the price is still lagging far behind.
🔸 Fundamentals
EPS growth has been massive .
– In March, EPS was up +128% YoY,
– and by June, it jumped to +234% YoY.
EPS has finally moved into positive territory , which is a strong signal.
Revenue continues to rise steadily, and EPS literally took off while the price hasn’t followed yet.
To put it in perspective — when LYFT traded around $60, EPS was negative .
Now, EPS is many times higher, but the stock still trades far below those levels.
Even emission has stopped increasing (we saw –0.25% in June 2025), and the forward P/E is only 15.3 ,
which is extremely low for this kind of EPS acceleration.
→ In short: LYFT looks deeply undervalued from a fundamental standpoint.
🔸 Technical Picture
Technically, LYFT has just closed a local gap , exactly as expected.
We are currently finishing the fourth sub-wave of the third global wave .
This means the fifth wave is coming next, and the current target around $70 represents only the peak of the third sub-wave — there is still additional upside expected beyond $70.
In the short term, we could see a retest around $18 ,
followed by the next major move — closing the May 2022 gap near $30 , forming the third wave of this cycle.
After that, some consolidation is likely in the $20–30 range,
followed by the next impulse targeting $50–70 .
This will be the fourth wave pullback, eventually leading into the fifth wave breakout above $70 ,
with potential for even higher upside as the global third wave continues.
Summary
Overall, LYFT shows a perfect mix of improving fundamentals and bullish technical structure.
As I’ve said in my latest videos, this stock could take off soon —
and it remains one of my Top 3 picks for October .
Call to Action
If you enjoy this type of analysis or would like me to review other tickers, tap on rocket 🚀 and leave a ticker in the comments .
I’ll make sure to cover your suggestions in upcoming posts soon!
(Full breakdown and context discussed in my recent videos — you can find them via my profile.)
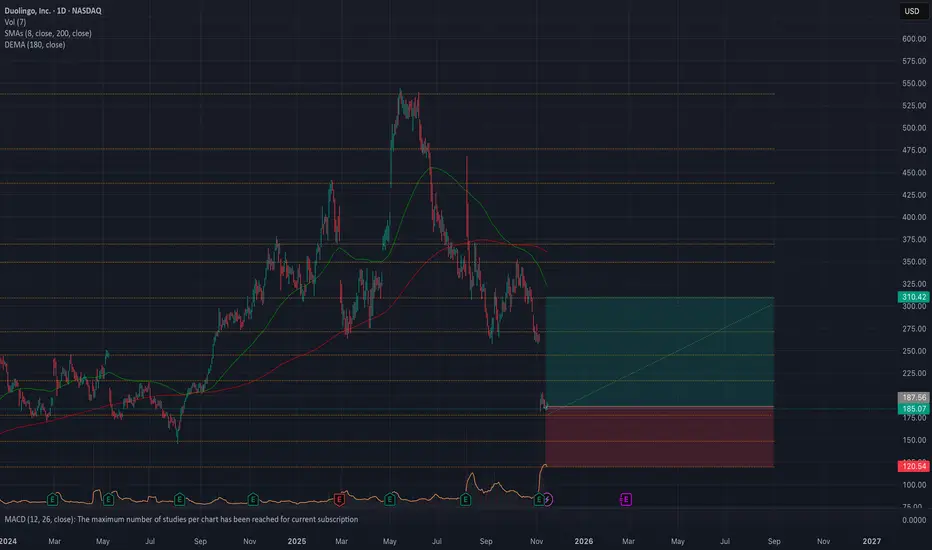
DUOL is better than ONEYeah I'm going in. Investors are shitting there pants because EPS is going down, when it was due to a one time tax credit....and not because the business is in trouble. Growth is Strong, PE is in a great place, it's undervalued.
Downside maybe 150... I don't see it going much lower than that.
Upside? 300, 420, 500? sky's the limit.
$MAGS: Magnificent Seven ETF – Tech Titan or Overhyped?(1/9)
Good afternoon, everyone! ☀️ CBOE:MAGS : Magnificent Seven ETF – Tech Titan or Overhyped?
With MAGS at $46.85, is this ETF a powerhouse of tech giants or just another bubble waiting to burst? Let’s decode the code! 🔍
(2/9) – PRICE PERFORMANCE 📊
• Current Price: $ 46.85 as of Mar 18, 2025 💰
• Recent Move: Likely up, reflecting tech sector strength, per data 📏
• Sector Trend: Tech stocks soaring with AI and cloud hype 🌟
It’s a tech fest—let’s see if it’s worth the buzz! ⚙️
(3/9) – MARKET POSITION 📈
• Market Cap: Approx $1.87B (assuming 40M shares) 🏆
• Operations: Tracks Apple, Microsoft, Amazon, Alphabet, Meta, Tesla, Nvidia ⏰
• Trend: Dominant players in tech, driving innovation and market trends 🎯
Firm in the heart of Silicon Valley! 🚀
(4/9) – KEY DEVELOPMENTS 🔑
• Tech Rally: Magnificent Seven companies hit new highs, per data 🌍
• Earnings Season: Strong Q4 results from underlying firms, per posts on X 📋
• Market Reaction: MAGS up, reflecting sector momentum 💡
Navigating through tech’s highs and lows! 🛢️
(5/9) – RISKS IN FOCUS ⚡
• Regulatory Scrutiny: Antitrust concerns for big tech players 🔍
• Market Volatility: Tech stocks prone to swings due to innovation and competition 📉
• Economic Factors: Interest rates and global economic conditions impact growth ❄️
It’s a risky ride—buckle up! 🛑
(6/9) – SWOT: STRENGTHS 💪
• Industry Leaders: The Magnificent Seven are pioneers in their fields 🥇
• Growth Potential: AI, cloud computing, and other tech trends fuel expansion 📊
• Dividend Payouts: Some companies offer dividends, adding income potential 🔧
Got the best of both worlds! 🏦
(7/9) – SWOT: WEAKNESSES & OPPORTUNITIES ⚖️
• Weaknesses: High valuations, potential for overinvestment 📉
• Opportunities: Emerging technologies like quantum computing, biotech integration, per strategy 📈
Can they stay ahead of the curve? 🤔
(8/9) – POLL TIME! 📢
MAGS at $46.85—your take? 🗳️
• Bullish: $50+ soon, tech’s unstoppable 🐂
• Neutral: Steady, risks balance gains ⚖️
• Bearish: $40 looms, overhyped and due for correction 🐻
Chime in below! 👇
(9/9) – FINAL TAKEAWAY 🎯
MAGS’s $46.85 price reflects the dynamism of the tech sector 📈, but with risks from valuations and regulatory pressures 🌿. DCA-on-dips could be a strategy to manage volatility. Gem or bust?

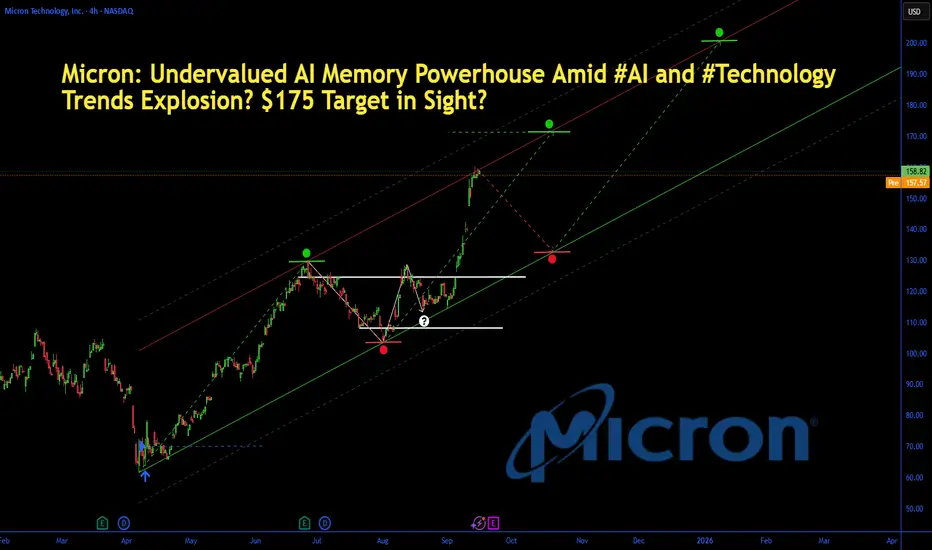
Micron: AI Memory Powerhouse Amid #AI and #TechnologyMicron: Undervalued AI Memory Powerhouse Amid #AI and #Technology Trends Explosion? $175 Target in Sight?
Micron (MU) shares hit a new 52-week high of $158.28 today, up 1.2% amid surging AI data center demand and institutional buying, with the stock soaring 86.8% YTD on memory chip tailwinds.
As Q4 fiscal 2025 earnings loom on September 23—projecting 58% EPS jump to $1.29 on $8.7B revenue—analysts have hiked targets to $175, implying 10%+ upside. Just as #AI racks up 17K mentions and #technology trends with 46K on X today (fueled by AI video generators and chip hype), Micron's HBM3E tech for Nvidia GPUs positions it as the undervalued play in the $200B+ semiconductor memory market.
But with forward P/E at 12x, is MU set to ride the AI wave higher, or will supply gluts cap the rally? Let's unpack the fundamentals, SWOT, charts, and setups for September 17, 2025.
Fundamental Analysis
Micron's resurgence is driven by AI hyperscaler demand for high-bandwidth memory (HBM), with Q2 fiscal 2025 revenue hitting $9.3B (up 93% YoY) and data center sales doubling to $2.2B.
Analysts forecast 2025 revenue of $38.5B (up 50% YoY), as HBM capacity ramps to 250K wafers amid #AI trends exploding on social media. Trading at 18% below fair value per DCF, MU's undervaluation shines with gross margins rebounding to 37%—but cyclical DRAM risks could flare if PC demand softens.
- **Positive:**
- AI boom ties into today's #technology hype, with HBM3E sales projected at $2.5B in FY2025; institutional stakes rising signal confidence.
- Q2 EPS beat of $1.18 (vs. $1.00 est.) and $1.6B FCF undervalues the stock at 12x forward earnings vs. sector 25x.
- Broader trends in edge AI and automotive chips position MU for 20%+ CAGR, amplified by #AI video generator virality.
- **Negative:**
- Inventory overhang from prior cycles could pressure pricing, clashing with #technology optimism if China trade tensions escalate.
- High capex ($8B annually) strains balance sheet if AI adoption slows amid economic jitters.
SWOT Analysis
**Strengths:** Leadership in DRAM/NAND with 20%+ market share; AI-optimized HBM tech generates 50%+ gross margins, amplified by #AI relevance in data centers.
**Weaknesses:** Cyclical exposure to consumer electronics; $7.8B net debt limits agility in a volatile #technology market.
**Opportunities:** HBM ramp to meet Nvidia/AMD demand unlocks $5B+ revenue; undervalued at 12x P/E amid 58% EPS growth and #AI boom on X.
**Threats:** Supply chain disruptions from geopolitics; competition from Samsung/SK Hynix capitalizing on #technology trends.
Technical Analysis
On the daily chart, MU is in a parabolic uptrend, breaking 52-week highs after consolidating above $140 support, with volume exploding on AI news and mirroring #AI volatility spikes. The weekly shows a cup-and-handle breakout from summer lows, now accelerating higher. Current price: $158.28, with VWAP at $156 as intraday pivot.
Key indicators:
- **RSI (14-day):** At 74, overbought but fueled by momentum—watch for consolidation amid #technology surges. 📈
- **MACD:** Bullish crossover with surging histogram, confirming AI-driven acceleration; minimal divergence. ⚠️
- **Moving Averages:** Price crushing 21-day EMA ($145) and 50-day SMA ($130), golden cross locked in.
Support/Resistance: Key support at $150 (recent breakout and 50-day SMA), resistance at $165 (Fib extension) and $175 (analyst target). Patterns/Momentum: Cup-and-handle targets $200; strong buy signals. 🟢 Bullish signals: Volume on earnings hype. 🔴 Bearish risks: Overbought RSI could pull back 5-8% on profit-taking.
Scenarios and Risk Management
- **Bullish Scenario:** Smash $165 on earnings beat or #AI catalyst targets $175 short-term, then $200 by year-end. Buy dips to $150 for entries tied to tech trends.
- **Bearish Scenario:** Breach $150 eyes $140 (200-day EMA); supply news amid #technology fade could retrace 10%.
- **Neutral/Goldilocks:** Range-bound $150–$165 if data mixed and #AI cools, ideal for straddles pre-earnings.
Risk Tips: Set stops 3% below support ($145.50) to tame volatility. Risk 1-2% per trade. Diversify with NVDA or SMH to hedge semi correlations.
Conclusion/Outlook
Overall, a bullish bias if MU holds $150, supercharged by today's #AI and #technology trends, cementing its undervalued status with 40%+ upside on memory demand. But watch September 23 earnings for confirmation—this fits September's chip rotation amid viral AI hype. What’s your take? Bullish on MU amid #AI chip trends or fading the rip? Share in the comments!
BTC Digital Asset Amid #Bitcoin? $150,000 Target in Sight? BTC: Undervalued Digital Asset Amid #Bitcoin? $150,000 Target in Sight? 🚀
BTC at $111,000 (-1%), undervalued with growing adoption amid X buzz on wealth and upward moves—analysts project $125,000-$200,000 for 2025, average $150,000 implying 35% upside, pondering if institutional inflows drive surge. 📈
**Fundamental Analysis**
Market cap $2.21T with circulating supply 19.93M; undervalued as hedge against inflation with high ROI potential from ETF inflows and central bank interest, fundamentals bolstered by halving-reduced supply.
- **Positive:** Store of value appeal; institutional adoption rising.
- **Negative:** Volatility; regulatory uncertainties.
**SWOT Analysis**
**Strengths:** Limited supply scarcity; global liquidity.
**Weaknesses:** Energy consumption concerns; price swings.
**Opportunities:** ETF expansions; sovereign reserves.
**Threats:** Government bans; alternative cryptos.
**Technical Analysis**
Chart consolidating post-rally with building momentum. Price: $111,000, VWAP $110,500.
Key indicators:
- RSI: 55 (neutral with upside room).
- MACD: Positive crossover signal.
- Moving Averages: Above 50-day $100,000, 200-day $80,000 (bullish).
Support/Resistance: $100,000/$120,000. Patterns/Momentum: Bull flag targeting $150,000. 📈 Bullish | ⚠️ Bearish.
**Scenarios and Risk Management**
- **Bullish:** Sentiment rebound to $120,000; DCA on support tests for cost averaging.
- **Bearish:** Market correction drops to $100,000.
- **Neutral:** Ranges $110,000 on volume buildup.
Risk Tips: 1% risk per trade, stops at $100,000, diversify holdings, DCA to mitigate swings. ⚠️
**Conclusion/Outlook**
Bullish on regulatory tailwinds. Watch ETF flows. Fits #Bitcoin theme with adoption upside. Take? Comment!

Pfizer (PFE): Undervalued Pharma Giant Amid #Economy Resilience?Pfizer (PFE): Undervalued Pharma Giant Amid #Economy Resilience? $28.90 in Sight? 📈
At $24.04 (+0.04%), PFE offers a compelling entry with its low P/E of 12.72 and robust 7.15% dividend yield, trading well below analyst targets of $28.90 (20% upside potential)—could resilient economic forecasts boost healthcare demand and spark a rally? 🚀
**Fundamental Analysis**
Pfizer boasts EPS (TTM) of $1.89 and revenue (TTM) of $63.83B, with a PEG ratio of 0.96 signaling undervaluation relative to growth prospects; DCF models suggest intrinsic value above current levels given strong cash flows of $16.02B, though patent expirations weigh on margins.
- **Positive:** High dividend yield supports income-focused portfolios; diversified pipeline in oncology and vaccines drives long-term revenue stability.
- **Negative:** Elevated enterprise value/EBITDA at 9.15 reflects debt from acquisitions; regulatory hurdles could delay new approvals.
**SWOT Analysis**
**Strengths:** Broad product portfolio and global reach; strong R&D investment.
**Weaknesses:** High debt levels post-acquisitions; dependency on blockbuster drugs.
**Opportunities:** Expanding into emerging markets amid economic growth; AI-driven drug discovery partnerships.
**Threats:** Generic competition; geopolitical tensions impacting supply chains.
**Technical Analysis**
Chart shows consolidation in a tight range with emerging bullish momentum. Price: $24.04, VWAP $24.10.
Key indicators:
- RSI: 45 (neutral, room for upside without overbought risk).
- MACD: Positive crossover signaling building momentum.
- Moving Averages: 50-day at $25 (potential breakout level), 200-day at $26 (long-term trendline).
Support/Resistance: Support at $23, resistance at $25. Patterns/Momentum: Ascending triangle forming, favoring bulls on volume increase. 📈 Bullish | ⚠️ Bearish.
**Scenarios and Risk Management**
- **Bullish:** Entry above $25 on volume, DCA in dips to average down for 20% upside to targets.
- **Bearish:** Drop below $23 on weak earnings, exit positions.
- **Neutral:** Sideways trade between support/resistance amid macro waits.
Risk Tips: Set stops at 5% below entry, limit position to 2-3% of portfolio, diversify across sectors, and apply DCA to mitigate volatility. ⚠️
**Conclusion/Outlook**
Bullish bias if economic resilience sustains healthcare spend. Watch Fed remarks. Fits value theme with #Economy upside. Take? Comment!

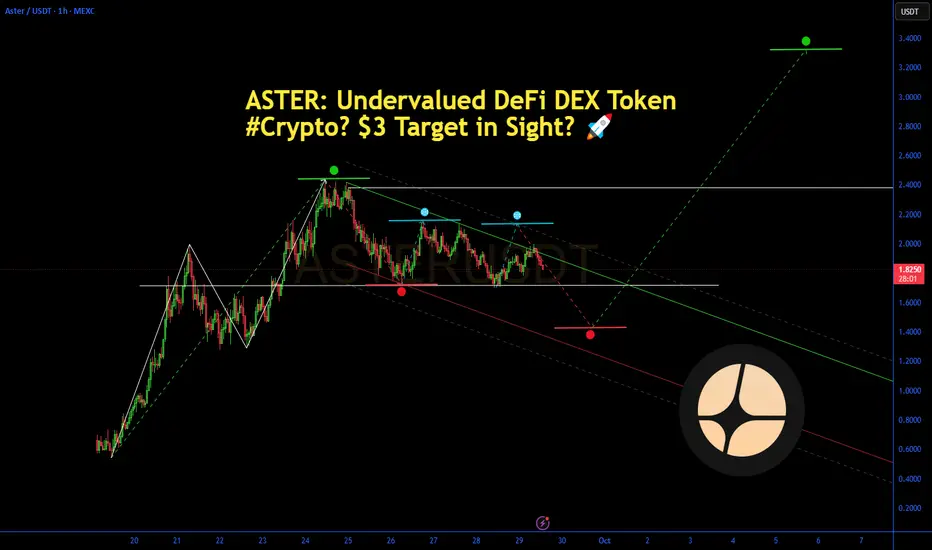
ASTER: Undervalued DeFi DEX Token $3 Target in Sight?ASTER: Undervalued DeFi DEX Token Amid #Crypto? $3 Target in Sight? 🚀
ASTER at $1.84 (+10.49%), undervalued with multi-chain DEX features and $400M+ TVL amid Mr. Beast whale moves and X buzz—analysts project $3 average target for 2025, 51% upside, pondering if MEV-free trading fuels rally. 📈
**Fundamental Analysis**
Market cap $3.3B with 24h volume $1.2B; undervalued vs. peers on capital efficiency (yield-generating collateral), high ROI from RWA integrations and community governance, fundamentals boosted by DWF backing and multi-chain expansions.
- **Positive:** MEV-free execution; cross-chain perpetuals and spot trading.
- **Negative:** High volatility as new entrant; limited analyst coverage.
**SWOT Analysis**
**Strengths:** Innovative Simple/Pro modes; privacy-focused L1 chain.
**Weaknesses:** Recent launch risks; scalability challenges.
**Opportunities:** DeFi boom; stock perpetuals adoption.
**Threats:** Regulatory hurdles; competitor dominance.
**Technical Analysis**
Chart in volatile uptrend post-launch. Price: $1.99, VWAP $1.95.
Key indicators:
- RSI: 61 (bullish momentum, not overbought).
- MACD: Positive (upward signal).
- Moving Averages: Above short-term averages (mixed long-term due to newness).
Support/Resistance: $1.71/$2.41. Patterns/Momentum: Rebound from lows targeting $2.50. 📈 Bullish | ⚠️ Bearish.
**Scenarios and Risk Management**
- **Bullish:** Whale activity pushes to $2.50; DCA on support tests for averaged entry.
- **Bearish:** Profit-taking drops to $1.50.
- **Neutral:** Consolidates at $2.00 on volume buildup.
Risk Tips: 1% risk per trade, stops at $1.80, diversify DeFi holdings, DCA to counter swings. ⚠️
**Conclusion/Outlook**
Bullish if TVL growth persists. Watch multi-chain updates. Fits #Crypto theme with DEX upside. Take? Comment!
TTD: AdTech Giant Amid #Altseason Buzz? $72 in Sight?TTD: Undervalued AdTech Giant Amid #Altseason Buzz? $72 in Sight? Price at $49.64 (+4.33%), tied to Q2 earnings beat and crypto ad surge on X/Reddit, undervalued with 53% upside to targets, questioning if data growth sparks rally.
Fundamental Analysis
EPS $0.83 TTM, revenue growth 23.18% TTM, expected EPS growth 40.25% 5Y, P/E 56.12; Graham formula IV $74.76, PEG 1.39 (near 1, undervalued per Lynch on growth), DCF suggests moat in programmatic ads; incentives align management with revenue beats, inversion highlights competition risks.
Positive:
18.2% 5Y revenue forecast.
Strong cash $1.69B.
Negative:
Volatility 7.2%.
Short-term sell signals.
SWOT Analysis
Strengths: Leading platform, high moat via data.
Weaknesses: High beta 1.08.
Opportunities: #Crypto ad expansion.
Threats: Market slowdowns.
Technical Analysis
Rebound from lows, neutral rating. Price: $47.14, VWAP N/A. Key indicators: RSI: 35/selling pressure.
MACD: Level (12,26) N/A.
Moving Averages: 5-day DMA 44.84.Support/Resistance: 43.79/45.27. Patterns/Momentum: Buy signal short-term. Bullish | Bearish. Scenarios and Risk Management Bullish: Break $45, DCA for $72 on earnings; second-order thinking sees ad surge amplifying gains.
Bearish: Below $43.79.
Neutral: Range trading.Risk Tips: Stops 5-10% below, diversify 5%, DCA dips.
Conclusion/Outlook
Bullish if growth sustains, lollapalooza from #Altseason boosts upside. Watch Q3 earnings. Fits adtech theme with #Crypto upside. Take? Comment!

NVDA: Undervalued AI Chip Leader Amid #YoungInvestorPortfolio?NVDA: Undervalued AI Chip Leader Amid #YoungInvestorPortfolio? $209 Target in Sight? 🚀
NVDA trades at $178.19 (+1.45%), undervalued with dominant AI GPU demand tying into Reddit young investor buzz on portfolios—analysts forecast average $209 target, 17% upside from robust data center growth, questioning if Blackwell rollout sparks breakout. 📈
**Fundamental Analysis**
EPS $3.51 ttm with revenue $165.218B and 71.55% YoY growth; P/E 52.56 reflects relative undervaluation in high-growth tech, DCF models indicate 15-20% intrinsic premium on AI expansions.
- **Positive:** Leading AI market share; strong cash flow generation.
- **Negative:** High capex demands; supply chain vulnerabilities.
**SWOT Analysis**
**Strengths:** Innovative GPU technology; data center dominance.
**Weaknesses:** Valuation sensitivity to growth slowdowns.
**Opportunities:** Expanding AI adoption; strategic partnerships.
**Threats:** Regulatory scrutiny; intensifying competition.
**Technical Analysis**
Chart in uptrend with strong volume support. Price: $178.19, VWAP $177.
Key indicators:
- RSI: 53 (neutral, upside potential).
- MACD: Positive signal line.
- Moving Averages: Above 50-day $170, 200-day $150 (bullish).
Support/Resistance: $170/$185. Patterns/Momentum: Ascending triangle targeting $200. 📈 Bullish.
**Scenarios and Risk Management**
- **Bullish:** AI demand surge to $200; DCA on pullbacks below $175 for averaged gains.
- **Bearish:** Chip shortages drop to $160.
- **Neutral:** Consolidates at $180 awaiting earnings.
Risk Tips: Stops at 5% below entry, limit to 2% portfolio, diversify tech exposure, DCA to handle volatility. ⚠️
**Conclusion/Outlook**
Bullish if AI trends accelerate. Watch Q3 earnings. Fits tech theme with #YoungInvestorPortfolio upside. Take? Comment!

Adobe (ADBE): Undervalued AI Software Leader Amid #AI Boom? Adobe (ADBE): Undervalued AI Software Leader Amid #AI Boom? $456 in Sight? 📈
Trading at $364.08 (-0.50%), ADBE's P/E of 22.67 undervalues its AI-integrated creative tools, with analysts eyeing $456 (25% upside)—will surging #AI trends propel cloud subscriptions higher? 🚀
**Fundamental Analysis**
EPS (TTM) of $16.06 and revenue (TTM) of $23.18B underscore strong growth, with PEG at 1.04 indicating fair valuation for expansion; fundamentals highlight recurring revenue model, though competition in AI space pressures margins.
- **Positive:** Dominant market share in creative software; AI features like Firefly boost user adoption.
- **Negative:** High valuation multiples vs peers; dependency on subscription renewals.
**SWOT Analysis**
**Strengths:** Innovative AI ecosystem; loyal user base.
**Weaknesses:** Premium pricing limits accessibility; integration risks with new tech.
**Opportunities:** Expanding AI tools in enterprise; partnerships in digital marketing.
**Threats:** Open-source AI alternatives; economic slowdowns hitting ad spends.
**Technical Analysis**
Chart displays upward channel with recent pullback testing support. Price: $364.08, VWAP $365.
Key indicators:
- RSI: 55 (mildly bullish, approaching overbought).
- MACD: Bullish divergence emerging.
- Moving Averages: 50-day at $370 (short-term hurdle), 200-day at $400 (major resistance).
Support/Resistance: Support at $350, resistance at $380. Patterns/Momentum: Bull flag pattern, momentum building on AI news. 📈 Bullish | ⚠️ Bearish.
**Scenarios and Risk Management**
- **Bullish:** Break above $380, DCA on pullbacks to capture AI-driven rally.
- **Bearish:** Fall to $350 on macro fears, reduce exposure.
- **Neutral:** Range-bound until earnings clarity.
Risk Tips: Use trailing stops at 7%, cap risk at 2% per trade, diversify with non-tech, DCA for long-term holds. ⚠️
**Conclusion/Outlook**
Strong bullish potential conditioned on #AI momentum. Watch tech sector flows. Fits growth theme with upside. Take? Comment!

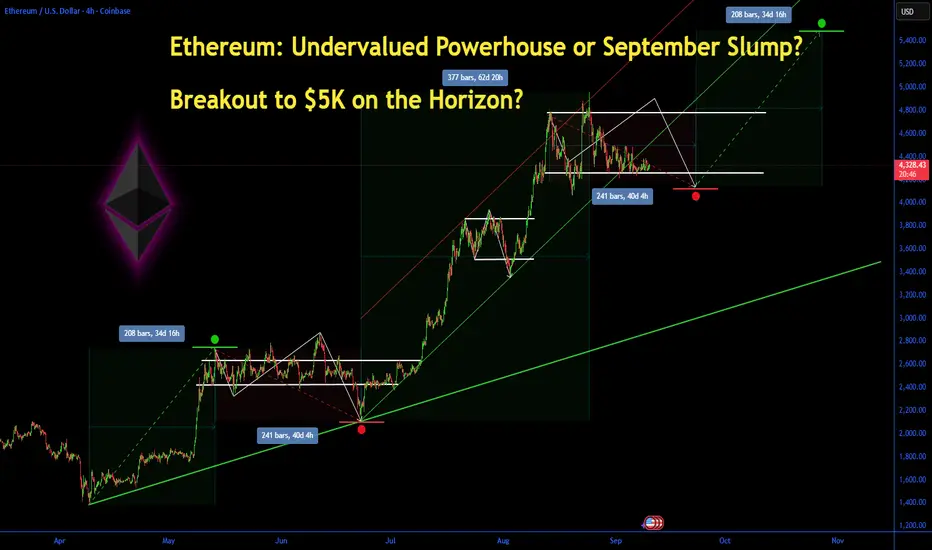
Ethereum: Undervalued Powerhouse or September Slump? Ethereum: Undervalued Powerhouse or September Slump? Breakout to $5K on the Horizon?
Ethereum (ETH) has held steady around $4,300 this month amid a choppy crypto market, down about 15% from its August all-time high but showing resilience with a modest 0.52% gain today to $4,328.5. Early September saw over $500 million in outflows from spot Ethereum ETFs, reversing summer inflows and fueling doubts about institutional appetite.
Yet, with analysts eyeing a potential rally to $9,000–$12,000 by year-end 2025 driven by ETF rotation and broader adoption, is ETH the undervalued blue-chip crypto ready for a rebound, or will seasonal weakness cap its upside? Let's dive into the fundamentals, charts, and key levels to navigate this pivotal moment.
Fundamental Analysis
Ethereum's core drivers remain tied to its ecosystem growth and macroeconomic tailwinds, but recent ETF flows have introduced volatility. As the backbone for DeFi, NFTs, and layer-2 scaling, ETH benefits from rising staking rewards and network upgrades like Dencun, which have boosted efficiency.
Analysts project ETH could hit $5,194 by late September, with long-term forecasts up to $12,000 in 2025 if institutional demand surges via ETFs. However, sticky inflation and Fed policy uncertainty could delay rate cuts, pressuring risk assets like crypto.
- **Positive:**
- Record ETF inflows in July–August signal growing institutional interest; recent positive territory returns hint at rotation back to ETH.
- Staking growth and adoption in DeFi (e.g., Aave, Uniswap) underscore undervaluation, with ETH's market cap at ~$520 billion versus Bitcoin's dominance.
- Broader trends like AI-blockchain integration and regulatory clarity (e.g., potential spot ETFs for challengers like Sui) bolster ETH's utility.
- **Negative:**
- $500M+ ETF outflows in early September reflect profit-taking and risk-off sentiment amid U.S. labor market weakness.
- Seasonal September weakness in crypto, compounded by geopolitical risks, could extend the correction if Bitcoin falters.
Technical Analysis
On the daily chart, ETH is coiling in a tight symmetrical triangle pattern after bouncing from the $4,320–$4,325 support base, with volume picking up on the upside. This consolidation follows a descending channel breakdown, but the hold above key EMAs suggests building momentum for a potential impulse wave higher. Current price: $4,328.5, with VWAP at $4,300 providing intraday support.
Key indicators:
- **RSI (14-day):** Hovering at 48, neutral but nearing oversold territory— a dip below 40 could signal a strong bounce. 📈
- **MACD:** Histogram in negative territory, but the signal line crossover is imminent, hinting at bullish divergence if volume confirms. ⚠️
- **Moving Averages:** Price above the 21-day EMA ($4,280) but testing the 50-day SMA ($4,350)—a sustained hold here avoids short-term bearish pressure.
Support/Resistance: Firm support at $4,320 (recent low and 200-day EMA), with major resistance at $4,500 (August high). Patterns/Momentum: The triangle apex nears; a bullish breakout above $4,500 could target $4,800–$4,952, while failure risks a retest of $4,200. 🟢 Bullish signals: Accumulation on hourly charts. 🔴 Bearish risks: Death cross if 50-day SMA flips below 200-day.
Scenarios and Risk Management
- **Bullish Scenario:** A clean break above $4,500 on ETF inflow news or positive macro data (e.g., softer PCE) targets $4,800 initially, then $5,000–$9,000 by Q4. Buy on pullbacks to $4,320 support for optimal entry.
- **Bearish Scenario:** Drop below $4,320 eyes $4,200 (psychological level); a full death cross could accelerate to $3,800. Avoid longs if Bitcoin slips under $60K.
- **Neutral/Goldilocks:** Range-bound $4,200–$4,500 if data remains mixed, ideal for scalping or options plays.
Risk Tips: Set stops 2–3% below support ($4,200) to cap losses. Risk no more than 1–2% of portfolio per trade. Diversify with BTC or stablecoins to hedge crypto correlations—avoid overexposure in this volatile September.
Conclusion/Outlook
Overall, a bullish bias emerges if ETH reclaims $4,500 and ETF flows reverse, positioning it as an undervalued play with 100%+ upside potential into 2025 amid institutional rotation.
But watch today's crypto volatility and upcoming Fed signals for confirmation—this fits the classic September Effect of weakness before Q4 rallies. What's your take? Bullish on ETH's rebound or sitting out the slump? Share in the comments!
Lululemon: Beaten-Down Athleisure GiantLululemon: Beaten-Down Athleisure Giant Amid #Earnings and #Stocks Trends Crash? $250 Recovery Target in Sight?
Lululemon (LULU) shares tanked 19% today to around $160 after Q2 2025 earnings missed estimates, with revenue at $2.4B (up 7% YoY but below $2.44B expected) and EPS dipping to $2.68 from $2.89 last year, prompting a slashed full-year outlook amid China slowdowns.
This extends a brutal 57% YTD plunge from $420 highs, but with a P/E now at 12x versus historical 30x averages, analysts are calling it a "screaming buy" at 40% below fair value.
Just as #Earnings racks up 8K mentions on X with post-report volatility exploding, and #Stocks trends highlight beaten-down consumer plays (e.g., LULU's RSI at 33 signaling oversold), the stock's premium brand and 15% international growth position it for a viral rebound in the $200B+ athleisure market.
But with guidance cuts, is LULU the undervalued turnaround story ready to warrior-pose back to $250, or will competition erode margins further? Let's unpack the fundamentals, SWOT, charts, and setups for September 17, 2025.
Fundamental Analysis
Lululemon's resilience shines in steady sales despite macro headwinds, with Q2 gross margins holding at 58% and international revenue surging 15%—but US softness and China inventory issues led to the outlook trim to $11.15–$11.3B for FY2025 (up 6–7% YoY from $10.7B).
Analysts forecast 2025 EPS of $14.50 (up 10% YoY), with buy ratings from 25 of 30 firms hiking targets to $250 amid #Earnings fallout creating a value entry. Trading at 40% below DCF fair value, LULU's undervaluation ties into #Stocks hype on oversold retail, but elevated inventory risks could pressure if consumer spending cools.
- **Positive:**
- Brand moat with 20%+ market share in premium yoga; $1.2B FCF TTM funds $6B buybacks, amplified by #Earnings dips as buy signals.
- International expansion (35% of sales) projects 12% CAGR, undervaluing the stock at 12x P/E vs. peers' 25x amid #Stocks rotation.
- Broader trends in wellness and athleisure (e.g., viral TikTok fitness) position LULU for 15% revenue growth rebound.
- **Negative:**
- Guidance cut reflects China woes (sales down 2%), clashing with #Earnings optimism if tariffs hit.
- Inventory pile-up at $1.5B risks markdowns, pressuring margins in a high-inflation environment.
SWOT Analysis
**Strengths:** Iconic brand loyalty and direct-to-consumer model (40% of sales) with 58% margins, amplified by #Earnings oversold bounce potential.
**Weaknesses:** US market saturation and China dependency (20% revenue); recent earnings miss exposes execution risks in #Stocks volatility.
**Opportunities:** Global store openings (50+ planned) tap #business trends; undervalued at 12x P/E amid 10% EPS growth and athleisure boom on social media.
**Threats:** Rivals like Nike/Lululemon eroding share; economic slowdown crimping discretionary spend during viral #Earnings discussions.
Technical Analysis
On the daily chart, LULU shows a sharp V-bottom after the 19% gap-down, bouncing from $155 support in a multi-month downtrend, with volume spiking on post-earnings panic and mirroring #Earnings volatility. The monthly RSI at 33 screams oversold, echoing 2009/2014 bounces. Current price: $160, with VWAP at $165 as intraday pivot.
Key indicators:
- **RSI (14-day):** At 25, deeply oversold—classic bounce setup amid #Stocks surges. 📈
- **MACD:** Histogram flipping positive post-selloff, crossover imminent for reversal. ⚠️
- **Moving Averages:** Price below 21-day EMA ($180) but above 200-day SMA ($220)—death cross avoided.
Support/Resistance: Key support at $155 (today's low), resistance at $170 (50-day SMA) and $200 (Fib retrace). Patterns/Momentum: Oversold hammer candle targets $190; fueled by #Earnings momentum. 🟢 Bullish signals: Volume exhaustion low. 🔴 Bearish risks: Break below $155 eyes $140 on further guidance fears.
Scenarios and Risk Management
- **Bullish Scenario:** Reclaim $170 on retail rotation or soft CPI data targets $200 short-term, then $250 by year-end; buy pullbacks to $155, especially if #Earnings narrative shifts to value.
- **Bearish Scenario:** Drop below $155 eyes $140 (52-week low); watch for inventory news amid #Stocks fade triggering 10% more downside.
- **Neutral/Goldilocks:** Range-bound $155–$170 if data mixed and #Earnings cools, suiting covered calls pre-holidays.
Risk Tips: Use stops at $152. Risk 1-2% per trade. Diversify to avoid correlation traps with #Earnings-linked retail like NKE.
Conclusion/Outlook
Overall, a bullish bias if LULU holds $155, supercharged by today's #Earnings and #Stocks trends, affirming its undervalued status with 50%+ upside on international rebound. But watch Q3 comps and China updates for confirmation—this fits September's value rotation amid beaten-down consumer hype. What’s your take? Warrior pose into LULU dip or sitting out the volatility? Share in the comments!

Naspers: Tencent AI Proxy Amid #AI and South Africa BondsNaspers: Undervalued Tencent AI Proxy Amid #AI and South Africa Bond Stability Trends? $80 Target in Sight?
Naspers (NPSNY) ADRs are trading at $67.69 today, up 0.5% amid positive South African market sentiment following the Treasury's smooth $2 billion Eurobond redemption and hints at new issuances to replenish reserves. This fiscal resilience has spurred foreign inflows into SA bonds, with R24.8 billion net buys recently, boosting local equities like Naspers—which has rallied 34% YTD on Tencent's AI-driven rebound.
As #AI trends explode with 17K mentions on X (fueled by AI video generators and drug discovery hype), and #technology buzz hits 46K amid global chip and ad innovations, Naspers' indirect 24% stake in Tencent (via Prosus) positions it as an undervalued gateway to Chinese AI growth in gaming and cloud. But with a forward P/E of 15x, is NPSNY the discounted multi-bagger ready for a push to $80, or will China risks weigh it down? Let's dissect the fundamentals, SWOT, technicals, and setups for September 17, 2025.
Fundamental Analysis
Naspers' value is deeply tied to its Prosus subsidiary, which holds a 24.3% stake in Tencent—valued at ~$120B against Naspers' $52B market cap, implying a 50%+ discount on sum-of-parts analysis. FY2025 results showed 21% Ecommerce revenue growth to $7B and an 18x EBIT improvement, with analysts forecasting 2025 EPS of $4.50 (up 25% YoY) amid Tencent's AI tools launch. With #AI going viral, Naspers' exposure to Tencent's programming AI and cloud positions it perfectly, undervalued at 18% below fair value per DCF amid SA's bond stability signaling economic strength. However, regulatory risks in China loom if crackdowns intensify.
- **Positive:**
- Tencent stake undervalues Naspers by 50%+; $12.8B buybacks enhance shareholder value amid #technology hype and AI investments.
- SA Eurobond redemption boosts foreign inflows (R41.3B YTD), supporting JSE rally and Naspers' 135% 3-year returns.
- Broader #AI trends (e.g., Tencent's AI tool launch) project 20%+ CAGR for holdings.
- **Negative:**
- China exposure risks from geopolitics, clashing with #AI optimism if Tencent growth slows.
- Upcoming 5-for-1 split (Oct 6) could add volatility if retail hype fades post-event.
SWOT Analysis
**Strengths:** Massive discount to Tencent holdings (50%+), amplified by #AI relevance in gaming/cloud; strong Ecommerce profitability with 18x EBIT jump.
**Weaknesses:** Heavy reliance on China assets (80%+ value); cyclical Ecommerce exposure in a #technology-shifting market.
**Opportunities:** SA bond stability attracts inflows, unlocking value; #AI boom via Tencent could narrow discount to 30%, undervalued at 15x P/E amid 25% EPS growth.
**Threats:** Regulatory changes in China eroding Tencent value; intense competition from global tech amid viral #AI discussions on X.
Technical Analysis
On the daily chart, NPSNY is in a strong uptrend, forming a bull flag after breaking $65 resistance, with volume spiking on SA bond news and mirroring #AI volatility surges. The weekly confirms higher highs from 2023 lows, now accelerating. Current price: $67.69, with VWAP at $67 as intraday pivot.
Key indicators:
- **RSI (14-day):** At 65, bullish territory—room for upside amid #technology surges. 📈
- **MACD:** Positive crossover with expanding histogram, indicating momentum build. ⚠️
- **Moving Averages:** Price above 21-day EMA ($64) and 50-day SMA ($62), golden cross intact.
Support/Resistance: Key support at $65 (recent breakout), resistance at $70 (psychological) and $80 (analyst target). Patterns/Momentum: Flag breakout targets $75; fueled by #AI momentum. 🟢 Bullish signals: Volume on inflows. 🔴 Bearish risks: Overextension if China news hits.
Scenarios and Risk Management
- **Bullish Scenario:** Break above $70 on Tencent AI updates or SA inflows targets $75 short-term, then $80 by year-end; buy pullbacks to $65, especially if #AI goes mainstream.
- **Bearish Scenario:** Drop below $65 eyes $60 (200-day EMA); watch for regulatory cross amid #technology fade.
- **Neutral/Goldilocks:** Range-bound $65–$70 if data mixed and #AI cools.
Risk Tips: Use stops at $64. Risk 1-2% per trade. Diversify to avoid correlation traps with #AI-linked assets like TCEHY.
Conclusion/Outlook
Overall, a bullish bias if NPSNY holds $65, supercharged by today's #AI and #technology trends plus SA's Eurobond stability, affirming its undervalued status with 18%+ upside on Tencent AI plays. But watch Q3 earnings and China policy for confirmation—this fits September's emerging market rotation amid viral tech hype. What’s your take? Bullish on Naspers amid #AI Tencent trends? Share in the comments!

Eli Lilly: Weight-Loss Giant Amid AI Drug Discovery Eli Lilly: Undervalued Weight-Loss Giant Amid AI Drug Discovery and Virginia Jobs Boom Trends? $1050 Target in Sight?
Eli Lilly (LLY) shares are trading at $755.39 today, up 0.45% amid analyst upgrades and fresh headlines on its $2.3 billion Virginia manufacturing plant expansion, creating 650 high-paying jobs in Goochland County.
This comes as Q2 2025 earnings showcased 36% revenue growth to $11.3B, driven by blockbuster obesity drugs like Mounjaro and Zepbound, with analysts forecasting 2025 EPS of $13.14—up 20% YoY.
Just as #AI and #technology explode on X with 17K+ mentions today (fueled by AI video generators and drug discovery hype), and #business trends spotlight corporate expansions like Eli Lilly's Virginia move, LLY's AI-powered R&D pipeline positions it for viral growth in the $100B+ weight-loss market.
But with a forward P/E of 28x, is LLY the undervalued pharma powerhouse ready for a rally to $1050, or will patent cliffs and competition temper the upside? Let's break down the fundamentals, SWOT, charts, and setups for September 17, 2025.
Fundamental Analysis
Eli Lilly's momentum is anchored in its GLP-1 dominance and innovative pipeline, with the Virginia plant bolstering U.S. production amid supply constraints for weight-loss drugs. Analysts expect 2025 revenue of $47.3B (up 18% YoY), powered by approvals for oral obesity pills and oncology breakthroughs like Verzenio.
With #AI trends surging on X, LLY's use of machine learning in drug design (e.g., accelerating lung cancer therapies) undervalues its tech edge, trading 18% below fair value per DCF models. However, regulatory hurdles for new GLP-1s could delay peaks if biosimilar competition ramps up.
- **Positive:**
- Virginia plant announcement drives job creation buzz, aligning with #business trends and signaling supply chain resilience for 20%+ EPS growth.
- Q2 beat with $2.9B in Mounjaro sales; AI integrations in R&D tie into today's #AI hype, projecting $100B+ peak sales for obesity franchise.
- Broader trends in personalized medicine and #technology (19K mentions) position LLY for 15% annual revenue CAGR amid global demand.
- **Negative:**
- Patent expirations on key drugs like Humalog loom by 2026, clashing with #AI optimism if innovation lags.
- High R&D spend ($10B+ annually) pressures margins if trial delays hit, especially in a sticky inflation environment.
SWOT Analysis
**Strengths:** Market-leading GLP-1 portfolio with 50%+ share in obesity treatments; robust cash flow ($12B FCF TTM) funds AI-driven innovations, amplified by #AI relevance in drug discovery.
**Weaknesses:** Premium valuation at 28x forward P/E amid growth dependency; supply bottlenecks exposed by demand surges, vulnerable in #technology-shifting markets.
**Opportunities:** Virginia expansion for 650 jobs taps #business trends; AI for faster trials unlocks $50B+ in new therapies, undervalued at 18% below fair value amid #AI boom.
**Threats:** Biosimilar erosion from Novo Nordisk rivals; regulatory scrutiny on weight-loss ads during viral #technology discussions on social media.
Technical Analysis
On the daily chart, LLY is in a bullish uptrend, coiling in an ascending channel after bouncing from $740 support, with volume rising on plant news and mirroring #AI volatility spikes. The weekly confirms a multi-year bull flag from 2023 lows, now extending higher. Current price: $755.39, with VWAP at $752 as intraday pivot.
Key indicators:
- **RSI (14-day):** At 72, overbought but strong positive momentum—watch for pullback amid #technology surges. 📈
- **MACD:** Bullish crossover with expanding histogram, signaling acceleration; no divergence yet. ⚠️
- **Moving Averages:** Price above 21-day EMA ($745) and 50-day SMA ($730), golden cross intact for medium-term bull.
Support/Resistance: Key support at $740 (recent low and 50-day SMA), resistance at $770 (September high) and $800 (analyst target). Patterns/Momentum: Channel breakout targets $850; strong buy signals. 🟢 Bullish signals: Volume on #business news. 🔴 Bearish risks: RSI overbought could retrace 5% on profit-taking.
Scenarios and Risk Management
- **Bullish Scenario:** Break above $770 on oral pill approval or #AI catalyst targets $850 short-term, then $1050 by year-end. Buy dips to $740 for entries tied to Virginia jobs hype.
- **Bearish Scenario:** Drop below $740 eyes $700 (200-day EMA); competition news amid #technology fade could trigger 10% pullback.
- **Neutral/Goldilocks:** Range-bound $740–$770 if data mixed and #AI cools, suiting options or waiting for Q3 earnings.
Risk Tips: Use stops 2% below support ($725) to manage volatility. Risk 1-2% per trade. Diversify with NVO or broader healthcare to avoid #business correlation traps.
Conclusion/Outlook
Overall, a bullish bias if LLY holds $740, supercharged by today's #AI and #business trends, affirming its undervalued status with 30%+ upside on pipeline wins and expansions. But watch FDA updates and Q3 guidance for confirmation—this fits September's healthcare rotation amid viral tech hype. What’s your take? Bullish on LLY amid #AI drug trends or waiting for a dip? Share in the comments!

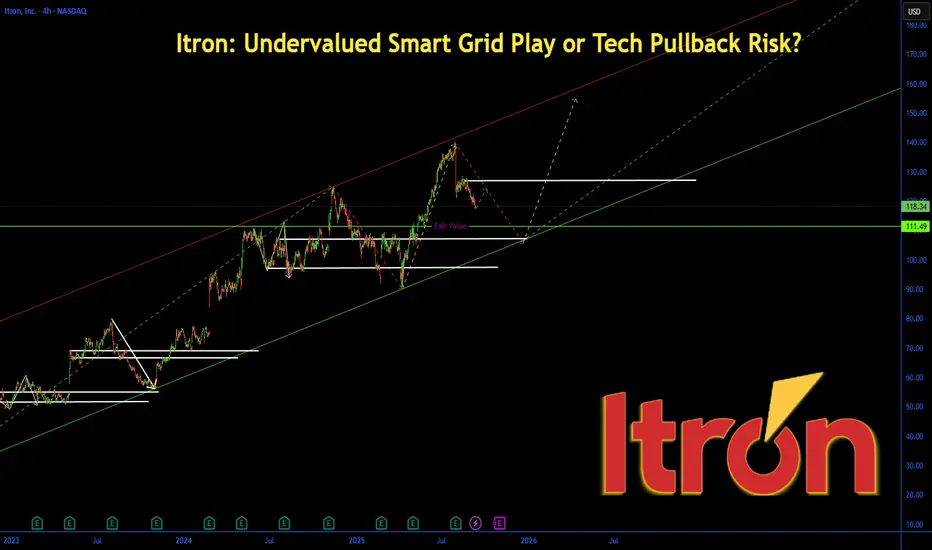
Itron: Undervalued Smart Grid Play or Tech Pullback Risk? Itron: Undervalued Smart Grid Play or Tech Pullback Risk? $144 Target in Play?
Itron (ITRI) shares are trading at $118.29 today, down 0.40% from yesterday's close but up 2.5% over the past week amid broader market gains following S&P 500 and Nasdaq record highs. As a leader in smart metering and utility analytics, Itron reported record Q2 2025 profitability and raised its full-year earnings guidance, even as revenue expectations were trimmed slightly due to supply chain hiccups.
With analysts pegging a $144.40 one-year target—implying 22% upside—and the stock flagged as one of September's top undervalued picks, is ITRI poised for a breakout on IoT and energy transition tailwinds, or will sector rotation and macro jitters weigh it down? Let's dissect the fundamentals, SWOT, technicals, and setups for September 11, 2025.
Fundamental Analysis
Itron's growth is anchored in the booming demand for smart grid solutions, with Q2 2025 delivering EPS of $1.12 (beating estimates) and margins hitting all-time highs at 11.05%. Analysts forecast 2025 EPS of $6.45 on $2.5B revenue, up 10% YoY, fueled by utility digitization and partnerships in renewables. However, softer demand in some segments and persistent supply issues could pressure short-term execution if inflation lingers.
- **Positive:**
- Raised 2025 earnings guidance signals operational strength; strong backlog in smart metering amid global energy upgrades.
- Institutional buying and ETF inflows in industrials highlight undervaluation at 18.35 forward P/E versus sector average of 22x.
- Broader trends like AI-driven grid management and ESG mandates position Itron for 15%+ annual growth.
- **Negative:**
- Revenue trim in guidance reflects supply chain vulnerabilities and delayed projects.
- Economic uncertainties, including potential tariff escalations, could slow utility capex if rate cuts stall.
SWOT Analysis
**Strengths:** Dominant market position in smart metering with a 20%+ share in North America; robust R&D pipeline yielding high-margin IoT innovations and recurring software revenue.
**Weaknesses:** Heavy reliance on cyclical utility spending exposes earnings to economic downturns; elevated debt levels at 0.8x EBITDA limit flexibility amid rising rates.
**Opportunities:** Expansion into emerging markets like Asia-Pacific for grid modernization; integration of advanced analytics and AI for $11.9B global utility market by 2025 end.
**Threats:** Intensifying cybersecurity risks in connected devices; fierce competition from Siemens and Schneider, plus regulatory shifts in energy policies.
Technical Analysis
On the daily chart, ITRI is forming a bullish ascending triangle after rebounding from $115 support, with volume rising on the upside amid the broader tech rally. This follows a 3.68% monthly dip, now stabilizing near key EMAs as September forecasts eye a range of $108–$120. Current price: $118.29, with VWAP at $117.80 offering intraday balance.
Key indicators:
- **RSI (14-day):** At 52, neutral but climbing from oversold—bullish if it sustains above 55. 📈
- **MACD:** Histogram ticking positive with lines converging for a potential crossover, signaling emerging momentum. ⚠️
- **Moving Averages:** Price above the 21-day EMA ($116.50) but testing the 50-day SMA ($119)—a hold here maintains the uptrend.
Support/Resistance: Solid support at $115 (recent low and 200-day EMA), resistance at $120 (September high). Patterns/Momentum: Triangle apex approaching; breakout above $120 targets $130. 🟢 Bullish signals: Higher lows and analyst upgrades. 🔴 Bearish risks: Bearish MA trend could drag to $108 on sector weakness.
Scenarios and Risk Management
- **Bullish Scenario:** Clear $120 on strong earnings momentum or soft CPI data targets $130 short-term, then $144 by year-end. Buy dips to $115 for value entries.
- **Bearish Scenario:** Drop below $115 eyes $108 (monthly low); broader tech correction could trigger 10% pullback.
- **Neutral/Goldilocks:** Range-bound $115–$120 if data mixed, suitable for covered calls or waiting for Q3 catalysts.
Risk Tips: Set stops 2% below support ($112.70) to curb downside. Risk 1-2% of portfolio per trade. Diversify with peers like SEDG or broader industrials to dodge utility-specific traps.
Conclusion/Outlook
Overall, a bullish bias if ITRI holds $115 and guidance beats continue, cementing its undervalued status with 20%+ upside on smart grid demand.
But watch Q3 earnings and Fed minutes for confirmation—this echoes September's value rotation in tech amid record highs. What’s your take? Bullish on Itron's rebound or sidelining for now? Share in the comments!
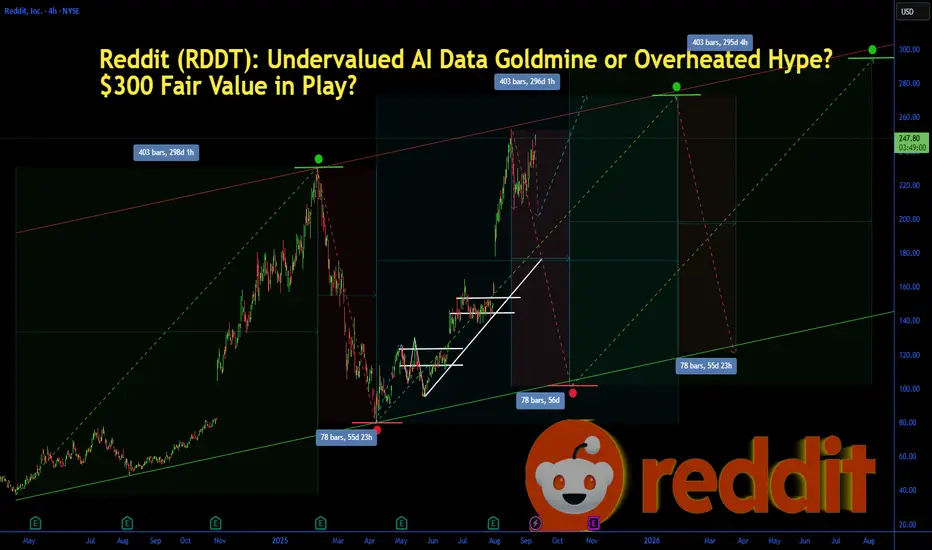
Reddit (RDDT): Undervalued AI Data Goldmine or Overheated Hype?Reddit (RDDT): Undervalued AI Data Goldmine or Overheated Hype? $300 Fair Value in Play?
Reddit (RDDT) shares surged 4.44% to close at $240.20 yesterday, with pre-market trading pushing it to $243.70 today amid optimism over its AI data licensing deals and a 78% YoY revenue jump in recent earnings. Year-to-date, the stock is up 46.97%, but analysts are split—some see it undervalued by 26% with a fair value of $302 based on free cash flow projections, while others flag overvaluation at current levels. With a lawsuit over alleged privacy issues making headlines and Q3 earnings looming on October 28, is RDDT the undervalued growth play in social media's AI era, or just riding short-term momentum? Let's break down the fundamentals, SWOT, technicals, and scenarios for September 10, 2025.
Fundamental Analysis
Reddit's core strength lies in its massive user-generated content, positioning it as a key AI training data source with deals like OpenAI's integration boosting revenue. Recent Q2 results showed $499.6 million in sales, up 78% YoY, surpassing estimates, driven by ad growth and user expansion to over 100 million daily actives.
Analysts expect EPS of $2.23 TTM, with forward P/E at 84.03, reflecting high growth premiums. However, a high PE of 107.71 and enterprise value/EBITDA of 291.25 suggest stretched valuations, compounded by a lawsuit alleging privacy violations.
- **Positive:**
- Surging revenue and user growth underscore AI data monetization potential; profit margin at 12.97% with $2.06B cash on hand.
- Institutional interest rising, with market cap at $44.96B and levered free cash flow of $290.61M signaling operational strength.
- **Negative:**
- High debt/equity at 1.05% and ongoing lawsuit risks could erode investor confidence if macro slowdowns hit ad spending.
- Sticky inflation and Fed rate uncertainty may pressure growth stocks like RDDT if AI hype cools.
SWOT Analysis
Strengths: Dominant in user-generated content for AI datasets; strong revenue growth (78% YoY) and cash reserves ($2.06B); loyal community driving organic traffic.
Weaknesses: Elevated valuations (PE 107.71) amid profitability challenges; history of operational issues like site outages; dependency on ad revenue vulnerable to economic dips.
Opportunities: Expanding AI partnerships (e.g., data licensing deals); global user base growth in emerging markets; potential for new features like premium subscriptions amid digital ad boom.
Threats: Intensifying competition from TikTok and Meta; regulatory scrutiny on data privacy (e.g., ongoing lawsuit); market volatility if Fed delays rate cuts.
Technical Analysis
On the daily chart, RDDT is in a rising trend channel after breaking out from $223 support, with volume spiking on earnings momentum but now consolidating near all-time highs.
This follows a 52-week range from $55.84 to $253.14, with the stock up over 300% from April lows. Current price: ~$243 (pre-market), pivoting around $240.
Key indicators:
RSI: At 68.60, bullish but nearing overbought—watch for pullback if it hits 70.
MACD: At 12.35 with positive histogram, signaling sustained upside momentum.
Moving Averages: Price above 21-day EMA (~$230) and 50-day SMA (~$220)—golden cross intact for bull bias.
Support/Resistance: Support at $223 (recent low), resistance at $253 (all-time high).
Patterns/Momentum: Rising channel targets $260 on breakout; higher highs confirm trend. 🟢 Bullish signals: Strong buy per technical summaries. 🔴 Bearish risks: Overbought RSI could trigger correction.
Scenarios and Risk Management
Bullish Scenario: Break above $253 on positive lawsuit resolution or AI deal news targets $260–$302; buy on pullbacks to $230 support.
Bearish Scenario: Drop below $223 eyes $220 (50-day SMA); watch for death cross if macro data disappoints.
Neutral/Goldilocks: Range-bound $223–$253 if earnings guidance is mixed.
Risk Tips: Use stops at $220 (2% below support). Risk 1-2% per trade. Diversify to avoid tech sector correlations—pair with stable assets like bonds.
Conclusion/Outlook
Overall, bullish bias if RDDT holds $240 and leverages AI tailwinds, affirming its undervalued potential with 25%+ upside to $302 fair value. But watch October earnings and privacy lawsuit for confirmation—this fits September's growth stock rotation amid Fed cut optimism.
What’s your take? Bullish on RDDT's AI edge or bearish on valuations? Share in the comments!
$APA: APA Corporation – Oil’s Wild Ride or Steady Bet?(1/9)
Good afternoon, everyone! ☀️
NASDAQ:APA : APA Corporation – Oil’s Wild Ride or Steady Bet?
With APA at $19.70, is this energy titan a fuel for profit or a risky barrel? Let’s drill down! 🔍
(2/9) – PRICE PERFORMANCE 📊
• Current Price: $ 19.70 as of Mar 17, 2025 💰
• Recent Move: Down from higher levels, reflecting oil price volatility 📏
• Sector Trend: Energy sector volatile amid economic uncertainties 🌟
It’s a rollercoaster—hold tight! ⚙️
(3/9) – MARKET POSITION 📈
• Market Cap: Approx $6.1B (310M shares outstanding) 🏆
• Operations: Oil and gas exploration in key regions like U.S., Egypt ⏰
• Trend: Vulnerable to oil price swings, but diversified operations offer stability 🎯
Firm in its niche, but subject to market winds! 🚀
(4/9) – KEY DEVELOPMENTS 🔑
• Oil Price Dynamics: Recent drops impact revenue and earnings 🌍
• Company Strategies: Focus on cost management and strategic investments 📋
• Market Reaction: Stock price reflects current market sentiments 💡
Navigating through turbulent waters! 💪
(5/9) – RISKS IN FOCUS ⚡
• Oil Price Volatility: Primary driver of performance 🔍
• Regulatory Changes: Environmental regulations and transition to renewables 📉
• Geopolitical Tensions: Impact on supply chains and prices ❄️
It’s a risky venture—stay alert! 🛑
(6/9) – SWOT: STRENGTHS 💪
• Established Presence: Key oil-producing regions like Permian Basin 🥇
• Diversified Portfolio: Operations across multiple geographies 📊
• Financial Stability: Strong balance sheet, per historical data 🔧
Got solid foundations! 🏦
(7/9) – SWOT: WEAKNESSES & OPPORTUNITIES ⚖️
• Weaknesses: Vulnerable to oil price drops, regulatory risks 📉
• Opportunities: Expansion into new markets, M&A activities, potential oil price rebound 📈
Can it weather the storm and shine again? 🤔
(8/9) – POLL TIME! 📢
APA at $19.70—your take? 🗳️
• Bullish: $25+ soon, oil prices rebound 🐂
• Neutral: Steady, risks and opportunities balance out ⚖️
• Bearish: $15 looms, further downturn ahead 🐻
Chime in below! 👇
(9/9) – FINAL TAKEAWAY 🎯
APA’s $19.70 price reflects current market challenges 📈, but its long-term potential remains. DCA-on-dips could be a strategy to average in over time. Gem or bust?

$F: Ford Motor Company – Driving Profits or Stalling Out?(1/9)
Good afternoon, everyone! ☀️ NYSE:F : Ford Motor Company – Driving Profits or Stalling Out?
With F at $10.18, is this auto giant revving up with EVs or sputtering in the market? Let’s shift gears and find out! 🔍
(2/9) – PRICE PERFORMANCE 📊
• Current Price: $ 10.18 as of Mar 18, 2025 💰
• Recent Move: Slight uptick in March, per data 📏
• Sector Trend: Auto sector mixed, EV demand growing 🌟
It’s a road with twists—let’s see where it leads! ⚙️
(3/9) – MARKET POSITION 📈
• Market Cap: Approx $45B (4.4B shares) 🏆
• Operations: Global auto manufacturer, focusing on EVs ⏰
• Trend: EV push with F-150 Lightning, per data 🎯
Firm in its lane, with electric acceleration! 🚗
(4/9) – KEY DEVELOPMENTS 🔑
• Q1 2025 Earnings: Expected soon, EV sales in focus 🌍
• EV Sales: F-150 Lightning gaining traction, per data 📋
• Market Reaction: Stock reflects cautious optimism 💡
Shifting to electric, eyes on the horizon! ⚡
(5/9) – RISKS IN FOCUS ⚡
• Economic Slowdown: Impact on auto sales 📉
• Competition: Tesla, GM, VW in EV race ❄️
• Supply Chain: Geopolitical tensions affecting parts 🛑
It’s a competitive race—buckle up! 🚦
(6/9) – SWOT: STRENGTHS 💪
• Brand Power: Iconic auto brand 🥇
• EV Strategy: F-150 Lightning leading the charge 📊
• Undervalued: Low P/E ratio, strong cash flow 🔧
Got the engine to roar! 🏁
(7/9) – SWOT: WEAKNESSES & OPPORTUNITIES ⚖️
• Weaknesses: Traditional auto sales vulnerable to economic shifts 📉
• Opportunities: Growing EV market, new models 📈
Can it charge ahead or run out of juice? 🤔
(8/9) – POLL TIME! 📢
F at $10.18—your take? 🗳️
• Bullish: $12+ soon, EV boom drives growth 🐂
• Neutral: Steady, risks balance out ⚖️
• Bearish: $9 looms, market stalls 🐻
Chime in below! 👇
(9/9) – FINAL TAKEAWAY 🎯
F’s $10.18 price tags potential value 📈, but volatility’s in the air 🌿. Dips are our DCA fuel 💰—buy low, ride high! Gem or bust?

SoFi's Surge: Unveiling 2023 and What Lies Ahead in 2024Technical Analysis Overview
Current Price : $10.34, a 3.77% increase.
Weekly Trend : Showing a positive trend with a 5.35% increase over the last five days.
1-Month Trend : A significant increase of 51.96%, indicating strong bullish sentiment.
6-Month and Yearly Trends : A 17.04% increase over the last six months and a 124.51% increase year to date, highlighting a robust bullish trend.
Advanced Technical Indicators
Relative Strength Index (RSI) : 70.41 - Indicating that SOFI is nearing overbought territory, which could lead to a potential reversal or consolidation in the short term.
Moving Average Convergence Divergence (MACD) : 0.63 - Suggesting bullish momentum, indicating a strong buying trend.
Other Indicators : STOCH (83.28), STOCHRSI (84.02), ADX (37.09), Williams %R (-8.57), CCI (104.63), ATR (0.46), Ultimate Oscillator (54.76), and ROC (24.66) all contribute to a picture of current bullish momentum but with potential for short-term volatility or pullback.
Market Sentiment and External Factors
Market Capitalization : $9.904B USD.
Trading Volume Analysis : A high trading volume of 35,199,288, suggesting active market participation and interest in the stock.
Recent News Coverage Impacting SOFI
Bullish Outlook for 2024 : Analysts predict SOFI stock could continue its rally in the new year, benefiting from expected interest-rate cuts. A notable analyst has set a high price target of $14 for SOFI stock, implying significant upside potential ( InvestorPlace ).
Focus on Non-Lending Businesses : Analysts appreciate SoFi's shift towards non-lending businesses, improving earnings quality despite a higher-for-longer interest-rate policy.
Central Bank Policy Changes : Potential interest rate cuts in 2024 could benefit SoFi's lending business, as lower rates tend to spur borrowing and lending activity.
Conclusion
SOFI's stock shows strong bullish signs in the medium to long term, but the current overbought condition warrants caution for short-term traders.
The recent news and analyst predictions provide a positive outlook for 2024, making SOFI an interesting stock for both traders and long-term investors.

UNH bear flag and gapsUNH has been top of my radar for a bullish reversal. With 2 major gaps to fill after the epic collapse in share price this ticker has a lot of potential. Currently sitting in what appears to be a bear flag, it is holding above the monthly 200EMA (overlayed on this 4H chart). However price recently rejected off the daily 21ema (overlayed on this 4H chart) and if the bear flag is any indicator price may head lower for another liquidity sweep before the inevitable bullish reversal.
A side note: insiders have been buying $millions since the share price collapsed which is always a good indicator of what's to come.
