UPSNYSE:UPS : Recovery Potential and Strategic Pivot in 2026
1. Strategic Shift: Quality Over Quantity
De-risking Amazon Exposure: UPS is intentionally reducing low-margin volumes from Amazon (projected 50% reduction from early 2025 through mid-2026).
High-Margin Focus: Capital is being reallocated toward more profitable segments, specifically Small and Medium Businesses (SMBs) and Healthcare/Medical Supplies, where specialized logistics command premium pricing.
2. Operational Transformation: "Efficiency Reimagined"
Cost Management: The large-scale program aims for $3.5 billion in annual savings by closing 73 older facilities and consolidating operations.
Automation & Robotics: As part of a $9 billion long-term strategy, UPS is deploying 400 Pickle Robot Co. units for truck unloading. AI-driven sorting centers are already expanding operating margins.
Recent Performance: In Q3 2025, U.S. operating margins improved to 10% (up from 7.7% YoY), while revenue per piece grew by 9.8%, proving the "better, not bigger" strategy is working.
3. The Dividend Challenge & FCF Recovery
🔎
UPS

United Postal Service | UPS | Long at $92.00The United Postal Service NYSE:UPS finally closed out the last remaining price gap on the daily chart (since 2020) and entered my "crash" simple moving average zone. With a P/E of 15x, earnings forecast growth of 8.12% per year, and a dividend over 6%, NYSE:UPS "may" be a good buy and hold through these tumultuous economic/trade war times. I wouldn't place a continued price drop near $75-$85 out of the question, but I'm not in the game of calling bottoms.
At $92.00, NYSE:UPS is in a personal buy zone. Word of caution: if this stock really tanks due to trade issues and massive recession, $50s...
Targets:
$108.00
$120.00
$133.00

UPS – Weekly Structure | Wave 3 Breakout in ProgressThesis
NYSE:UPS is breaking out from a multi-month consolidation and transitioning into an impulsive Wave 3 structure, supported by improving price action and strong income characteristics.
Context
- Weekly timeframe
- Prolonged corrective phase followed by tightening consolidation
- Price has recently reclaimed key moving averages
- Dividend yield remains elevated, supporting longer-term positioning
What I see
- Price has broken above the 50-week moving average
- Psychological resistance at the $100 level has been cleared
- The upper boundary of the descending wedge has been breached
- Structure is consistent with the early stages of a Wave 3 advance
What matters now
- Holding above the $100 breakout zone is key to maintaining bullish structure
- Follow-through should remain controlled rather than impulsive, consistent with NYSE:UPS historical behavior
- Failure to hold the breakout would likely result in consolidation rather than trend failure
Buy / Accumulation zone
- Retests of the breakout area above $100 remain the primary zone of interest
- Risk is defined against the former wedge resistance
Targets
- Wave 3 reference aligns with the 1.618 Fibonacci extension near the $120 area
- Longer-term structure remains capped by the 200-week moving average overhead
Risk / Invalidation
- A sustained move back below the $100 level would weaken the breakout thesis

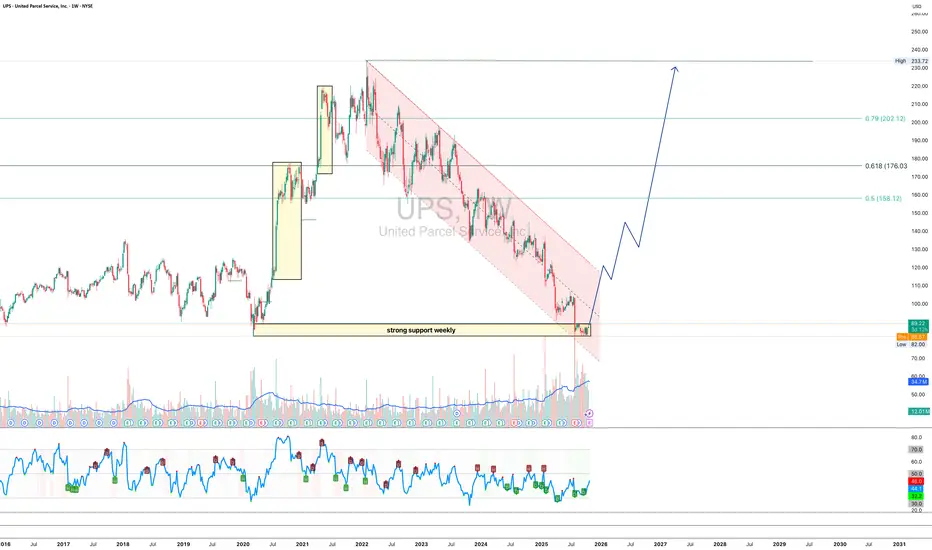
UPS 1W - delivery of a trend reversal is on the way?On the weekly chart, UPS is holding strong around the $82–90 support zone - a key level where buyers historically step in. The structure suggests the end of the long corrective channel and the potential start of a bullish reversal.
Technically, a confirmed breakout above the channel could trigger momentum toward $158, $176, and $202 - attractive targets for mid-term traders.
From a fundamental standpoint, UPS continues to streamline operations, improve automation, and prepare for peak season shipping. Growing e-commerce volumes and steady fuel costs may support stronger margins ahead. If earnings start to reflect these improvements, the stock could easily shift gears into a sustainable uptrend.
* UPS announced that it will report its Q3 results on October 28, 2025.
* The company is introducing increased seasonal charges and shipping rates starting October 26 ahead of the holiday season, which may temporarily reduce demand.
* UPS also announced plans to equip 5,000 of its trucks with air conditioning in the hottest regions of the US, a step to improve working conditions but at a cost.
* The high dividend yield (~7.5%) raises questions about sustainability, as the payout is almost equal to free cash flow.
Tactical play: as long as $82–90 holds, bulls have the initiative. Once the breakout is confirmed - the next big delivery might just be profits.
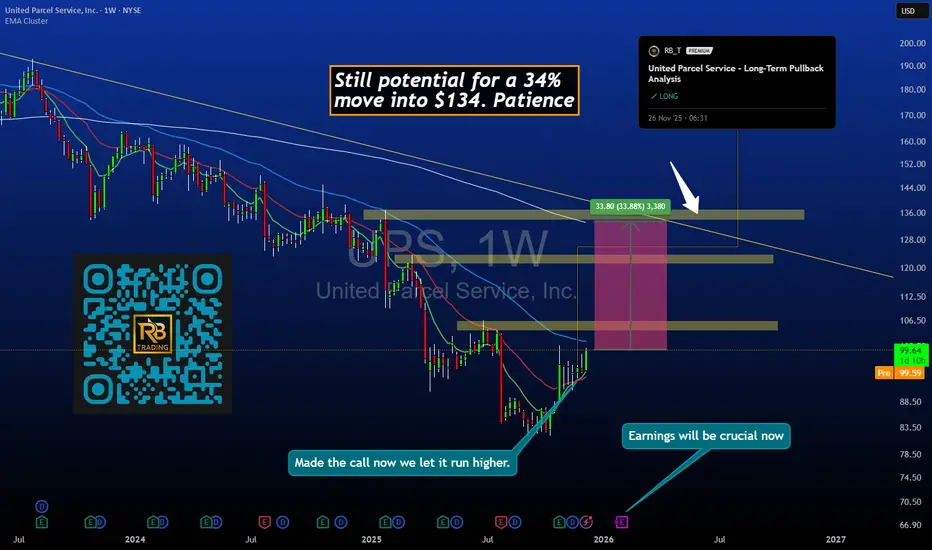
UPS Trade Update ~ +4.2% Since Entry ~ $134 Target IntactOverview
Our November 26 entry on UPS at $95 is performing as expected. Price is now trading near $99 for a gain of +4.2%. More importantly, the structural road map targeting $134 remains fully valid. The move so far represents the early phase of a multi-month recovery, not the completion of the idea.
Original Setup
• Entry: $95
• Stop: $88
• Target: $134
• Time-frame: 3 to 6 months
• Structure: Deep pullback into major demand with multiple confluences including Fibonacci support, high-volume accumulation, and technical exhaustion
• Thesis: Sentiment-driven decline into value created an asymmetric long opportunity
Current Price Action
Since entry, UPS has:
• Respected the $95 demand zone
• Formed higher lows on the daily chart
• Shown early accumulation
• Transitioned momentum from oversold to neutral and improving
The bounce into $99 confirms early strength and aligns with the expected path toward the $110-115 intermediate region.
Why $134 Still Stands
The $134 objective is anchored by:
• Prior structural resistance
• Fibonacci extension alignment
• A clean volume gap between $105 and $134
• Historical acceptance at higher prices
From current levels, the remaining upside is still substantial. This is where the bulk of the idea plays out.
Technical Structure
Daily:
• Higher lows forming
• Price reclaimed 20-day moving average
• Increasing volume on advances
• Momentum indicators recovering
Weekly:
• Major support at $95 held cleanly
• Downtrend break developing
• Structure suggests the corrective phase is ending
Key zones:
• Support: $95-97
• First resistance: $103-105
• Mid-target: $115-118
• Final target: $134
Position Management
For entries at $95:
• Hold the core position as the structure remains fully intact
• Consider scaling at $115-118, then $125-128, then final exits near $134
• Keep the stop at $88 until price clears $105, then break-even becomes optional
• Use weekly swing lows to guide any trailing approach
The goal is to let the multi-month structure play out rather than taking quick profits early.
Psychology Note
Many traders exit too soon because small gains feel rewarding. The entry at $95 required conviction. The hold toward $134 requires patience. Small early moves are confirmation, not completion.
Timeline Outlook
• Weeks 1-2: Early bounce (completed)
• Months 1-2: Move toward 110-115 zone
• Months 3-4: Consolidation and mid-target testing
• Months 4-6: Attempt toward $134
The current action fits this road-map perfectly.
Risk Factors
• A weekly close below $88 invalidates the long thesis
• Broad market weakness could slow progress
• Company-specific events or earnings surprises may affect trajectory
Key Takeaway
UPS is behaving exactly as the original thesis anticipated. +4.2% is early confirmation with far more potential remaining. As long as structure remains intact, the $134 target continues to be the primary objective.
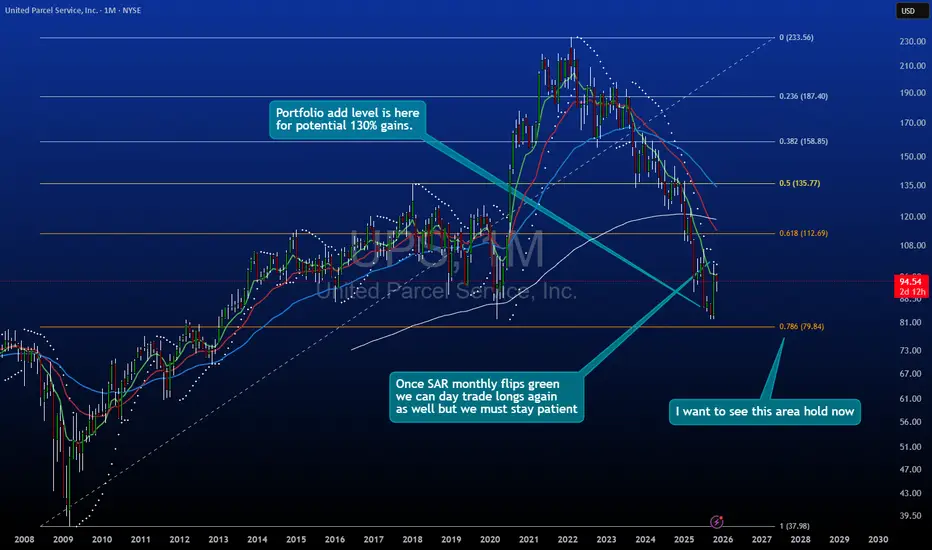
United Parcel Service - Long-Term Pullback AnalysisUPS has retraced approximately 65% from its 2022 highs, presenting a potential accumulation zone based on historical price structure and key retracement levels.
Technical Observations:
Price Structure:
Current price: $94.54
Trading near the 0.618 retracement level ($112.69) from the 2020 low to 2022 high
Approaching the 0.786 retracement zone ($79.84), which historically acted as strong support
Key Levels:
Monthly support zone: $78.60 area
Long-term trend line from 2008 lows remains intact
Price action showing signs of stabilization after extended decline
Risk Considerations:
Entry zone: Current levels to $79 area
Invalidation: Break below $70 would negate bullish thesis
Timeframe: Long-term position (12-24+ months)
Potential Upside Targets:
Based on historical swing analysis and fibonacci projections:
First resistance: $135-140 zone (0.5 retracement)
Second target: $158-165 zone (0.382 retracement)
Full recovery: $187-200+ zone (previous highs)
Fundamental Context:
UPS benefits from structural trends in e-commerce and logistics. Current valuation appears compressed relative to historical norms, though macroeconomic headwinds remain a factor.
Position Sizing:
Given the long-term nature and inherent volatility, this would be considered a tier 1 allocation in a diversified portfolio with appropriate risk management.
This is not financial advice. All investments carry risk. Past price action does not guarantee future results. Conduct your own due diligence before making investment decisions.
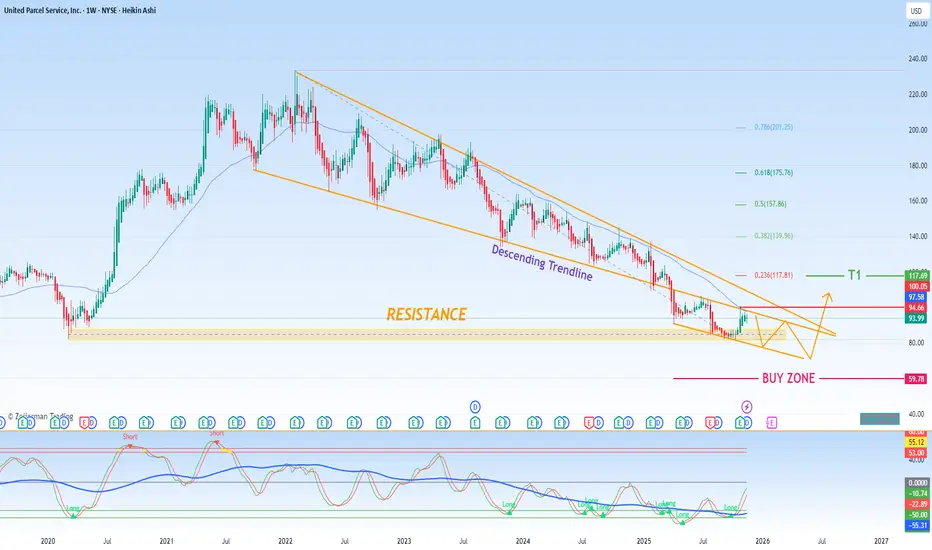
Technical Analysis Report: $UPS (United Parcel Service)1. Historical Price Context & Trend Identification
The long-term chart for NYSE:UPS reveals a significant period of depreciation that initiated around Monday, October 4th, 2021. This established a clear and persistent downtrend. However, a critical technical development occurred on Monday, March 31st, 2025, when the price action conclusively broke above the primary descending trendline that had governed the stock's movement for over three years. This breakout is a technically significant event, as it suggests a potential exhaustion of the prior bearish momentum and a shift in market structure. While not a guarantee, this breach of a long-standing resistance line opens the possibility for a new, bullish phase to begin.
2. Key Technical Levels & Trading Strategy
Based on the current chart structure, we can identify several critical price levels that will be pivotal for determining the next major move.
Immediate Resistance: $80.00
This is the most critical short-term hurdle. A confirmed and sustained breakout above the $80.00 level, preferably on high volume, would serve as the strongest confirmation yet that the new bullish trend has validity. It would signal that buyer conviction is strong enough to overcome a key area of previous selling pressure.
Projection & Buy Zone: $60.00 - $70.00
It is important to manage expectations following a breakout. A common market behaviour is for the price to retrace back towards the newly established support level (the former descending trendline, now acting as support). This retracement offers a more optimal and lower-risk entry point. Therefore, our primary accumulation or buy zone is identified between $60.00 and $70.00. A pullback into this zone would be viewed as a healthy consolidation within the nascent bullish structure, providing a favourable risk-to-reward setup.
The "Red Line" Support: ~$100.00 (Re-evaluation Required)
Your mention of a "red line" at $100.00 is noted. Given the current price context (with the stock trading below $80), a move to $100 would actually represent a significant rally from current levels. Therefore, this level would likely act as a secondary profit-taking target or a resistance zone on the way up, rather than a buy zone. A more logical interpretation of a key support level to "buy" would be the newly formed ascending trendline or a significant moving average that aligns with the $60-$70 zone.
3. Profit-Taking Target
Upon a successful entry in the $60-$70 buy zone, with a confirmed hold of support, the initial medium-term profit-taking target is projected at the $120.00 level. This objective is based on measuring the potential impulse wave following the breakout from the long-term downtrend and aligns with a prior area of significant price history.
Summary & Outlook
In conclusion, the breakout on March 31st, 2025, is a constructive development for $UPS. The trading plan is as follows:
Wait for a pullback into the $60.00 - $70.00 zone for an optimal long entry.
Use a stop-loss below this zone (e.g., below $58.00) to manage risk in case the breakout fails.
Watch for a decisive break above $80.00 as confirmation of strengthening bullish momentum.
Take profits in stages as the price approaches the $120.00 target.
UPS I Potential long opportunity Welcome back! Let me know your thoughts in the comments!
** UPS Analysis - Listen to video!
We recommend that you keep this on your watch list and enter when the entry criteria of your strategy is met.
Please support this idea with a LIKE and COMMENT if you find it useful and Click "Follow" on our profile if you'd like these trade ideas delivered straight to your email in the future.
Thanks for your continued support!

UPS Breakout & Retest – Long Spot OpportunityNYSE:UPS has broken above the key $90 resistance level, indicating a potential shift in trend. This level may now act as support, offering a textbook retest setup. We’re watching closely for a pullback to confirm $88.00–$90.00 as a buy zone for a possible long entry.
🎯 Entry Zone: $88.00–$90.00
📈 Targets:
• TP1: $103.00–$111.00
• TP2: $122.00–$138.00
🔻 Stop Loss: Below $85.00
If price holds the $90 zone with bullish confirmation (volume, wick rejections, etc.), this could be a strong continuation setup. As always, risk management is key – keep an eye on broader market sentiment and earnings-related moves.

UPS Swing Long 1H Conservative Trend TradeConservative Trend Trade
+ long impulse
- supporting reaction bar
+ support zone
+ 1/2 correction
+ biggest volume Sp
Calculated affordable virtual stop loss
1 to 2 R/R take profit
Daily Trend
+ long impulse
= neutral zone"
Monthly CounterTrend
"+ short impulse
+ biggest volume T1
+ support zone
+ biggest volume manipulation bar
- one bar reversal?"
Yearly trend
"+ long impulse
+ 1/2 correction
+ T2 level
+ support zone
+ biggest volume manipulation bar"

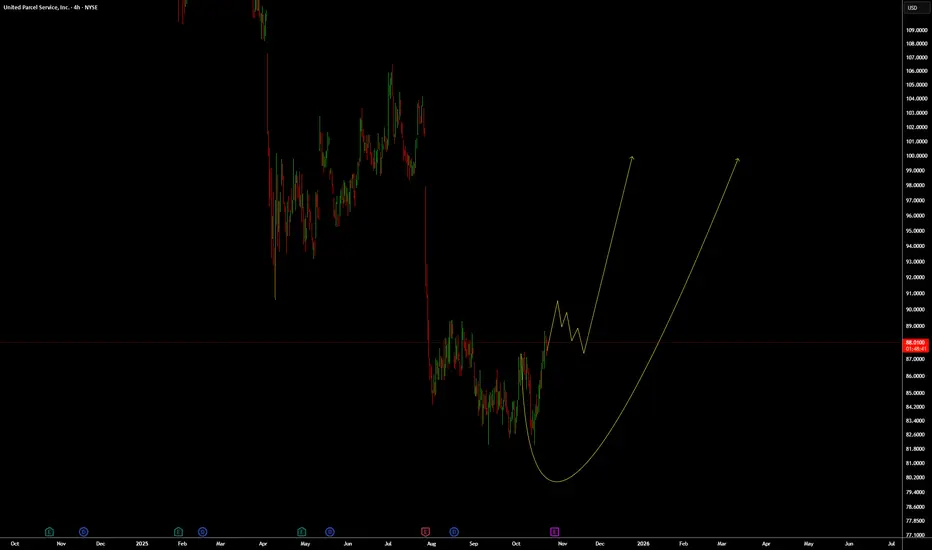
Update for UPS: Should go up to 100 level.This is an updated chart for NYSE:UPS Trade Idea that was posted few days ago.
If you got in the Buy, make sure to manage your trade and lets wait market to go a bit more higher, give us a correction/pullback for another push up towards 100 level.
WTW 4 Golder Rules:
1) Do not jump in
2) Do not over risk/trade
3) Do not trade without Stop Loss
4) Never ever add to a losing position!
Trade with care
We Trade Waves
WTW Team
Disclosure: We are part of Trade Nation's Influencer program and receive a monthly fee for using their TradingView charts in our analysis.
UPS Swing 1H Long Conservative CounterTrend TradeConservative CounterTrend Trade
+ long impulse
- support bar above JOC level
+ support level
- above 1/2 correction
+ volumed 2Sp-
+ weak test
Calculated affordable virtual stop loss
1 to 2 R/R take profit above 1H T1 below 1D CREEK
Daily CounterTrend
"= uniderectional balance
+ expanding ICE level
+ support level"
Monthly CounterTrend
"- short impulse
+ biggest volume T1
+ biggest volume breaking bar with bad result"
Yearly Trend
"+ long impulse
+ 1/2 correction
+ T2 level
+ support level"

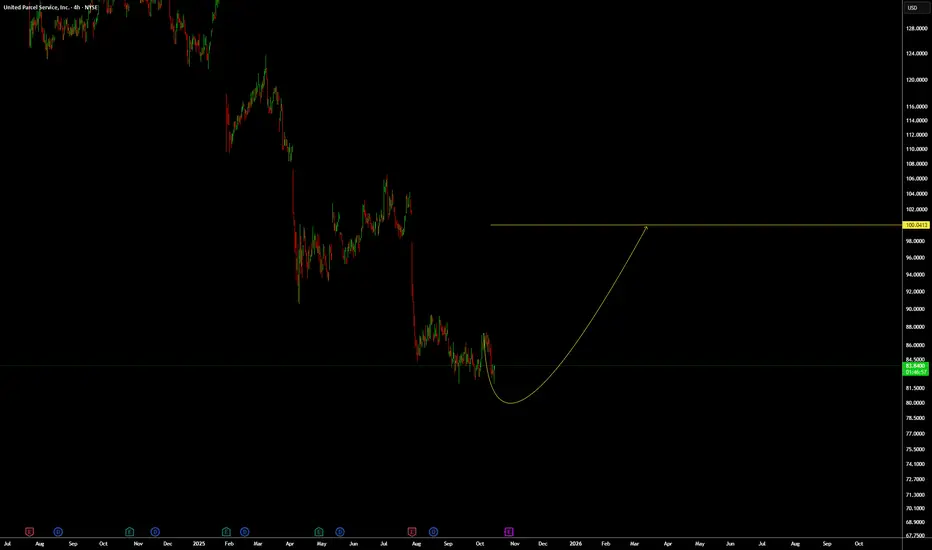
UPS: Should go up to 100 level.Based on WTW Concept and from a technical point of view, we will look for buy setups on NYSE:UPS it is ready to go up even if it will go a bit more lower.
We Trade Waves
WTW Team
Disclosure: We are part of Trade Nation's Influencer program and receive a monthly fee for using their TradingView charts in our analysis.
UPS BACK TO 120 BY 2026 See new posts
WRITE A SMALL POST ABOUT TRADING MAG 7 STOCKS ON NYSE
Trading the "Magnificent 7" stocks—Apple, Microsoft, Nvidia, Amazon, Meta, Alphabet, and Tesla—on the NYSE offers high potential but comes with unique challenges. These tech giants drive market trends, boasting massive market caps and innovation-driven growth. Their volatility, fueled by earnings reports, product launches, and macroeconomic shifts, creates opportunities for traders. Focus on technical analysis (RSI, moving averages) and stay updated on news like regulatory changes or AI advancements impacting their sectors. Diversify within the group to hedge risks, and use stop-loss orders to manage volatility. Trade smart, stay informed! #Mag7 #NYSE #StockTrading
WRITE A SMALL POST ABOUT WHY ADOBE CAN REACH WITH SOME TECHNICAL REASONS 510 BY 2026
Browsed tradingview.com
Show All (4)
Why Adobe (ADBE) Could Hit $510 by 2026: Technical Breakdown Adobe's trading at ~$365 today, but bullish setups scream upside. Here's why $510 (40% gain) is in play:Bullish Triangle Breakout: ADBE's consolidated in a multi-year ascending triangle since 2020. A recent close above $370 resistance (near 50-day MA ~$383) signals breakout, targeting $510 (measured move from base at $330 low).
RSI Rebound: At 42 (neutral, not oversold), RSI is coiling for momentum shift. Weekly RSI >50 could trigger buy signals, aligning with AI-driven catalysts like Firefly integrations.
MACD Crossover Potential: MACD histogram narrowing (-5.26) hints at bullish crossover by Q4 2025. Paired with 200-day MA (~$420) as next support, this flips sentiment to "Strong Buy" per TradingView.
Analyst Backing: Consensus targets $465–$496 short-term, but long-term forecasts (e.g., LongForecast) eye $577 EOY 2026 on 11% revenue growth to $23B+.
Volatility ahead, but AI tailwinds make this a no-brainer long. What's your PT? #ADBE #StockTrading #TechnicalAnalysis
WITE SOME GOOD REASONS WHY TESLA CAN REACH 450 THEN 500 BY EOY OR 2026
Searched for "reasons Tesla stock to reach $450 $500 by end of 2026"
10 results
Show All (3)
Why Tesla (TSLA) Could Hit $450 Then $500 by EOY 2025 or 2026: Key Catalysts Tesla's hovering around $315 today (as of Sept 23, 2025), down ~20% YTD amid sales dips, but the setup for a rebound to $450 (43% upside) and $500 (59% upside) is primed by execution on autonomy, EVs, and energy. Here's the bull case, blending fundamentals and forecasts:Robotaxi & FSD Rollout Momentum: Tesla's Cybercab unveil in Oct 2025 could catalyze a surge, with unsupervised Full Self-Driving (FSD) v13 hitting highways by year-end. ARK Invest's base case eyes $4,600 by 2026 (driven 60%+ by autonomy), but even conservative models like CoinCodex forecast $453 avg in 2026, with highs to $664 on ride-hailing revenue potentially adding $10T market value.
2 sources
Piper Sandler just hiked their PT, calling TSLA the "top idea" for AV investing.
EV Delivery Rebound & Affordable Models: Post-2025 sales weakness (1.8M deliveries est.), expect 2.3M+ in 2026 with Model 2 launch (~$25K EV) ramping production to 3M+ annually. This counters China/EU headwinds, recaptures 20%+ US market share, and boosts EPS to $0.49 next quarter—fueling a $450 breakout per LongForecast's Q3 2026 path.
2 sources
Morningstar sees a 2026 revival echoing 2016's Model 3 surge.
Energy Storage Boom: Megapack deployments exploding (Q2 2025: 9.4 GWh), with 50%+ YoY growth projected through 2026, diversifying revenue to 15%+ of total. This hedges EV volatility, pushing margins to 20%+ and supporting $500 on 11% revenue growth to $130B.
Optimus Humanoid Robot Sales: External sales kick off late 2025/early 2026, targeting $20K/unit with factory pilots scaling to millions. This could add $1T+ valuation long-term, per ARK, but even modest adoption lifts sentiment to $500 by EOY 2026.
2 sources
Analyst consensus (51 firms) averages $391 short-term, but bulls like Fubon ($1,000) and CoinPriceForecast ($526 EOY 2026) back the push.
2 sources
Risks like Musk drama or tariffs loom, but flawless execution flips this to moonshot territory. Long TSLA? #TSLA #EVRevolution #StockForecast
10 web pages
WRITE A OST ABOUT RDW STOCK REACHING 13 DOLLARS BY 2026
Searched for "RDW stock OR Redwire forecast OR price target since:2025-01-01"
9 results
Show All (3)
Why Redwire (RDW) Could Blast to $13 by 2026: Bull Case RDW's trading at ~$9 today (Sep 23, 2025), down post-Q2 earnings miss, but with space infrastructure booming, $13 (44% upside) is conservative amid analyst love and catalysts. Here's the setup:Analyst Consensus Screams Upside: 8 firms rate "Buy" with avg PT $16.56–$18.64 (83–107% gain short-term), max $28—easily clearing $13 by EOY 2026 on execution. Even bears like BofA's $10 see room for rebound; H.C. Wainwright holds $22 Buy post-acquisition.
4 sources
Zacks ABR 1.00 (Strong Buy) backs $26 avg.
NASA & Defense Contract Pipeline: $25M NASA IDIQ award (Aug '25) for space tech, plus prime for Skimsat and Honeywell quantum collab—fuels 20%+ YoY revenue to $550M+ in 2026. Artemis funding stability hedges risks, per Roth MKM Buy.
Edge Autonomy UAS integration adds drone revenue, targeting $100M backlog growth.
Acquisition Synergies & Margin Expansion: Q2's Transformative Acquisition (e.g., Hammerhead integration) boosts EPS from -$1.41 to break-even by Q4 '25, with 132M Q3 revenue est. up 15%. Analysts eye 25% margins by 2026 on in-space manufacturing scale.
2 sources
Space Economy Tailwinds: $1T market by 2040; RDW's solar arrays, 3D printing IP position it for 30% sector growth. CoinCodex forecasts $8.41 avg '26 low-end, but bulls like Canaccord ($17.50) see $13 as floor on 11% EPS ramp.
2 sources
Volatility from govt reliance, but flawless delivery flips this to orbit. Long RDW? #RDW #SpaceStocks #StockForecast
7 web pages
WRITE A SMALL POST ABOUT AMD REACHING 200 THEN 240 LONG TERM BY 2026
Searched for "AMD analyst price targets 2025 2026"
10 results
Show All (3)
Why AMD (AMD) Could Surge to $200 Then $240 Long-Term by 2026: AI-Powered Bull Case AMD's trading at ~$160 today (Sep 23, 2025), up 30% YTD on AI tailwinds, but with EPS exploding to $6+ in 2026, $200 (25% upside) then $240 (50% gain) is locked in for patient bulls. Here's the roadmap:AI Datacenter Dominance: MI355X GPUs ramping Q4 '25, capturing 20%+ market share from Nvidia via cost-efficient accelerators (40% better tokens/$). Oracle's Zettascale cluster + Meta/Microsoft deals project $40B+ revenue in '26 (21% YoY), per analysts—fueling $200 breakout as datacenter hits 50% of sales.
2 sources
EPS Acceleration & Valuation Pop: Consensus EPS jumps 54% to $6.01 in 2026 (from $3.90 '25), trading at 27x forward P/E—undervalued vs. peers at 0.49 PEG. At 33x (Nasdaq-100 avg), that's $199 EOY '26; bulls like Truist eye $213 short-term, scaling to $242 on 35% growth.
3 sources
Gaming/Quantum Rebound: Ryzen AI CPUs + IBM quantum collab revive gaming (15% YoY) and edge AI, adding $10B+ revenue. MI400 launch '26 cements leadership, per CoinPriceForecast's $242 avg.
2 sources
Analyst Consensus Backs It: 34 firms avg $188 PT (high $230), with LongForecast hitting $296 mid-'26 on momentum. Export risks loom, but flawless execution = moon.
2 sources
Long AMD for the AI decade? #AMD #AIStocks #StockForecast
6 web pages
DO THE SAME WITH CHIPOTLE 50 DOLLARS
Why Chipotle (CMG) Could Climb to $50 by 2026: Tasty Bull Case Chipotle’s trading at ~$43 today (Sep 23, 2025), down slightly YTD, but with strong fundamentals and operational wins, $50 (16% upside) by EOY 2026 is achievable long-term. Here’s the recipe:Revenue & Same-Store Growth: Q2 '25 comps +11.1% and $3.8B revenue (15% YoY) signal robust demand. Analysts project 13% YoY growth to $12.5B in '26, driven by 300+ new stores and digital orders (30%+ of sales). This supports $1.75 EPS, pushing P/E to 28x for a $50 target.
Operational Efficiency: Chipotlanes (drive-thru) now in 60% of new locations, boosting margins to 28%+. Automation in prep (e.g., Autocado) cuts costs 5%, per management, fueling EPS growth to $2.10 by '26, aligning with $50 at 24x forward P/E.
Analyst Optimism: 27 firms avg $50.24 PT (high $62), with BMO Capital’s $56 Buy rating citing loyalty program strength (35M+ members). CoinPriceForecast sees $53 mid-'26, clearing $50 on 10% comps.
Consumer Resilience: Despite inflation, CMG’s premium positioning (health-focused, customizable menu) retains Gen Z/Millennial traffic, hedging macro risks. LongForecast eyes $54 by Q3 '26.
Price wars or labor costs could bite, but Chipotle’s growth engine is sizzling. Long CMG? #Chipotle #StockForecast #FastCasual
WRITE A POST ABOUT LUNAR STOCK INUTIVE MACHINES BACK TO 20 DOLLARS BY 2026
Searched for "LUNR stock forecast 2026 revenue growth"
10 results
Show All (3)
Why Intuitive Machines (LUNR) Could Rocket Back to $20 by 2026: Lunar Bull Case LUNR's trading at ~$9.71 today (Sep 23, 2025), down from its $24.95 peak amid mission hiccups, but with NASA contracts stacking and revenue exploding, $20 (106% upside) is in orbit by EOY 2026. Here's the launch sequence:NASA Contract Avalanche: Fresh $2.5M NextSTEP award (Jan '25) for lunar logistics, plus $4.82B Near Space Network (NSN) for comms/nav through 2029 (extendable to 2034). IM-3 mission in '26 delivers South Pole payloads ($116.9M CLPS), scaling DTE services to $200M+ annually.
5 sources
LTV award mid-'25 adds mobility revenue, hedging risks.
Revenue Hypergrowth: From $217M in '25 to $700M+ in '26 (222% YoY) on dual missions, relay sats, and NSN backlog. EPS flips to $0.03 avg (from -$0.22), trading at 20x forward P/E—undervalued vs. space peers at 30x.
2 sources
Analyst Moonshot Targets: Consensus $15.44 short-term (6 firms, Moderate Buy), but bulls like Canaccord ($26, up from $17.50) and Intellectia ($24.94 Dec '26) eye $20+ on Artemis tailwinds. Highs to $31.88 clear it easy.
5 sources
Artemis & Market Boom: $1T space economy by 2040; LUNR's Nova-C landers + Khon sats position it for 20-30% YoY growth, per Reddit bulls modeling $500M+ revenue at 20x P/S = $100 PT (conservative slice: $20).
Mission delays or funding cuts loom, but flawless IM-3 execution = liftoff. Long LUNR to the Moon? #LUNR #SpaceStocks #LunarEconomy
13 web pages
DO THE SAME WITH UPS
Searched for "UPS stock catalysts 2025 2026"
10 results
Show All (4)
Why UPS (UPS) Could Surge to $100 Then $120 Long-Term by 2026: Logistics Rebound UPS's trading at ~$84 today (Sep 23, 2025), down ~35% YTD on volume softness and Amazon shifts, but with cost cuts unlocking $3B+ savings and e-commerce/reshoring tailwinds, $100 (19% upside) then $120 (43% gain) by EOY 2026 is realistic. Here's the bull thesis:Efficiency Overhaul & Amazon Pivot: Cutting Amazon volumes >50% by mid-2026 frees capacity for higher-margin SMB/premium parcels, boosting domestic margins to 12%+. Network of the Future automation (164 closures, 20K job cuts) delivers $3.5B annual savings by '26, per management—driving $100 on EPS ramp to $7.38 (13% YoY).
3 sources
Revenue & Margin Expansion: Guidance eyes $108-114B revenue in '26 (above $102B est.), with 1% YoY growth accelerating to 4% in '27 on healthcare logistics (Andlauer acquisition) and nearshoring demand in LatAm/Europe. Operating margins hit 13%+, undervalued at 14x forward P/E vs. 5-yr avg 16.5x—pushing to $120 per Goldman Sachs catalysts.
4 sources
EPS Acceleration: Consensus $7.38 EPS in '26 (up 13% from $6.51 '25), with highs to $8.00 on freight recovery and digital investments. At 16x (historical norm), that's $118+; CoinPriceForecast aligns at $114 EOY '26.
2 sources
Analyst Consensus Fuels It: 29 firms avg $104 PT (24% upside, high $145), with "Buy" ratings from Goldman/Raymond James citing mid-'26 profitability inflection. Zacks sees 26% to $112

Pessimistically Optimistic!- NYSE:UPS stock has been a dog in the last 3 years.
- However, worst appears to be behind us.
- Fundamentally,
| Year | Bear EPS | Base EPS | Bull EPS |
| -------- | ---------------- | ---------------- | ------------------|
| 2025. | ~$6.90 (~3%) | ~$7.20 (+7% ) | $7.70 (~15% ) |
| 2026 | ~$7.10 (+3%) | ~$7.70 (+7%) | ~$8.85 (+15%) |
| 2027. | ~$7.30 (+3%) | ~$8.25 (+7%) | ~10.18 (+15%) |
- NYSE:UPS isn't a growth story but a value play. Currently, it is trading at a valuation of bear case and forward p/e of 10.
- However, I am betting on stabilization and upward revision of multiple. In that case, a fair forward p/e would be 12-15x
| Year | Bear Case Price | Base Case Price | Bull Case Price |
| -------- | ------------------ | -------------------------- | -------------------- |
| 2025 | $6.90× 10⁻¹² → $69-83| $7.20× 15-18 → $108-130| $7.70× 20-25 → $154-193|
| 2026 | $7.10× 10⁻¹² → $71-85| $7.70× 15-18 → $116-139 | $8.85× 20-25 → $177-221 |
| 2027 | $7.30× 10⁻¹² → $73-88 | $8.25× 15-18 → $124-149 | $10.18×20-25 → $204-255 |

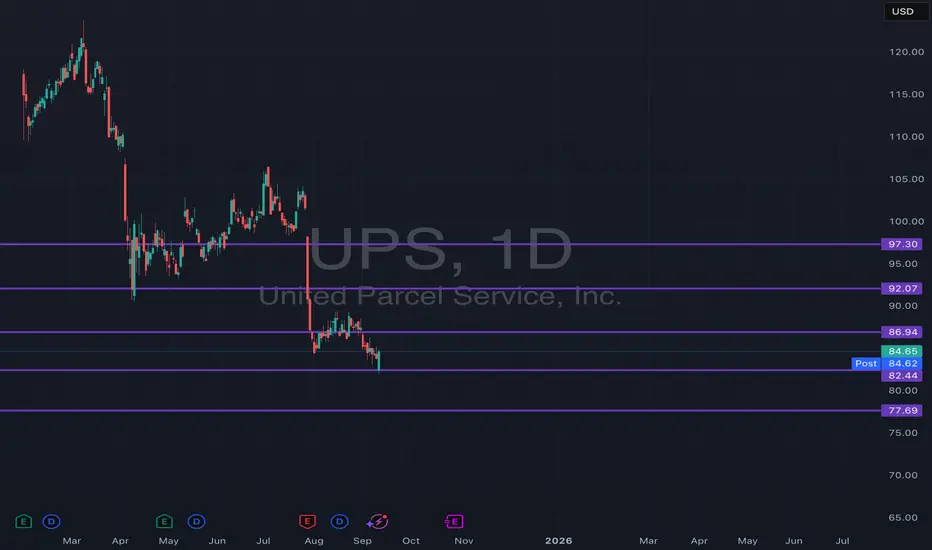
UPS Support & Resistance Lines for September Month 2025This chart highlights September’s monthly support and resistance bands for UPS, built as “guardrails” around the month's price action. The outer bands mark the expected extremes, while the inner (half-step) lines act as intermediate pivot zones where price often pauses, flips, or accelerates. Think of them as a pre-mapped playbook for the month: upper band = supply, lower band = demand, with the midlines guiding targets and risk.
How I trade it
30-minute for 2–3 day swings
Setup: I wait for a 30-min close into a band (upper or lower) plus a clear reaction (wick rejection, momentum fade, or structure break).
Entry: Fade the move back toward the nearest midline when the reaction confirms; or ride a continuation if price accepts above/below a band and retests it from the other side.
Targets: First target is the nearest half-step line, second is the opposite half-step, final is the far band if momentum persists.
Risk: Stop goes just outside the band (for fades) or just back inside the band (for breakouts). If the 30-min closes back through my line, I’m out—no questions asked.
Management: Scale out at each line; move stops to break-even after TP1.
1–3 hour for weekly swings
Bias: I align 1h/2h/3h trend with where price sits relative to the monthly bands. Acceptance above a midline favors continuation to the next line; rejection at a band favors a mean-revert path.
Entry: Use a retest of the broken line on 1–3h candles for confirmation (close-through → retest → resume).
Targets: Next line on the map; let winners run to the next higher-timeframe band if structure holds.
Risk: Stop beyond the reclaimed line; I tighten weekly as soon as we tag the first target zone.
Playbook cues
Rejection at outer band → look for fades back to midline.
Acceptance and hold beyond a band → trade continuation into the next zone.
Stalls at half-step → take partials or tighten stops; these levels often “decide” the next leg.
Use the bands to plan entries, exits, and invalidations before the move. No predictions—just rules around predefined levels for September.
UPS: From Delivering Packages to Delivering ValueAs you probably know by now, my strategy consists of finding cheap, deep-value, beaten-up, underdog stocks. This is the strategy I've been using for the last 5 years and that allows me to consistently outperform the S&P 500 by 2x to 3x every year.
This does not guarantee that all my analyses are correct. But if I'm correct 6 or 7 times out of 10, then I'm a rich man!
Now back to UPS!
Over the last 3 years, the stock lost 64% of its value. But... did sales or income decline by the same account? Did margins decline? Did the company decrease its fleet by 60%?
The answer to all these questions is NO, and this is why I think the stock is undervalued.
Yeah, the tariff war and Amazon's slowing of the UPS agreement hurt sales, but these are transient.
Overview
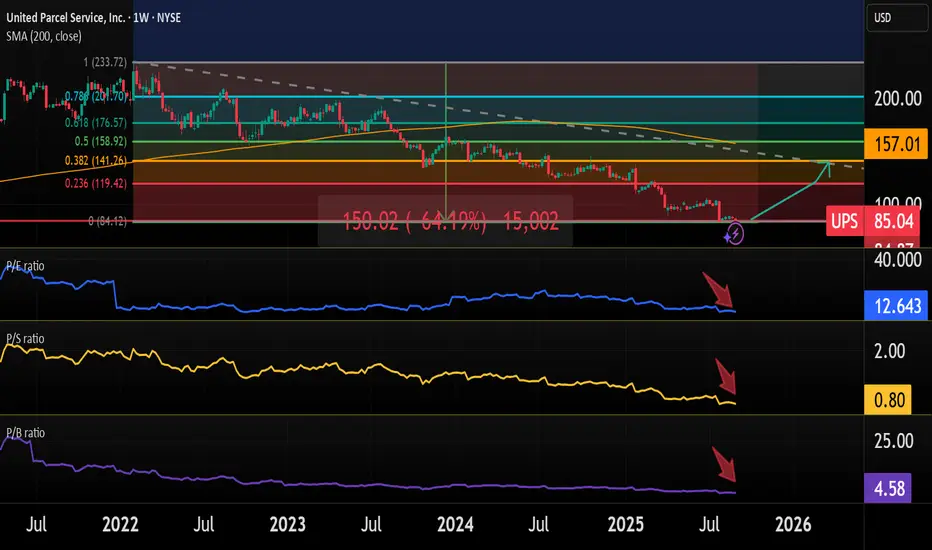
UPS stock is down 64% since its ATH in 2022.
P/S ratio is at 0.8, the lowest since 2009.
P/E ratio is at 12.6, the lowest in the history of the stock
The P/B ratio is at 4.58, the lowest since 2006.
Dividend yield is at 7.8%.
The CEO recently bought $1 million worth of UPS stock.
This data gives us some clues. The stock is obviously underpriced, despite the fact that UPS is still one of the market leaders and the sales are stable.
Financial performance
Revenue: TTM $90.69 billion (+1.3% YoY); Revenue is improving, but still 10% down since the $100 billion in 2022.
Profitability: Operating margin 9.4% (TTM), net margin 6.4%;
EPS is now at $7.70, which is a similar level to what it was in 2020 and 2021, when the stock price was at $120. However, now the stock price is at $85.
Balance Sheet: Debt $26 billion, debt-to-equity 1.45x, which is totally fine.
Growth prospects
UPS is cutting costs and jobs, targeting $3.5 billion in savings by 2026 via automation/AI (5-7% annual cost reduction).
E-commerce will sustain long-term growth.
The company is innovating with AI-improved routes, self-driving trucks, and drones.
Technical Analysis
The stock price is right above the $85 resistance level, which has been a support/resistance level since 2005.
My target
Considering the prospects, estimates, etc, I can see UPS going to $110 to $130 range in mid-2026, providing an upside of 30% to 40%. This level also aligns with the Fibonacci 0.236 level.
If the stock continues to drop, I will simply average down. I don't think it can drop much more from here, and it will definitely not go bankrupt.
I'm gonna invest approximately 1% of my wealth into this stock.
Remember, I'm just sharing my journey and this is not financial advice! 😎
DPRO - DRAGONLY High Risk High RewardDragonfly is a very risky investment that has an amazing amount of upside potential.
A low price equity stock that is gaining market share in Canada as a major ecommerce delivery business.
As a resident of Canada its amazing to see how many of these vehicles have now appeared on our roads and delivering packages.
If you expect continued growth from NASDAQ:AMZN and online ordering this company should drastically benefit.
DPRO could easily steal market share from FDX UPS and other areas of the transport delivery market.
Keep in mind this is very speculative.

UPS Here’s the latest on **United Parcel Service (UPS)** stock:
## Stock market information for United Parcel Service, Inc. (UPS)
* United Parcel Service, Inc. is a equity in the USA market.
* The price is 88.82 USD currently with a change of 2.66 USD (0.03%) from the previous close.
* The latest open price was 86.47 USD and the intraday volume is 10230694.
* The intraday high is 89.295 USD and the intraday low is 86.3 USD.
* The latest trade time is Saturday, August 23, 03:58:32 +0400.
---
## UPS Stock — Key Overview
### Company Snapshot
**United Parcel Service, Inc. (UPS)** is a global leader in package delivery and supply chain management. Originally founded in 1907 as the American Messenger Company, it has evolved to become one of the largest logistics providers worldwide ( ).
UPS operates through three main segments:
* U.S. Domestic Package
* International Package
* Supply Chain & Freight services ( ).
On the stock front, UPS Class B shares (ticker: UPS) are publicly traded on the New York Stock Exchange (NYSE). Class A shares carry greater voting power (10 votes each) but are **not publicly traded** and are primarily held by employees and retirees ( ).
---
### Performance & Valuation
* On **August 22, 2025**, UPS closed at **\$88.82**, up about **+3.10%**, though it still underperformed peers like FedEx (+5.11%) ( ).
* The stock remains approximately **39% below** its 52-week high of about **\$145** ( ).
* Financially, in 2024 UPS posted **\$91 billion** in revenue (flat year-over-year) and net earnings of **\$5.78 billion** (down \~14%) ( ).
* Valuation-wise, analysts maintain an average recommendation of **“Buy”**, with a **12-month target price** of around **\$112.11**, suggesting \~26% upside ( ).
According to **Bernstein** (as of January 2025):
* Target increased to **\$179**, citing improving cost visibility and expected margin expansion to \~12% by 2026 (up from below 10% in 2024) ( ).
* **Wolfe Research** also upgraded UPS to Buy, setting a target of **\$147**, based on anticipated margin improvements ( ).
---
## Recent Highlights & Challenges
### Earnings Miss & Guidance Concerns
* In **Q2 2025**, UPS missed expectations with **adjusted EPS of \$1.55** (vs. \$1.56 forecast), while revenue came in at **\$21.2 billion**—slightly above estimates but down \~2.8% year-over-year ( ).
* The company **did not issue full-year guidance**, citing uncertainty from low U.S. consumer sentiment and macroeconomic pressures, including tariffs and weak demand in the small-package segment ( ).
* As a result, UPS shares plunged over **10% in a single trading session** ( ).
### Insider Buying as a Confidence Signal
* Following the Q2 downturn, CEO **Carol Tomé** and Chairman **William Johnson** **personally purchased shares** at prices around \~\$85–86, signaling continued belief in UPS’s long-term potential ( ).
* The shares were acquired despite the stock being down \~30% year-to-date, continuing a multi-year decline that included significant drops in 2022, 2023, and 2024 ( ).
---
## Summary Table
| Category | Highlights |
| ---------------------- | ------------------------------------------------------ |
| **Current Price** | \~\$88.82 (as of Aug 22, 2025) |
| **52-Week High Gap** | \~39% below peak of \~\$145 |
| **Revenue & Earnings** | \$91B revenue, \~\$5.8B earnings in 2024 |
| **Analyst Sentiment** | “Buy”; targets range from \$112 to as high as \$179 |
| **Q2 2025 Results** | Missed EPS, revenue slight beat—but no guidance issued |
| **Insider Buying** | CEO & Chair purchased shares after earnings miss |
---
## Final Thoughts
UPS is navigating through a challenging period, marked by weak consumer sentiment and soft demand in key delivery segments. While near-term results have disappointed and guidance is lacking, management’s recent insider buying is a bullish signal that they believe in a turnaround. Analysts remain optimistic, projecting meaningful upside over the next 12–18 months if margin improvements materialize.

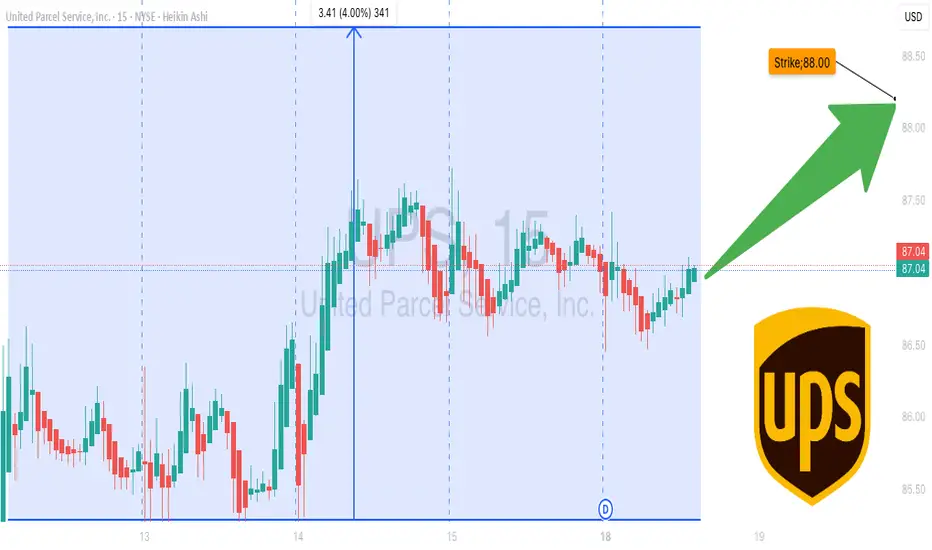
UPS Momentum Trade: Buy $88C → Target 100%+ Return by Friday
# 🚚 UPS Weekly Options Setup (8/18 – 8/22)
🔥 **Institutional Flow Signals a Bullish Week** 🔥
All major AI reports (xAI, DeepSeek, Google, Anthropic) are calling **MODERATE BULLISH**, backed by:
* 📊 **Call/Put Ratio = 3.47** → Strong institutional bias
* 📉 **VIX < 22** → Premiums favorable for long calls
* ⚠️ **RSI Bearish** → Risk of reversal, so keep stops tight
---
## 🎯 Trade Setup
* **Instrument**: UPS
* **Direction**: CALL (LONG)
* **Strike**: \$88.00
* **Expiry**: 2025-08-22
* **Entry**: \$0.92
* **Stop Loss**: \$0.46 (-50%)
* **Target**: \$1.38 – \$1.84 (+50% to +100%)
* **Confidence**: 65%
* **Timing**: Enter at open → Exit by Thursday (avoid gamma burn!)
---
## 📈 Breakeven @ Expiry
👉 \$88.92 (Strike + Premium)
UPS must close above **\$88.92 by 8/22** for profit at expiry.
But plan is **exit early** on IV move → don’t hold into Friday risk!
---
## 🧠 Key Risks
* Macro shock headlines 📰
* RSI weakness → possible fakeouts ⚠️
* Volatility spike → premium whipsaw 🎢
---
# ⚡ UPS 88C WEEKLY PLAY ⚡
🎯 In: \$0.92 → Out: \$1.38–\$1.84
🛑 Stop: \$0.46
📅 Exp: 8/22
📈 Flow > RSI → Betting with the whales 🐋
Things are looking UPSUnited Parcel Service served as one of our canaries in the coal mine, signalling that the real economy was much weaker than what the Biden administration was reporting. The figures presented were positively skewed, masking the harsh reality that we were all facing difficult times.
We recognized the head and shoulders topping pattern and warned that an economic disaster was approaching us. This ultimately led to the Trump tariff panic that caused the collapse of equities.
The thesis indicated a lack of confirmation regarding rising index prices; however, consumers were feeling the pressure, which manifested in reduced consumption and, consequently, fewer deliveries.
A modern Dow Theory if you will.
As we near new peaks in the stock market, I am convinced that our economy is on a much more solid foundation, poised to benefit Main Street instead of just a handful of monopolistic tech giants. Since equities are forward-looking, stocks are anticipating an exhilarating 2026!
I believe UPS will confirm this economic recovery as we head towards my long anticipated and forecast DOW JONES price of 64,000 likely by 2030.

UPS United Parcel Service Stock. Top stock to buy in 2025UPS United Parcel Service Stock. Top stock to buy in 2025 after reaching the strong monthly demand level. It took 50 months to reach it and now it's trying to play out as expected. Long-term longs for this American stock.

UPS ready for FlyWe can see in short and simple terms that there is a good opportunity to buy this company. In a situation that we may not reach as often as in 2017
And now there is a good opportunity for 30% growth..
How to buy and consult in the Solobox collection
