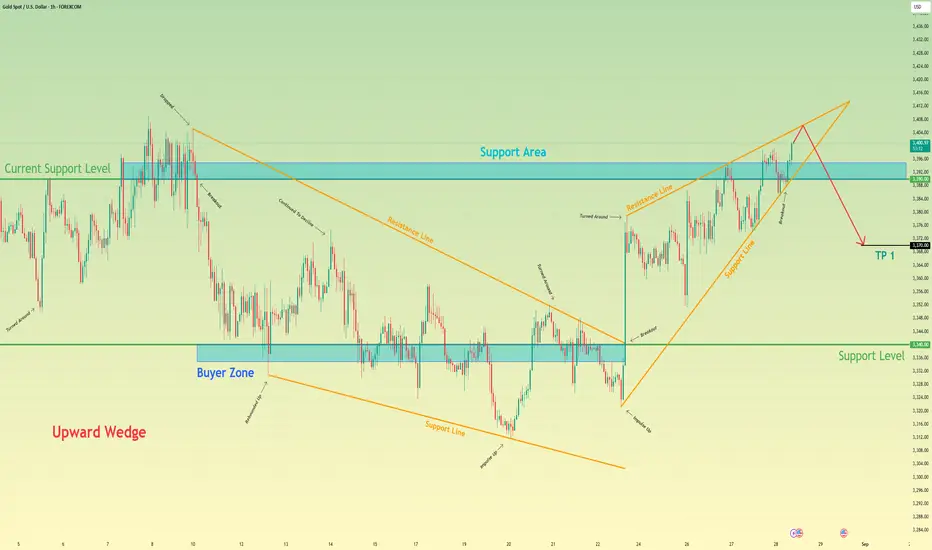
Gold will start to decline and then exit from wedgeHello traders, I want share with you my opinion about Gold. The market dynamic for XAUUSD has seen a significant evolution, transitioning from a corrective falling wedge into a new bullish phase after a powerful breakout from the lows. This upward trend has since matured and taken the shape of a large upward wedge, a pattern that has been guiding the price higher through a series of rebounds and corrections. This formation, while bullish in the short term, often signals potential trend exhaustion as it approaches its apex. Currently, the price action for XAU is at a critical juncture, pushing up against the upper resistance line of this wedge. The primary working hypothesis is a short scenario, which is predicated on the common bearish resolution of a rising wedge pattern. It is anticipated that the asset will be rejected from this resistance line, signalling that buying momentum is waning. A confirmed failure at this peak would likely trigger a sharp reversal, with enough selling pressure to cause a breakdown below the wedge's ascending support line and the current support level of 3390. This structural failure would validate the bearish thesis and initiate a new downward leg. Therefore, the TP is logically set at 3370 points, representing a prudent first objective for the price to achieve following the anticipated breakdown of the wedge structure. Please share this idea with your friends and click Boost 🚀
Upwardwedge
Gold can exit from downward wedge and then continue to riseHello traders, I want share with you my opinion about Gold. If we look at the chart, we can see how the price some time ago entered to upward wedge, where firstly it rebounded from the support line and made a strong upward impulse to the resistance level, which coincided with the seller zone, thereby breaking the 2150 support level. After this movement, Gold turned around and started to decline to the support area, where later it bounced and started to rise. A short time later price exited from the upward wedge and rose to the 2195 resistance level, and soon Gold broke this level and even rose higher than the seller zone. But later price turned around and started to decline in a downward wedge, in which the price broke the resistance level one more time and in a short time declined to support line of the wedge. Also recently price rebounded from this line and started to rise to the resistance line. So, I think Gold can reach the resistance line, after which it rebounds down to the support line and then makes an upward impulse, thereby exiting from the downward wedge. For this reason, I set my target at the 2180 level. Please share this idea with your friends and click Boost 🚀

MPC - Still a long way to go to find harmony and balanceMPC (along with all refiners) appear considerably cheap to replacement value. MPC's chart pattern indicates it has placed in an upward sloping wedge formation.
PetroChina building refining capacity to the tune of $70,740 per refined barrel. This is above the industry average of $32,800. With these new figures in place,
industry replacement value offers a substantial upside. Cash Flow, Share Buy-Backs, Cash Levels are all strong!

ETH Prediction for 2022. Could hit ATH at around 5200, then it can go far down as low as 3k, then to continue the uptrend...

ETH Upward Wedge Formation for Possible ReversalI have been carefully watching ETH since the 19th, and predicted the drop to finish forming the upward wedge, and here we ARE.
There is a possible trend reversal coming if it breaks the bottom trendline.
ETH possible next stops because of support:
- 1000: nice support on the left
- 750 - 800: possibly, although the support is not huge
- 600 and possible the final for a bounce upward: very very decent support on the left

ADA (Cardano) Upward Wedge Formation for Possible ReversalADA just looks like is forming an upward wedge with a possible reversal to the short side.
There is a possible trend reversal coming if it breaks the bottom trendline.
ADA possible next stops because of support:
- .25 - .26 : decent support on the left
- .15 - .18: strong support on the left possible last stop to bounce back up.

Downtrend Raising WedgeLooking at the downtrend that started back in February from the all time high, we see an upward wedge in the making and could be breaking soon all depending on the market. This pattern on this downtrend could be a continuation upward wedge since an upward wedge tends to break downward, so there is a probability it could continue downward after breaking the upward wedge going down. The upward wedge also hit resistance at 69 and it is currently going down getting close to the trend line. Breaking that trend line could be a good possibility to enter on a short trade after confirmation of a candle stick. Looking at Ichimoku, pattern still under the cloud, and the cloud act as resistance too.

Bearish looking Upward wedgeIf you look at the 1M and 1W, you will see solid resistance and at the 1W you can see kind of like an upward wedge and a red inverted hammer wick. Zoom in a little to 1D and we will see kind of like an upward wedge formation going on, and that it is currently retracing from resistance, but some consolidation here could happen. From here on we will need to wait a few days, perhaps until next week or so to see what will happen next because nothing is guaranteed.
I am looking for a nice short entry at the 1H...

Upward Wedge Bear ContinuationHere we see how it broke the upward wedge and it could possibly continue down for a nice short entry. I am hoping to get it before it continues down.

Possible restest to continue down after break of upward wedge At 1D we see a an upward edge that broke the trend line and the support line with a gap. Currently it looks like if it was retesting back to the gap and the resistance line (that used to be support). If it does retest, it would be a nice entry to the short side at the 1H after confirmation.
PS. I already entered the trade a little bit before that and it looks like it is coming back down.

update to NFLX (4h Chart) sell off to ensuemore on a previous post
FAANG stocks are fuct
they may make marginally higher highs, but the risk you take entering or staying in these prices is crazy. considering you should be taking profits now, not waiting for the rocket to reach next galaxy.
