Oil prices rebounded as focus on US-IranOil prices rebounded as markets focused on US-Iran nuclear negotiations, which have dragged on for months without a breakthrough. It raises concerns about the US's escalating tensions to gain bargaining power.
However, the persistent oversupply is forecast to persist due to production expanding beyond the increase in demand this year. But 60 USD/barrel is the anchor for US producers to maintain a certain profit, which urges the US to take action to keep oil prices around this level.
Technically,
WTI is still in an uptrend, with higher lows along the trendline and key support near 61.5–62 that continues to attract buyers on dips, and prices are trading above both extension EMAs (21, 78).
The 65–66.2 zone is a critical resistance area; a strong close above it would open room toward the upper 60s, while rejection and a break below the trendline and 61.5 would warn of a deeper correction.
By Van Ha Trinh - Financial Market Strategist at Exness.
US

Heading towards key resistance?US Dollar Index (USD) is rising towards the resistance level, which is an overlap resistance that aligns with the 50% Fibonacci retracement and could reverse from this level to our take profit.
Entry: 97.37
Why we like it:
There is an overlap resistance level that aligns with the 50% Fibonacci retracement.
Stop loss: 97.93
Why we like it:
There is a pullback resistance level that is slightly above the 61.8% Fibonacci retracement.
Take profit: 96.30
Why we like it:
There is a pullback support level.
Enjoying your TradingView experience? Review us!
Please be advised that the information presented on TradingView is provided to Vantage (‘Vantage Global Limited’, ‘we’) by a third-party provider (‘Everest Fortune Group’). Please be reminded that you are solely responsible for the trading decisions on your account. There is a very high degree of risk involved in trading. Any information and/or content is intended entirely for research, educational and informational purposes only and does not constitute investment or consultation advice or investment strategy. The information is not tailored to the investment needs of any specific person and therefore does not involve a consideration of any of the investment objectives, financial situation or needs of any viewer that may receive it. Kindly also note that past performance is not a reliable indicator of future results. Actual results may differ materially from those anticipated in forward-looking or past performance statements. We assume no liability as to the accuracy or completeness of any of the information and/or content provided herein and the Company cannot be held responsible for any omission, mistake nor for any loss or damage including without limitation to any loss of profit which may arise from reliance on any information supplied by Everest Fortune Group.

USDOLLAR H4 | Bullish ReversalThe price is reacting off the pivot and could bounce off our buy entry level at 12.67, which is a swing low support.
Our stop loss is set at 12.64, there is a support level at 127.2% Fibonacci extension.
Our take profit is set at 12.71. a pullback resistance that aligns with the 38.2% Fibonacci retracement.
High Risk Investment Warning
Stratos Markets Limited fxcm.com Stratos Europe Ltd fxcm.com
CFDs are complex instruments and come with a high risk of losing money rapidly due to leverage. 69% of retail investor accounts lose money when trading CFDs with this provider. You should consider whether you understand how CFDs work and whether you can afford to take the high risk of losing your money.
Stratos Global LLC fxcm.com Losses can exceed deposits.
Please be advised that the information presented on TradingView is provided to FXCM (‘Company’, ‘we’) by a third-party provider (‘TFA Global Pte Ltd’). Please be reminded that you are solely responsible for the trading decisions on your account. Any information and/or content is intended entirely for research, educational and informational purposes only and does not constitute investment or consultation advice or investment strategy. The information is not tailored to the investment needs of any specific person and therefore does not involve a consideration of any of the investment objectives, financial situation or needs of any viewer that may receive it. Past performance is not a reliable indicator of future results. Actual results may differ materially from those anticipated in forward-looking or past performance statements. We assume no liability as to the accuracy or completeness of any of the information and/or content provided herein and the Company cannot be held responsible for any omission, mistake nor for any loss or damage including without limitation to any loss of profit which may arise from reliance on any information supplied by TFA Global Pte Ltd.
Stratos Trading Pty. Limited fxcm.com
Trading FX/CFDs carries significant risks. FXCM AU (AFSL 309763), please read the Financial Services Guide, Product Disclosure Statement, Target Market Determination and Terms of Business at fxcm.com

Unmitigated Supply Zone on GBPUSD | H4Unmitigated Supply Zone on GBPUSD, a POI for on the H4 timeframe. Let's see how price reacts to this zone.

APGO - Following Silver’s Footsteps?Markets don’t move in isolation.
They rhyme… especially when capital rotates from the metal to the miners .
Over the past few months, Silver quietly broke out of a long-term accumulation range…
And once it did, price exploded higher with speed and conviction.🚀
Now zoom out on Apollo Silver TSXV:APGO and the structure looks uncomfortably familiar 👀
📊 Technical Analysis
After a brutal markdown phase that lasted more than a decade, APGO spent years building a clear accumulation base , following Silver’s broader long-term path.
That base is now being tested:
• The upper accumulation zone around $5.7 is acting as a key decision level
• Price is transitioning from accumulation into early markup behavior
• The structure mirrors Silver’s breakout phase almost step by step
Just like Silver:
– Long accumulation
– Clean breakout
– Brief consolidation
– Then acceleration
If APGO confirms breakout above the accumulation phase, the technical roadmap opens toward a full markup phase , with much higher levels coming into play.
This is no longer about catching bottoms; it’s about recognizing phase shifts.📉📈
🌍 Bigger Picture - Why Silver, Why Apollo?
Silver isn’t just a precious metal anymore; it’s a strategic industrial input.
Apollo Silver controls one of the largest undeveloped silver resources in the U.S., with over 125M ounces measured & indicated and 57M ounces inferred at the Calico project. 🗻
🥈Silver demand is accelerating across:
AI data centers, solar energy, 5G infrastructure, and defense systems, all while supply remains constrained.
On top of that, Apollo’s exposure to barite and zinc , both classified as critical minerals, adds optionality that most silver juniors simply don’t have.
In a world pushing for U.S. mineral independence, domestic silver assets are no longer optional… they’re strategic.🔎
📌 Bottom Line
Silver already made its move.
APGO looks like it’s next in line.
Structure is shifting.
Accumulation is behind us.
And if history rhymes, this could be the early stages of a much larger markup cycle.
⚠️ Always do your own research and speak with your financial advisor before investing.
Disclaimer: I have been paid $900 by CDMG, funded by Apollo Silver Corp., to disseminate this message.
📚 Stick to your trading plan, entry, risk management, and execution.
All strategies are good; if managed properly.
~ Richard Nasr

USDOLLAR H4 | Bullish Bounce OffThe price has bounced off our buy entry level at 12.707, which is an overlap support that is slightly above the 78.6% Fibonacci retracement.
Our stop loss is set at 12.686, which is a pullback support.
Our take profit is set at 12.73, whichis a pullback resistance that aligns with the 50% Fibonacci retracement.
High Risk Investment Warning
Stratos Markets Limited (fxcm.com/uk), Stratos Europe Ltd (fxcm.com/eu):
CFDs are complex instruments and come with a high risk of losing money rapidly due to leverage. 69% of retail investor accounts lose money when trading CFDs with this provider. You should consider whether you understand how CFDs work and whether you can afford to take the high risk of losing your money.
Stratos Global LLC (fxcm.com/en): Losses can exceed deposits.
Please be advised that the information presented on TradingView is provided to FXCM (‘Company’, ‘we’) by a third-party provider (‘TFA Global Pte Ltd’). Please be reminded that you are solely responsible for the trading decisions on your account. Any information and/or content is intended entirely for research, educational and informational purposes only and does not constitute investment or consultation advice or investment strategy. The information is not tailored to the investment needs of any specific person and therefore does not involve a consideration of any of the investment objectives, financial situation or needs of any viewer that may receive it. Past performance is not a reliable indicator of future results. Actual results may differ materially from those anticipated in forward-looking or past performance statements. We assume no liability as to the accuracy or completeness of any of the information and/or content provided herein and the Company cannot be held responsible for any omission, mistake nor for any loss or damage including without limitation to any loss of profit which may arise from reliance on any information supplied by TFA Global Pte Ltd.
Stratos Trading Pty. Limited (fxcm.com/au):
Trading FX/CFDs carries significant risks. FXCM AU (AFSL 309763), please read the Financial Services Guide, Product Disclosure Statement, Target Market Determination and Terms of Business at fxcm.com/au

EURUSD H4 | Bullish Bounce OffThe price has bounced off our buy entry level at 1.1594, which is a pullback support.
Our stop loss is set at 1.1551, which is an overlap support that is slightly below the 78.6% Fibonacci retracement.
Our take profit is set at 1.1678, which is an overlap resistance that is slightly below the 50% Fibonacci retracement.
High Risk Investment Warning
Stratos Markets Limited (

USDOLLAR H4 | Bullish BounceThe price is falling towards our buy entry level at 12.73, which is a pullback support.
Our stop loss is set at 12.71, which is a pullback support.
Our take profit is set at 12.77, which is an overlap resistance.
High Risk Investment Warning
Stratos Markets Limited (

Bullish bounce?Cable (GBP/USD) is falling towards the pivot, which acts as a pullback support that aligns with the 50% Fibonacci retracement and could bounce to the 1st resistance, which has been identified as an overlap resistance that aligns with the 61.8% Fibonacci retracement.
Pivot: 1.3437
1st Support: 1.3407
1st Resistance: 1.3498
Disclaimer:
The opinions given above constitute general market commentary and do not constitute the opinion or advice of IC Markets or any form of personal or investment advice.
Any opinions, news, research, analyses, prices, other information, or links to third-party sites contained on this website are provided on an "as-is" basis, are intended to be informative only, and are not advice, a recommendation, research, a record of our trading prices, an offer of, or solicitation for, a transaction in any financial instrument and thus should not be treated as such. The information provided does not involve any specific investment objectives, financial situation, or needs of any specific person who may receive it. Please be aware that past performance is not a reliable indicator of future performance and/or results. Past performance or forward-looking scenarios based upon the reasonable beliefs of the third-party provider are not a guarantee of future performance. Actual results may differ materially from those anticipated in forward-looking or past performance statements. IC Markets makes no representation or warranty and assumes no liability as to the accuracy or completeness of the information provided, nor any loss arising from any investment based on a recommendation, forecast, or any information supplied by any third party

DXY H1 | Bullish Bounce OffThe price has bounced off our buy entry level at 98.35, which is a pullback support that aligns with the 50% Fibonacci retracement and the 78.6% Fibonacci projection.
Our stop loss is set at 98.14, which is a pullback support.
Our take profit is set at 98.85, which is a swing high resistance.
High Risk Investment Warning
Stratos Markets Limited (

USDOLLAR H4 | Bullish Bounce Off?The price is falling towards our buy entry level at 12.72, which is a pullback support that aligns with the 50% Fibonacci retracement.
Our stop loss is set at 12.70, which is a pullback support that is slightly above the 78.6% Fibonacci retracement.
Our take profit is set at 12.76, which is a multi swing high resistance.
High Risk Investment Warning
Stratos Markets Limited (

GBPUSD – H4 Supply & Demand | Bearish TrendGBPUSD has reacted into H4 supply and delivered a bearish Break of Structure, confirming a shift in market structure.
Price has swept internal sell-side liquidity but failed to reclaim bullish structure, suggesting continuation rather than reversal.
Bias: Bearish
Idea: Sell rallies into H4 or refined lower-timeframe supply
Targets: Liquidity lows below
Invalidation: Strong reclaim above H4 supply
As long as price remains below supply, the **path of least resistance remains to the downside**.

USDOLLAR H1 | Bullish Bounce Off Overlap SupportThe price is falling towards our buy entry, which is an overlap support that aligns with he 50% Fibonacci retracement.
Our stop loss is set at 12.72, which is an overlap support that aligns with the 50% Fibonacci retracement.
Our take profit is set at 12.70, which is an overlap support.
High Risk Investment Warning
Stratos Markets Limited (

Say hello to oil prices at 40 to 50 dollars.Say hello to oil prices at 40 to 50 dollars.
Considering that the Venezuelan government has collapsed, and that major investments will flow into Venezuela in the near future, it can be said that oil prices will experience a sharp decline, and Iranian and Russian oil will become the cheapest oil in the world.

USDJPY H4 | Heading into 61.8% Fib ResistanceBased on the H4 chart analysis, we can see the price rise to our sell entry level at 156.90, which is a pullback resistance that aligns with the 61.8% Fibonacci retracement.
Our take profit is at 155.48, which is a pullback resistance, which is slightly below the 61.8% Fibonacci retracement.
Our stop loss is at 157.70, which is a swing high resistance.
High Risk Investment Warning
Stratos Markets Limited (

US DOLLAR ANALYSISOn the weekly chart, the US Dollar Index is clearly trading in a long-term bearish structure. Price has been moving under a strong descending trendline that has capped every major rally since the 2022 high, showing that sellers remain active at higher levels. After the sharp rejection near the 110 area earlier in 2025, the dollar dropped aggressively and broke below the important 100–101 support zone, which had previously acted as a strong demand area. Although price attempted to stabilize and briefly retested this zone, it failed to reclaim it, confirming that former support has now turned into resistance. The recent candles show weak upside momentum and consolidation below this key level, which signals continuation weakness rather than strength. As long as the index remains below the descending trendline and the 100–101 resistance zone on a weekly closing basis, the broader bias stays bearish, with downside pressure still dominant and no clear sign of a long-term reversal yet.

Can a Currency Rise While Science Dies?Argentina's peso stands at a historic crossroads in 2026, stabilized by unprecedented fiscal discipline yet undermined by the systematic dismantling of its scientific infrastructure. President Javier Milei's administration has achieved what seemed impossible: a fiscal surplus of 1.8% of GDP and inflation falling from 211% to manageable monthly rates around 2%. The peso's transformation from distressed asset to commodity-backed currency relies on the massive Vaca Muerta energy formation and lithium reserves, supported by a US-aligned trade framework that reduces political risk premiums. The launch of new inflation-linked currency bands in January 2026 signals normalization, while energy exports are projected to generate a cumulative total of $300 billion through 2050.
However, this financial renaissance masks a profound intellectual crisis. CONICET, Argentina's premier research council, suffered a 40% real budget cut, resulting in the loss of 1,000 staff members and triggering a brain drain that saw 10% of researchers abandon the system. Salaries collapsed 30% in real terms, forcing scientists into Uber driving and manual labor. Patent filings plummeted to a multi-decade low of 406 annually, while the country ranks a dismal 92nd globally in innovation inputs despite 64th in outputs. The administration views public science as fiscal waste, creating what critics call "scienticide," the systematic destruction of research capacity that took decades to build.
The peso's future hinges on whether geological wealth can compensate for cognitive atrophy. Energy and mining investments under the RIGI regime (offering 30-year fiscal stability) total billions, fundamentally altering the balance of payments. Yet import tariff eliminations on technology threaten 6,000 jobs in Tierra del Fuego's assembly sector, while the gutting of research labs compromises long-term capacity in biotechnology, nuclear energy, and software development. The geopolitical bet on US alignment provides bridge financing through IMF support, but tensions with China, a vital trade partner for soy and beef exports, create vulnerability. Argentina is transforming into a commodity superpower with a deliberately hollowed-out knowledge economy, raising the question: Can a nation prosper long-term by trading brainpower for barrels?

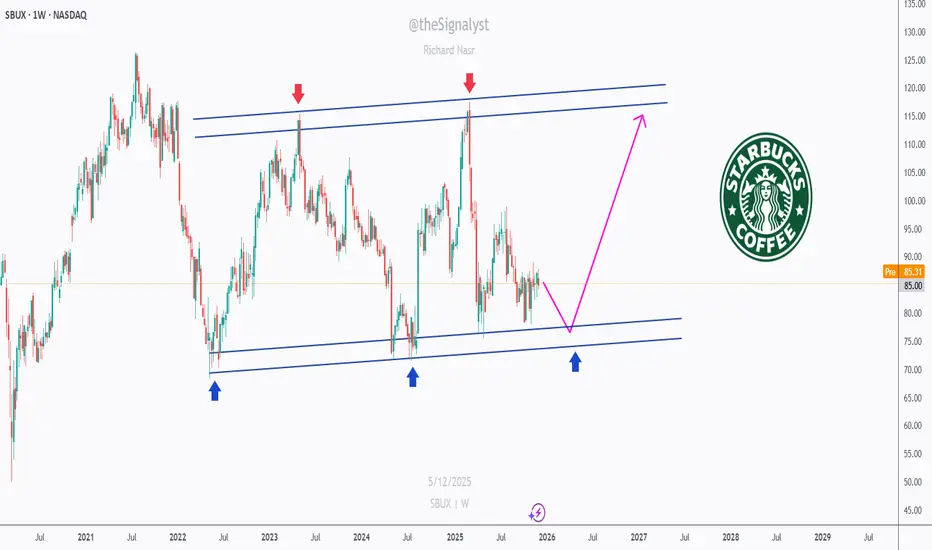
Starbucks at Support - Time to Brew a Bullish Move?📈SBUX has been moving inside a clean rising channel for years, respecting both the upper and lower bounds with precision.
⚔️Right now, Starbucks is retesting the lower bound of this long-term channel, a zone that has historically acted as a strong support (blue arrows).
As long as this area holds, we will be looking for trend-following longs, aiming for a continuation toward the mid and upper boundaries of the channel.📈
Nothing is confirmed yet, but this is exactly where buyers have stepped in many times before.
If the structure holds, the next bullish swing could already be brewing. ☕️
Do you think SBUX is ready for its next leg up? Share your thoughts below! 👇
⚠️ Disclaimer: This is not financial advice. Always do your own research and manage risk properly.
📚 Stick to your trading plan regarding entries, risk, and management.
Good luck! 🍀
All Strategies Are Good; If Managed Properly!
~Richard Nasr
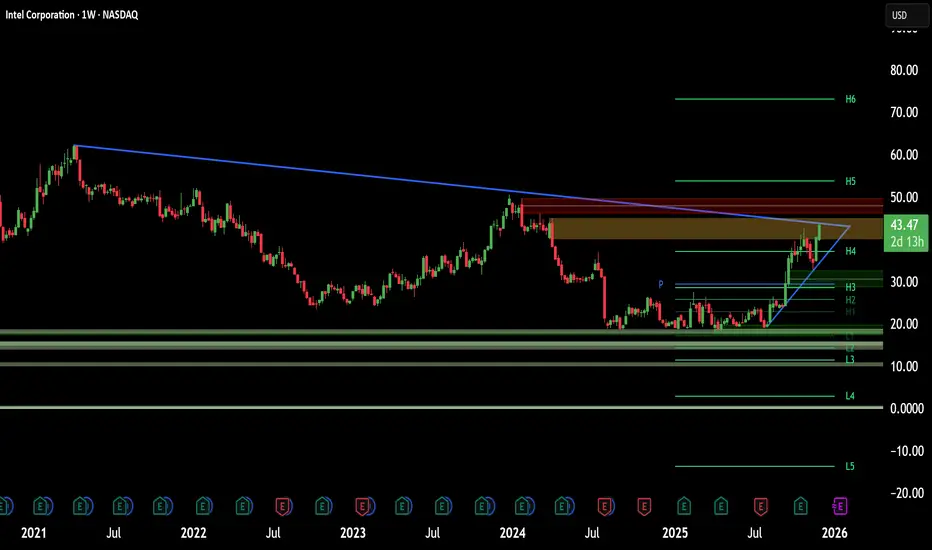
Is Intel’s Apple Deal the Ultimate Pivot?Intel (NASDAQ: INTC) stock soared over 116% this year. Reports suggest Apple may use Intel’s foundry by 2027. We analyze the drivers behind this potential resurrection.
Geopolitics & Geostrategy: The Stability Premium
In a volatile world, Intel offers a "stability premium." TSMC’s concentration in Taiwan risks Western supply chains. The US government now holds a ~10% stake in Intel. This actively incentivizes domestic production to secure the grid. Apple chooses Intel to hedge against geopolitical friction. This move aligns with US strategic interests, treating Intel as a sovereign asset.
Management & Leadership: The Tan Effect
CEO Lip-Bu Tan drives a massive cultural shift. He replaced Pat Gelsinger’s engineering vision with operational discipline. Tan prioritizes customer listening, an area where Intel historically struggled. This pivot is paying off. Securing Apple proves Intel is shedding its "arrogant" legacy. It is becoming a true service-oriented foundry.
Technology & Innovation: The 18A-P Advantage
The deal relies on Intel’s **18A-P process technology**. Apple aims to use this for entry-level M-series chips. This validates Intel's aggressive manufacturing roadmap. Additionally, the Trump administration invested $150 million in xLight. This startup develops next-gen lithography lasers to aid chipmaking. It reinforces the ecosystem surrounding Intel’s manufacturing capabilities.
Business Models: The Foundry Pivot
Intel is transforming from a product company to a hybrid foundry. Analysts estimate the Apple deal could generate ~$1 billion annually. However, the "Apple Seal of Approval" is worth far more. It signals to giants like Qualcomm that Intel is ready. It also creates leverage against TSMC’s pricing power.
Final Verdict: The Apple rumors convert Intel into a legitimate turnaround play. US geopolitical interests align with the new leadership. Validated technology suggests Intel’s worst days are likely over.
Is Boeing's Defense Bet America's New Arsenal?Boeing's recent stock appreciation stems from a fundamental strategic pivot toward defense contracts, driven by intensifying global security tensions. The company has secured major wins, including the F-47 Next Generation Air Dominance (NGAD) fighter contract worth over $20 billion and a $4.7 billion deal to supply AH-64E Apache helicopters to Poland, Egypt, and Kuwait. These contracts position Boeing as central to U.S. military modernization efforts aimed at countering China's rapid expansion of stealth fighters like the J-20, which now rivals American fifth-generation aircraft production rates.
The F-47 program represents Boeing's redemption after losing the Joint Strike Fighter competition two decades ago. Through its Phantom Works division, Boeing developed and flight-tested full-scale prototypes in secret, validating designs through digital engineering methods that dramatically accelerated development timelines. The aircraft features advanced broadband stealth technology and will serve as a command node controlling autonomous drones in combat, fundamentally changing air warfare doctrine. Meanwhile, the modernized Apache helicopter has found renewed relevance in NATO's Eastern flank defense strategy and counter-drone operations, securing production lines through 2032.
However, risks remain in execution. The KC-46 tanker program continues facing technical challenges with its Remote Vision System, now delayed until 2027. The F-47's advanced variable-cycle engines are two years behind schedule due to supply chain constraints. Industrial espionage, including cases where secrets were sold to China, threatens technological advantages. Despite these challenges, Boeing's defense portfolio provides counter-cyclical revenue streams that hedge against commercial aviation volatility, creating long-term financial stability as global rearmament enters what analysts describe as a sustained "super-cycle" driven by great power competition.

HLU - Trio Retest: Where Structure Meets Opportunity!Homeland Uranium TSXV:HLU just secured a long-forgotten 35-million-pound uranium deposit in Colorado, originally discovered in 1979 and abandoned when the nuclear industry collapsed.
With uranium prices up 141% in four years , and global demand expected to jump another 28% by 2030 , Homeland is positioning itself inside a powerful multi-year commodity cycle few investors are watching.
Add AI-driven power demand, national security concerns, and new U.S. policies fast-tracking domestic uranium, and HLU becomes a high-conviction asymmetric energy play.
📊 Technical Analysis
After surging by over 160% , HLU has been in a healthy correction phase, trading within the falling channel marked in red.
However, from a long-term perspective, HLU remains overall bullish, trading within the rising broadening wedge pattern.
The orange circle represents a massive rejection point, the intersection of three confluences, what I call a TRIO RETEST :
- The lower bound of the rising wedge pattern
- The lower bound of the falling channel, acting as an oversold zone
- The structure marked in blue
As HLU approaches the orange zone, we will be looking for trend-following longs.
For the bulls to confirm long-term control and kickstart the next big impulse upward, a break above the falling red channel is needed.
💡 Bigger Picture
Here’s why the fundamentals add fuel to the technical setup:
- A $2.7B uranium prize reclaimed for pennies: Homeland acquired a 35-million-pound U.S. uranium deposit for just $0.15/lb, material now worth nearly $80/lb.
- Trump’s Day-One energy orders: New executive actions prioritize U.S. nuclear power and domestic uranium production. Homeland controls a rare U.S.-based asset right as the policy tide shifts.
- AI is outgrowing the grid: Microsoft, Google, and Oracle are moving toward nuclear due to soaring power needs. Homeland owns the fuel they’ll need.
- National security tailwind: The U.S. imports 98% of its uranium. Russia banned exports. China is hoarding supply. Homeland’s American deposit is uniquely strategic.
📘 Bottom line
HLU is sitting at a key technical zone while the macro, political, and energy narratives align in its favor. If the TRIO retest holds, the next bullish impulse could unfold from a position of both structural and fundamental strength.
📌 Always do your own research and consult your financial advisor before investing.
📚 Stick to your trading plan, entry, risk management, and execution.
All strategies are good, if managed properly.
~ Richard Nasr

US500 - Oversold at Triple Confluence… Bounce Incoming?US500 is approaching a major oversold zone, where three powerful elements intersect at the same point:
• The lower bound of the falling red channel
• The blue long-term trendline
• The orange structure zone acting as demand
⚔️This alignment creates a strong confluence area, a spot where buyers usually step in to absorb selling pressure and trigger corrective moves.
As long as the index holds above this zone, we can expect the possibility of a bullish correction toward the upper trendlines. But if this area fails, the structure would weaken and open the door for deeper downside.
Right now, all eyes are on this confluence… will the US500 bounce from the oversold zone, or break through it? 🤔
⚠️ Disclaimer: This is not financial advice. Always do your own research and manage risk properly.
📚 Stick to your trading plan regarding entries, risk, and management.
Good luck! 🍀
All Strategies Are Good; If Managed Properly!
~Richard Nasr.

SPX500 ShortHello traders,
I am expecting the SPX500 to see a potential 20% correction. Current sentiment appears mixed while valuations remain elevated, which increases downside risk. This view also aligns with the technical setup:
On the weekly timeframe, price is respecting a well-defined channel.
On the daily timeframe, a double-top pattern has just formed, suggesting possible trend exhaustion.
Not financial advice, just sharing my market perspective.
