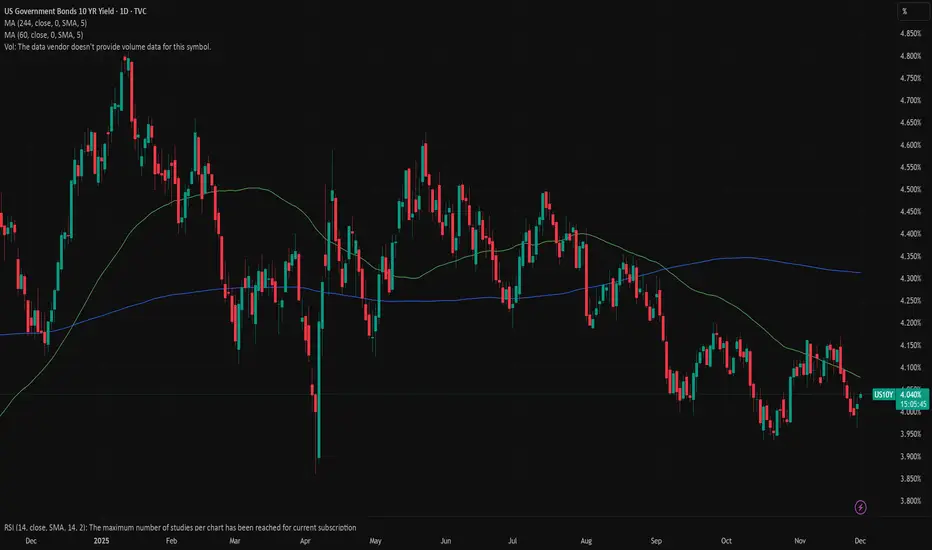
US 10Y TREASURY: Narrow trading ahead of HolidaysThe US job market, inflation data and University of Michigan inflation expectations were shaping investors sentiment on a Treasury bond market during the previous week. The jobs market remains relatively slow, with an increased unemployment rate to 4,6% in November. On the other hand, inflation in November stood at 2,7%, below market expectations. University of Michigan next year inflation expectations are further decreased. Investors were weightening whether this could be an indication of a potential further rate cut by the Fed in 2026?
The US 10Y Treasury benchmark reached the highest weekly level at 4,19%, but closed the week lower, at 4,15%. Still, the lowest weekly level was reached on Thursday, at 4,10%. The week ahead marks the start of the Holiday season in the Western markets. This is usually the period of the year where the volatility remains relatively low. In this sense, it could be expected that 10Y yields will continue to move in a relatively short range, probably between 4,18% and 4,12%. Note that US markets are closed on December 25th, so no trading on this day.
Us10y!

US 10Y TREASURY: Testing 4,2%The Fed decreased interest rates by 25 basis points as it was expected. The economic outlook remains modestly positive, with risks on both inflation and jobs. The Fed does not perceive that the inflation would return to targeted 2% during next year. That could be a short summary of the latest FOMC meeting, held last week. The 10Y Treasury benchmark yield traded higher, despite a short drop toward the 4,1%. Friday brought another shift back to 4,19%, after Chicago Federal reserve President Austan Goolsbee noted that the Fed should not lower interest rates further, after three cuts since September. This was not in alliance with market expectations, as investors are pricing at least two rate cuts during 2026.
The market is currently testing the 4,2% 10Y yields. It could be expected that this trend will continue also during the week ahead. On the other hand some modest relaxation in yields is also probable, but only till the level of 4,15%. At this moment, investors are trying to assess the course of monetary actions during next year, in which sense, some volatility might prevail.

10-Year Treasuries Into FOMC: What to Expect1. Big Picture: What’s Been Driving Bonds?
Over the past several months, the U.S. Treasury market has been defined by diverging forces across the curve, the short end (2Y, 5Y) pricing near-term monetary policy outcomes and the long end (10Y, 30Y) reflecting inflation persistence, fiscal supply, and long-horizon term premium.
The short end has behaved like a proxy for rate-cut expectations, compressing aggressively whenever inflation cools or recession probability ticks higher. Meanwhile, the long end has been more sensitive to duration demand, bond auctions, and forward-looking macro risk, often moving independently when supply shocks or inflation surprises hit the tape.
The result? A curve driven by two narratives: policy timing vs long-run risk.
This sets the stage for next week’s meeting and the reaction likely depends less on the cut itself and more on the messaging around rate trajectory.
2. What did the Market do?
Following the U.S.–China tariff escalation in April (formerly referred to casually as the “Trump Tariff War,” though a better description is the Tariff Re-Escalation Phase), the ZN stabilized. Buyers stepped in between May to July 2025, compressing price toward the 112'08'0 region, which is a key daily resistance zone.
In early September, momentum shifted. Buyers overwhelmed offers and lifted prices through 112'08'0, and the move appears linked to expectations of a softer policy stance and improving forward inflation indicators during the first week of September.
Sellers responded at 113'07'0 area and market has been trapped in a three-month range between 113'25'0 high and 112'08'0 low.
This week, price rotated from the top of range and swept through the composite LVN 113'00'0 to 112'24'0, near the 1st 3 weeks of November composite VPOC.
3. What to Expect: Scenarios Into FOMC Week
Until the rate decision, compression seems likely.
Expect 2 way indecision before FOMC:
Expect two-way trade between 113'03'0 (LVN) and 112'24'0 (1st 3 weeks of Nov composite VPOC) as the market waits for the FOMC.
Bearish Scenario (Base case):
If sellers hold at 113'03'0, continuation lower toward 112'07'0 (range low / composite VAL)
Bullish Scenario:
If buyers reclaim 113'03'0 decisively, possible market move back up to 113'23'0 (Daily Range high), keeping the multi-month balance intact and potentially positioning for a breakout if FOMC guidance surprises dovish.
4. FOMC Risk: What Could Surprise the Market?
The market is currently pricing ~88.6% probability of a 25bps cut which means the cut itself is not the event. The surprise lies in the tone.
🟢 Bullish Bond Reaction (Yields lower) if:
Forward guidance hints at a sequence of cuts, not a one-off
Growth risks emphasized > inflation risks
Dovish dissent or language suggesting easing bias remains intact
🔴 Bearish Bond Reaction (Yields higher) if:
The Fed downplays future cuts or signals higher-for-longer
Inflation risk is prioritized
Dot-plot or press Q&A implies only one cut on table
Conclusion
Unless the press conference delivers a clear dovish or hawkish surprise, expect a similar indecisive, two-way response in the markets, similar to past FOMC market reactions.
What’s your call on ZN and the bond markets going into the week of FOMC? Drop a comment and give a boost so more traders can weigh in.
Disclaimer: This is not financial advice. Analysis is for educational purposes only; trade your own plan and manage risk.

US 10Y TREASURY a 25bps cut – decision weekSeptember's PCE data came just a bit lower than anticipated. The data showed inflation at 2,8%, while the market was expecting a figure of 2,9%. Easing inflation heated market expectations that the Fed will cut interest rates by 25 basis points at their meeting on Wednesday, December 10th. Odds for a rate cut currently stand at 87%. The 10Y Treasury yields turned to the upside during the previous week, after testing support at 4,0%. The highest weekly level of 4,14% was reached at Friday's trading session.
The week ahead is the FOMC week. Fed Chair Powell is expected to address the public after the FOMC meeting. Markets will be able to hear the latest update on the state of the US economy, as perceived by Fed members. Thai is the time when market volatility significantly increases, as well as volatility in US Treasury yields. In this sense, the level of 4,16% might easily be the next target for 10Y yields. Also, some relaxation toward the 4,06% might also be possible.

US10Y - move downAt the end of October 2023, we finished the upward move and entered a correction phase.
The higher-level corrections are coming to an end, and in the medium term a deeper move downward is expected.
For a short period, we may still see some upside (or fluctuations) within the correction, but compared to the main move, it will be insignificant.
The reference level is around 2,770 .
---
Please subscribe and leave a comment.
You’ll get new information faster than anyone else.
Together, we’ll grow and become wealthier.
---

The Bond Markets Effect on the Stock MarketThe trend shown here is what helped me derisk prior to sustained market pullbacks seen during the Covid crash and in early 2022. When the 10Y rises sharply, the stock market usually pulls back in the days / weeks to follow. The major 10Y trend can be seen in my previous post which uses the blue lines shown here to show the large wedge that is forming. Right now we are bottoming on this wedge again and forming an upside down Head and Shoulder pattern. I believe we will have a Santa crash this year instead of a Santa rally if the 10Y breaks out of this pattern and continues to climb higher. AMEX:SPY TVC:US10Y FOREXCOM:SPX500 NASDAQ:NVDA NASDAQ:QQQ

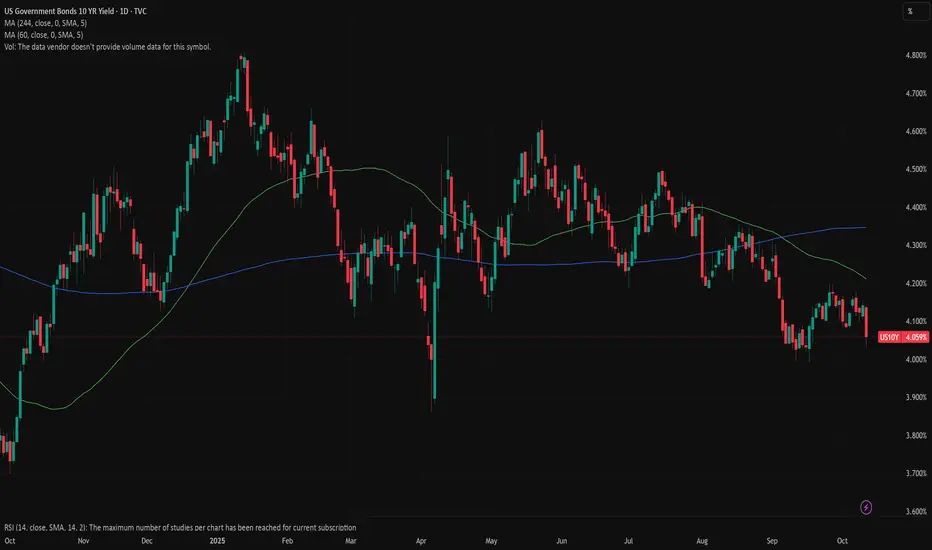
US 10Y TREASURY: aligning to a Feds cutWeaker inflation and economic output data increased investors sentiment of a potential Fed rate cut at December's FOMC meeting. The 10Y US Treasury benchmark yields reacted to these expectations, pushing yields further to the lower side. The 10Y yields started the week around 4,04%, but reached the lowest weekly level at Friday's trading session, at 3,96%. Still, they closed the week at 4,01%.
Although yields are holding around the 4%, still next Friday might bring some higher volatility, as September PCE data are set for a release. This indicator represents Fed's favourite inflation gauge, in which sense, the market might increase its nervousness, in case that posted figures are not in favour of Fed's 25 basis point cut. On the other hand, yields might continue to be in a “silent” mode, around 4%, prior to the FOMC meeting, scheduled in two weeks from now.
Rising 10_Yields Ahead?Here’s How It Could Hit BTC, Gold, StocksWhy the US 10-Year Yield Matters
The US 10-Year Treasury yield is one of the most important benchmarks in global finance. It reflects investor expectations for inflation, growth, and Federal Reserve policy. Because it influences everything from mortgage rates to equity valuations and the strength of the US dollar( TVC:DXY ), understanding its direction helps traders anticipate major market shifts.
Key Scenarios to Watch
1. Yield Rising (Bullish Yield / Bearish Bonds)
Signals stronger economic expectations or sticky inflation.
Usually pushes the USD higher and puts pressure on risk assets like tech stocks and crypto.
Markets begin pricing fewer rate cuts or even potential tightening.
2. Yield Falling (Bearish Yield / Bullish Bonds)
Indicates rising recession risk, softer inflation, or expectations of Fed rate cuts.
Supports equity markets and risk assets (including crypto).
Typically weakens the US dollar.
3. Sideways / Stable Range
Suggests economic uncertainty or balanced expectations.
Markets remain in consolidation until new macro data or Fed signals arrive.
Why Traders Follow It:
Small moves in the 10-year yield can shift global liquidity, risk sentiment, and currency flows — making it a core indicator for forecasting market direction.
Given the current data and signals, my short-term forecast is for yields to remain flat or move slightly higher, but the likelihood of a significant decline in the near term seems slim.
-----------------------------------------------------
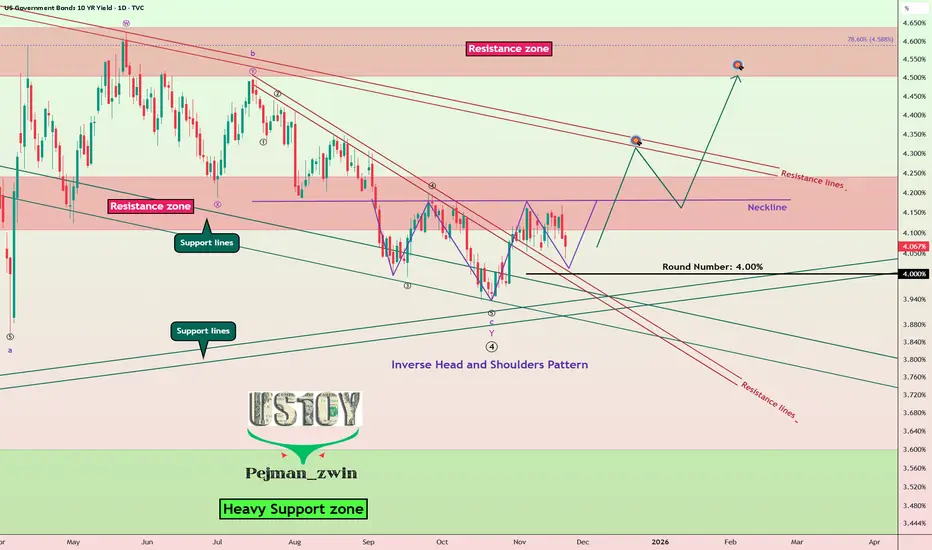
Now let's take a look at the US 10-Year Government Bond Yield chart on the daily time frame.
The US 10-Year Government Bond Yield is currently moving near the support lines and the 4.00% (Round Number).
In terms of classic technical analysis, we can expect that the US 10-Year Government Bond Yield's uptrend could start with an Inverse Head and Shoulders Pattern.
In terms of Elliott Wave theory, it appears that the US 10-Year Government Bond Yield has succeeded in completing the main wave 4 with a Double Three Correction(WXY).
I expect the US 10-Year Government Bond Yield to attack Resistance lines after breaking the Neckline and Resistance zone(4.24%-4.14%).
-----------------------------------------------------
Impact of a Rising US 10-Year Yield
•Bitcoin( BINANCE:BTCUSDT ):
A higher 10-year yield usually reduces liquidity and increases funding costs, which puts pressure on risk assets. BTC typically faces short-term downside or slower momentum when yields rise.
•Gold( OANDA:XAUUSD ):
Gold often moves inversely to yields. Rising yields increase the opportunity cost of holding gold, making it less attractive. This usually leads to weakness or consolidation in gold.
•Stocks (Equities):
Higher yields tighten financial conditions and lower valuations, especially for tech and growth stocks. Equities generally face selling pressure when yields rise sharply.
If you would like to see technical analysis on the weekly timeframe, I recommend you take a look at the link below.👇
-----------------------------------------------------
💡 Please respect each other's opinions and express agreement or disagreement politely.
📌US 10-Year Government Bond Yield Analyze ( TVC:US10 ), Daily time frame.
🛑 Always set a Stop Loss(SL) for every position you open.
✅ This is just my idea; I’d love to see your thoughts too!
🔥 If you find it helpful, please BOOST this post and share it with your friends.
US 10Y TREASURY: Holds tight rangeDuring the previous period markets were moving based on sentiment, considering that official macro data were not at disposal. The first data were posted during this week, showing relatively mixed signals for the jobs market. The NFP added 119K new jobs in September, surpassing market estimates of only 50K. On the other hand, the US unemployment rate has risen to 4,4% in September, from 4,3% previously. The 10Y benchmark yields were moving between 4,16% and 4,06%. Friday brought another push toward the 4,03% after New York Fed President John Williams commented on a possibility of a rate cut in December.
Markets continue to target the 4,0% support level for 10Y yields. This level will remain in focus during the week ahead. The PPI and PCE are scheduled to be released in the week ahead, which might bring some higher volatility. Also, November 27th is a holiday in the US, when markets will be closed. At this moment, charts are suggesting the higher probability of side trading in 10Y yields, again between 4,0% and 4,1% levels.

PRE-NY CONDITIONS Dollar is pressing into a major cross-asset high, recognized across FX, yields, and risk assets. London kept DXY inside a tight structure with no clean breakout, which turns this level into stop-time: the point where liquidity pauses and the market decides whether the move extends or fades.
Front-end yields remain firm, anchoring the Dollar’s support. The 10-year is indecisive, offering no confirmation and keeping the curve without a clear macro signal. ES holds its overnight gap on Nvidia strength, but volatility near 21 keeps risk fragile. Gold remains neutral, reflecting a balanced but uncertain safety tone into the U.S. session.
DXY: Testing a major high; range-bound after London; structure stretched but supported by 2Y strength.
US10Y: Indecisive daily structure; long end is not confirming Dollar strength; macro tone remains unclear.
US2Y: Firm short-end repricing; maintains policy pressure and supports Dollar tone.
ES: Holding gap; risk appetite supported but shallow; volatility still limiting follow-through.
Gold: Neutral safety tone; neither attracting nor rejecting flows; reflects cross-asset indecision.
VIX: Near 21; elevated volatility keeps conditions reactive and reduces trend reliability.
Cross-asset alignment remains mixed. The Dollar is firm, but only the front end confirms it. Long-end yields hesitate. ES shows controlled appetite, but volatility denies conviction. Gold confirms the indecision. Liquidity conditions lean cautious, shaped more by bond market signals than by clean macro drivers.
Pillar Focus: PEM — Confirmation Entries
Today's environment aligns with PEM logic. A stretched Dollar at a major level, split yields, and elevated volatility mean operators should rely on confirmation-based triggers, shorter engagements, and strict timing. High-frequency windows (NY open → 10:00 → London fix) carry more clarity than directional assumptions.
Follow higher-timeframe direction
Ignore noise from earlier sessions
Wait for structure + flow alignment
Act only on confirmation
Summary: NY opens into a cautious environment defined by a stretched Dollar, mixed yields, and elevated volatility — a clear PEM day.
— CORE5DAN
Institutional Logic. Modern Technology. Real Freedom.

TRADINGVIEW — NY SESSION UPDATELondon pushed the Dollar into 99.591, but DXY remains inside yesterday’s structure.
Compression unchanged.
Yields softer into NY — 10Y −1.11%, 2Y −1.27% — defensive tone with no directional commitment.
ES reclaimed the 6655.50 London low and trades back inside its range.
Gold steady above 4019.57.
Volatility stable.
NY opens into a tight Dollar and softer yields.
First expansion sets the tone.
— CORE5DAN
Institutional Logic. Modern Technology. Real Freedom.

PRE-LONDON CONDITIONS — DXY Range-Bound, Yields Slide, ES HeavyU.S. Dollar Index (DXY) holds a tight 98.99–99.59 range in a third consecutive inside bar.
U.S. 10-year yield drops ~1.01% in Asia.
U.S. 2-year yield falls ~1.27%.
S&P 500 futures (ES) extend lower toward the 6.571 fractal.
Gold tests support after filling imbalance.
Volatility remains elevated.
DXY — Dollar Index
Dollar stays inside 98.991–99.591.
Inside-bar stack remains unbroken.
Price sits near the 0.6 premium zone.
Neutral until London breaks the range.
Yields — 10Y & 2Y
10Y yield: -1.01% in Asia → long-end compression.
2Y yield: -1.27% → dovish policy tone.
Curve: both ends lower → risk-off positioning.
ES — S&P 500 Futures
ES moves lower toward 6.571.
Yesterday’s high-volatility expansion continues.
Tone remains defensive.
Gold — Safety Premium
Gold fills imbalance and presses into support.
Break = active safety flows.
Hold = passive bid.
Volatility
VIX closed pre-London.
Futures hold elevated regime.
Conditions favor fast intraday expansions.
Calendar Risk
Medium-tier data ahead.
Yesterday’s partial data production repeats → limited visibility.
Expect flow-driven moves until major prints arrive.
Execution View
DXY bias neutral inside range.
Yields down + ES down = risk-off.
Gold support = key inflection.
London expansion outside 98.99–99.59 sets direction.
Trade second move, not first spike.
Summary:
Dollar trapped. Yields lower. ES heavy. Gold at support.
Fragile pre-London environment; London’s first expansion defines the session.
— CORE5DAN
Institutional Logic. Modern Technology. Real Freedom.

US 10Y TREASURY: Fed might (not) cut in DecemberThe US Treasuries were moving in a swing manner during the previous week. The 10Y US benchmark reached the lowest weekly level at 4,05%, but ended the week at 4,18%. The US Government ended its longest “shutdown” in history, however, there is some indication that the macro data for the “shutdown” period will probably not be released. Investors are attempting to assess the health of the US economy amid a lack of fresh data and uncertainty about policy direction. The pause in key statistics has left markets navigating with less clarity about growth and inflation prospects. As per CME FedWatch Tool there is currently around 50% chance that the Fed will cut rates in December.
Uncertainty is still a key word which will drive the market sentiment in the week ahead. As per current charts, there is some probability that the yields might test the 4,18% level one more time. On the opposite side, modest easing in yields, might revert them toward levels slightly below the 4,1% level.

PRE-LONDON CONDITIONS — 17 Nov 2025I. Market Environment
Dollar: Neutral overnight. No directional pressure in Asia.
Yields: US10Y and US2Y stable — policy expectations unchanged.
Risk: Equities firm but stretched. Volatility elevated from Friday.
Focus: Light session before a heavy macro week.
Liquidity: Cautious, headline-sensitive.
II. Six-Chart Snapshot
(All structural notes shown on your chart image — not repeated in text.)
III. Cross-Asset Signals
Yields keep the Dollar capped.
Equities supported but fragile.
Gold softer despite elevated volatility.
Flows lean cautious.
Global risk = neutral-to-defensive.
IV. Core Drivers
• Dollar behavior inside a neutral environment
• Yield stability across the curve
• Equity sensitivity with elevated volatility
• London open → London fix → U.S. session flow
V. Execution Notes — PEM Logic
Follow higher-timeframe direction
Ignore early-session noise
Wait for structure + flow alignment
Act only on confirmation
Summary
Neutral Dollar, stretched risk, elevated volatility — London opens in a cautious, event-driven environment.
— CORE5DAN
Institutional Logic. Modern Technology. Real Freedom.

Gold Fires Back: Daily Reversal with Macro Wind at Its Back
Let’s read this board step by step, then I’ll give you the gold outlook 👇
⸻
1️⃣ US02Y (2-year Treasuries) – top left
• Timeframe: Daily (1D)
• Yield is around 3.60% (shown 3.608%) and slightly down today (-0.19%).
• Price is still close to the recent high, and the red dotted line = resistance / overbought zone.
👉 Meaning:
• The Fed is still in “high rates” mode,
• but this small drop in yield shows a bit of relief, so the pressure from bond yields on gold has eased a little but hasn’t disappeared.
⸻
2️⃣ US10Y (10-year Treasuries) – top right
• Yield is around 4.15%, also down today (-0.24%).
• Still close to recent highs, just under a red dotted line (resistance).
👉 Meaning:
• Long-term yields are still high, but we see a small downward breathing move.
• If that continues, it helps gold, because the “opportunity cost” of holding gold decreases.
⸻
3️⃣ DXY (US Dollar Index) – bottom right
• Timeframe: Daily.
• Recent high is around 100.36.
• Current price is about 99.27 with a daily gain of +1.61%, but the chart clearly shows a short-term downtrend from the 100.36 top, drifting lower.
👉 Meaning:
• The dollar is still strong in absolute terms,
• but it is losing upside momentum above 100.
• If the DXY continues to drop, that is usually positive for gold.
⸻
4️⃣ XAUUSD (Gold) – bottom left
• Timeframe: Daily (1D).
• Today we have a strong bullish candle:
• Current price is around 4,080.
• Daily change +5.76% → an explosive day (short squeeze + aggressive buying).
• Today’s low: around 3,819; high: around 4,381 → a very wide candle.
• Volume: 1.68M vs Volume MA 1.17M → volume well above average → this move is not random; it’s a “big money” move.
• Red dotted line around 4,080 → a key level / previous fair value, and price is now at or slightly above it.
⸻
Reading the full picture (Macro + Gold)
1️⃣ 2Y & 10Y yields
• Still at elevated levels → in principle, that’s not great for gold,
• But today’s drop in both yields tells us the market is cooling rate-hike expectations a bit → this becomes a supportive factor for gold if it continues.
2️⃣ Dollar (DXY)
• Topped around 100.36, then started to calm down and pull back, even though today’s candle is green (+1.61%).
• The bigger story: short-term downtrend from the top → tilts in favor of gold if the downside continues.
3️⃣ Gold (XAUUSD) itself
• It went through a correction in late October / early November,
• Then today you’ve got an explosive bullish candle with strong volume that pushed price back above the key level (red line).
• This is typically the shape of a powerful reversal bar inside a larger uptrend (higher low + higher high).
⸻
Gold outlook from this chart (educational only) 🧭
✅ Bullish scenario (upside bias)
As long as gold:
• Closes daily above the 4,000–4,050 zone (around the red dotted line),
→ we can say there is a re-claim of that zone after it acted as resistance / pressure.
What we might see:
• Retest of the 4,000–4,050 area as support,
• Then another push up toward 4,250–4,380 (roughly the top of the current candle / a higher supply zone).
This scenario gets stronger if:
• US02Y and US10Y keep drifting lower,
• DXY continues down below 99 again.
⸻
⚠️ Bearish scenario (another correction)
If gold:
• Closes back below 4,000 on the daily chart,
• And at the same time:
• Bond yields break to new highs again,
• DXY moves back above 100.36,
→ then today’s candle would likely be just a temporary short squeeze, and we could revisit the 3,880–3,820 area as support / re-accumulation zone.
⸻
One-sentence summary
The chart says:
Gold has printed a strong bullish reversal on the daily with big volume, in a macro environment that’s still not perfect but starting to ease (yields ticking down a bit and the dollar losing strength above 100).
If it holds above 4,000–4,050, the outlook is tilted to the upside, with potential toward 4,250–4,380 in the short term.
A break back below 4,000 would favor a return of the correction toward 3,880–3,820.
(All of this is educational chart analysis only, not a buy or sell recommendation.)

US10YThe market still can't figure out what to make of COVID. Continuing to coin in this 3 year long consolidation phase.
US 10Y TREASURY: The 4% expected to holdWith the U.S. government shutdown limiting official data, investors are turning to alternative economic indicators to gauge the economy. A University of Michigan survey on Friday showed consumer sentiment fell to 50.3 in November, well below the expected 53.0 and near historic lows. Concerns deepened after Challenger, Gray & Christmas reported October job cuts surged to 153,074, triple September’s figure and the highest for any October since 2003. In the environment of economic data blackout, it is very hard for investors to estimate the state of the US economy.
The 10Y US benchmark yields increased during the week to the level of 4,16% on Wednesday and Thursday, however, pulled back on Friday to the closing level of 4,09%. Softer private-sector job data boosted expectations of a Federal Reserve rate cut in December, which now assigns roughly a 67% probability. Considering a “blindfolded” situation with the U.S. macro data, it could be expected for 10Y Treasury yields to hold around the 4% level also in the week ahead.

US 10Y TREASURY: 4% remains in focusThe most important event during the previous week was the FOMC meeting, held on Wednesday, where the Fed decided to cut interest rates by another 25 basis points. Although the market was expecting that another rate cut is coming in December, still, comments from Fed Chair Powell, that such a course of action might not be in the store, set investors to re-positioning. The 10Y US benchmark yields strongly reacted to Powell's comment, bringing yields back toward the 4,1%. The lowest weekly yield levels were at $3,97% prior to the FOMC meeting.
Considering a strong shift in 10Y yields, it could be expected some relaxation in the week ahead. Still, a stronger move should not be expected. As per current charts, there is a higher probability that the 4% level could be tested for one more time. There is a lower probability for a further move toward the upside in the week ahead, but some volatility around the 4,1% might be expected.

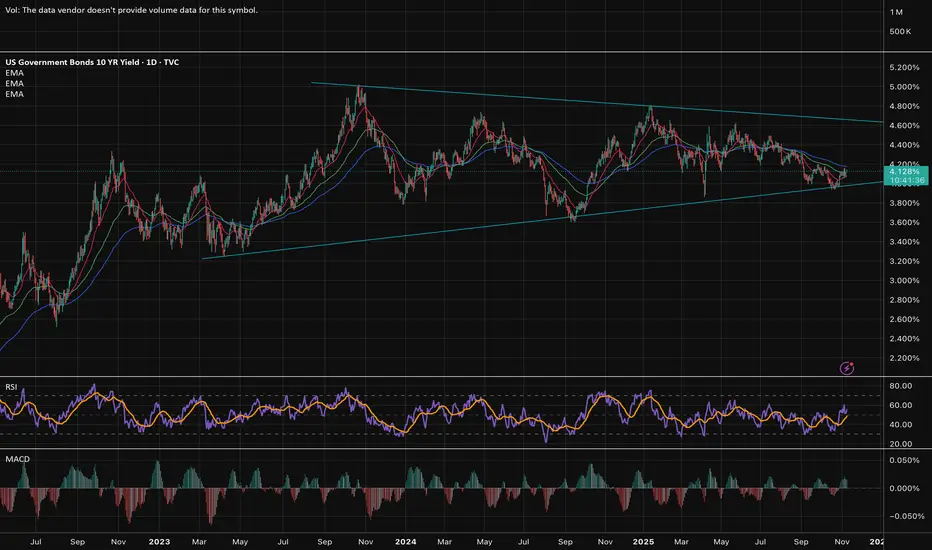
US10Y This break-out can be the next Buy Signal.The U.S. Government Bonds 10YR Yield (US10Y) has been trading within a long-term Triangle pattern and more recently since May 22 2025 it has found itself declining inside a Channel Down.
This Bearish Leg (Channel Down) almost hit the bottom of the Triangle and has been rebounding in the past 10 days. As long as the 1W MA200 (orange trend-line) holds (right now almost at the bottom of the Triangle), the probabilities of a rebound and new Bullish Leg remain strong.
The confirmation for such Bullish Leg will come after the price closes a 1D candle above the 1D MA50 (blue trend-line). If it does, we an expect the price to rise to at least the 0.786 Fibonacci retracement level (Target 4.475%), which has happened all times (3) inside this Triangle after a Bearish Leg bottomed.
-------------------------------------------------------------------------------
** Please LIKE 👍, FOLLOW ✅, SHARE 🙌 and COMMENT ✍ if you enjoy this idea! Also share your ideas and charts in the comments section below! This is best way to keep it relevant, support us, keep the content here free and allow the idea to reach as many people as possible. **
-------------------------------------------------------------------------------
💸💸💸💸💸💸
👇 👇 👇 👇 👇 👇

US 10Y TREASURY: Will the Fed cut?Regardless of a relative volatility between levels of 4,02% and 3,94%, the 10Y US Treasury yields managed to sustain the 4% level during the previous week. The markets were mostly focused on US inflation data which were posted on Friday. The figures show that the inflation currently manages to sustain relatively lower levels, although still elevated from Fed's target of 2% y/y. The inflation in September was standing at 0,3% for the month and 3% y/y. Stable inflation and weakening jobs market have increased odds among investors that the Fed will cut interest rates by 25 bps at their meeting on October 29th.
The major event during the week ahead will be the FOMC meeting. Usually, market nervousness increases prior to the meeting, in which sense, such a behaviour could be expected also this time. There is some probability that yields could seek a bit higher levels in the week ahead, somewhere between 4,04% or 4,08%, but generally, the 4% should continue to hold.

US 10Y TREASURY: Treasury market holds the line? Unlike US equities, crypto or gold markets, the US Treasury yields were relatively keeping their grounds during the previous week. Still, some concerns regarding the potential impact of US-China tariffs were at least for now resolved when the US President commented on social networks that they are not sustainable. The US Government is still in official status of “shutdown” so relevant macro data are lacking. At the same time, a new potential banking crisis was emerging in the news, through so-called NDFI (Non-deposit Financial Institutions) companies, raising concerns over potential spill-over effect.
The level of 4,0% has been tested during the week, with some swings around this level. The week started at 4,07%, but the lowest level reached was at 3,93%. However, at Friday's trading session, yields were back to the level of 4,0%, where they are closing the week. There is a lot of uncertainty currently shaping the market sentiment. In this sense, some higher volatility might be possible also during the week ahead. Charts are showing that the path toward the 3,9% is currently open, but only if the level 4,0% does not sustain the buying pressure. Still, what is unclear is what could be the catalyst for the 3,9% level?

US 10Y TREASURY: tariff shock sends yields lowerTreasury yields dropped further as markets reacted to the sudden escalation in U.S.–China trade tensions, after U.S. President’s announcement of a 100 % tariff on Chinese imports. The move deepened fears of economic disruption and amplified uncertainty around trade policy. This came in addition to already increased uncertainty considering that the U.S. Government is already 10 days in the state of “shutdown”. The U.S. benchmark 10Y bond yields dropped from the level of 4,15% down to 4,03%. They are ending the week at 4,05%.
The week ahead will be driven by fundamentals. It is expected that new information will be released by the US Government regarding announced trade tariffs. This will most certainly impose a higher market volatility. As per current charts there are two options for 10Y yields: on one side, some relaxation could bring yields back to levels above the 4,10%, while on the other hand, the level of 4,0% is missing testing.
US 10Y TREASURY: Shutdown fuels rate-cut speculationThe US Treasury bond market was focused on the US government “shutdown” during the previous week, estimating the implication which this shutdown could have on the macro segment on the US economy. The 10-year Treasury yield rose slightly to 4.154%, but reverted back as of the end of the week toward the 4,08%. Yields are closing the week at 4,119%.
The shutdown, which began on October 1, resulted from a failure by lawmakers to agree on a temporary spending bill. This impasse has led to the suspension of most government economic data releases, including the September jobs report, heightening uncertainty in the markets. Investors are particularly concerned about the potential impact on the Federal Reserve's upcoming policy decisions, as the lack of updated labor market data may influence the central bank's approach to interest rates.
Despite these challenges, markets are closely monitoring the situation, with expectations that the Federal Reserve may consider easing monetary policy if the shutdown persists and economic indicators weaken. The evolving political landscape and its effects on fiscal policy continue to be key factors influencing investor sentiment and Treasury yields.
