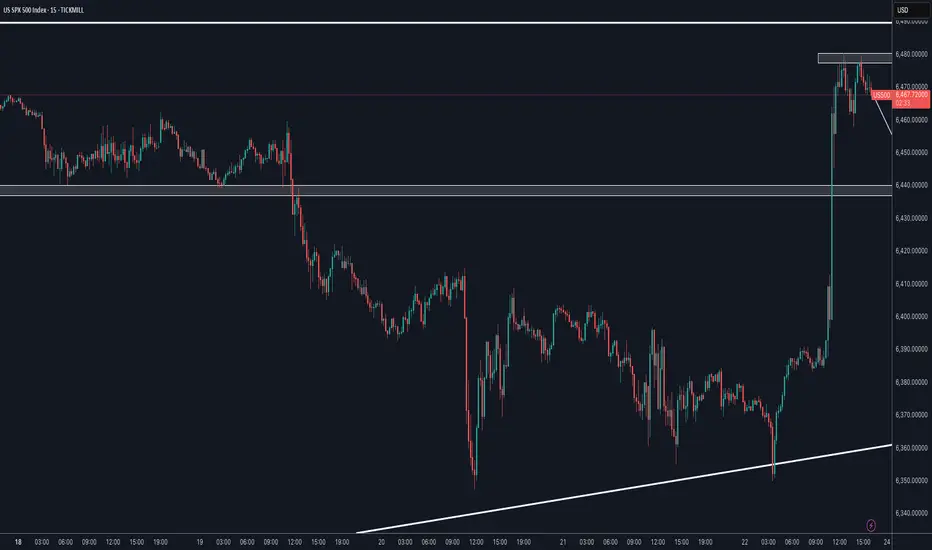
S&P500 at Resistance: Nvidia Earnings Could Decide the Next Move📊 US500 (S&P 500) has rallied recently 📈, but it’s still struggling to break through the current highs 🔼🧱.
💡 I believe the next move could hinge heavily on Nvidia’s earnings report tomorrow 🖥️💵.
👉 If the report is positive, watch for a break and retest above the current range to position long 🚀.
👉 If the report is negative, we could see the broader stock market sell off 📉.
⚠️ This is for educational purposes only and not financial advice 📚🔒
Us500

S&P500 3-month Channel Up still valid. Buy.The S&P500 index (SPX) kept its 3-month Channel Up intact last week despite a short-term correction as the price stopped exactly on its bottom (Higher Lows trend-line) and following Chair Powell's remarks on rate cut possibilities, it rebounded aggressively.
Given also that the 1D MA50 (blue trend-line) has been its long-term Support since May 01, the stage is set for the pattern's new Bullish Leg. With the last one being +8.80%, we expect the index to hit at least 6750 next.
-------------------------------------------------------------------------------
** Please LIKE 👍, FOLLOW ✅, SHARE 🙌 and COMMENT ✍ if you enjoy this idea! Also share your ideas and charts in the comments section below! This is best way to keep it relevant, support us, keep the content here free and allow the idea to reach as many people as possible. **
-------------------------------------------------------------------------------
Disclosure: I am part of Trade Nation's Influencer program and receive a monthly fee for using their TradingView charts in my analysis.
💸💸💸💸💸💸
👇 👇 👇 👇 👇 👇

S&P 500 Fed independence concerns + tariff threatsFed/Political Risk: Trump announced the dismissal of Fed Governor Cook, citing mortgage-related allegations. Markets saw this as a fresh escalation of political pressure on the Fed. The dollar initially dropped (-0.4%) before recovering, while gold held a +1% gain. Treasuries steepened sharply (2s30s at steepest since Jan 2022), highlighting rising risk premia around Fed independence. This adds uncertainty for monetary policy credibility, a potential headwind for US equities.
Tariffs/Tech Risk: Trump threatened new tariffs and export restrictions on advanced technology in retaliation for digital services taxes. This raises headline risk for US megacaps, particularly tech, and could weigh on Nasdaq sentiment.
Geopolitics (France): US–France tensions escalated after comments from Ambassador Kushner, coinciding with France’s plan to recognize a Palestinian state. While not directly market-moving, it reinforces geopolitical overhangs that could spill into risk sentiment.
Market Impact:
Futures: S&P 500 (-0.14%), Nasdaq (-0.18%) modestly lower.
Rates: Steepening curve adds pressure to longer-duration equities.
Risk Tone: Elevated political/geopolitical noise may cap near-term upside.
For S&P 500 traders: Fed independence concerns + tariff threats = watch for tech underperformance and a potential pickup in volatility around US political headlines.
Key Support and Resistance Levels
Resistance Level 1: 6516
Resistance Level 2: 6540
Resistance Level 3: 6565
Support Level 1: 6380
Support Level 2: 6360
Support Level 3: 6340
This communication is for informational purposes only and should not be viewed as any form of recommendation as to a particular course of action or as investment advice. It is not intended as an offer or solicitation for the purchase or sale of any financial instrument or as an official confirmation of any transaction. Opinions, estimates and assumptions expressed herein are made as of the date of this communication and are subject to change without notice. This communication has been prepared based upon information, including market prices, data and other information, believed to be reliable; however, Trade Nation does not warrant its completeness or accuracy. All market prices and market data contained in or attached to this communication are indicative and subject to change without notice.

US500 at All-Time High – Pullback or Breakout Ahead?The US500 has reached the All-Time High (ATH) zone after a strong bullish leg.
We are now at a key decision point: will the price correct lower to gather strength, or break out and extend the rally?
📊 Scenario 1 – Pullback before breakout
Possible rejection at the ATH with a correction toward the 6440–6460 support/resistance zone.
If buyers defend this area, it could provide a solid long entry opportunity.
📊 Scenario 2 – Direct breakout
A clean breakout above 6480–6500 with strong volume could trigger another bullish wave.
Waiting for confirmation is crucial to avoid a false breakout.
⚖️ Conclusion
The broader trend remains bullish (H4 uptrend line intact). The most likely path is a continued move higher, potentially after a short pullback to relieve buying pressure.
👉 This is an educational analysis only, not financial advice.
S&P dip buying opportunity supported at 6340US equities staged a sharp intraday rebound, with the S&P 500 recovering from losses of over -1% to close down just -0.24%. Tech remained under pressure (NASDAQ -0.67%, Mag-7 -1.11%), weighed by reports questioning the near-term profitability of AI adoption, though DB research stressed that productivity gains are still likely longer term. Gains in energy (+0.86%) and other cyclical sectors helped offset the tech weakness as Brent crude rose +1.6% to $66.84/bbl. Geopolitical headlines around Ukraine and potential security arrangements kept risk sentiment cautious.
Conclusion: Despite renewed tech volatility, the S&P’s resilience and sectoral rotation suggest dip-buying interest remains intact, but with near-term upside likely capped until tech stabilises.
Key Support and Resistance Levels
Resistance Level 1: 6433
Resistance Level 2: 6466
Resistance Level 3: 6500
Support Level 1: 6340
Support Level 2: 6310
Support Level 3: 6280
This communication is for informational purposes only and should not be viewed as any form of recommendation as to a particular course of action or as investment advice. It is not intended as an offer or solicitation for the purchase or sale of any financial instrument or as an official confirmation of any transaction. Opinions, estimates and assumptions expressed herein are made as of the date of this communication and are subject to change without notice. This communication has been prepared based upon information, including market prices, data and other information, believed to be reliable; however, Trade Nation does not warrant its completeness or accuracy. All market prices and market data contained in or attached to this communication are indicative and subject to change without notice.

Bullish bounce off?S&P500 (US500) has bounced off the pivot, which aligns with the 50% Fibonacci retracement, and could potentially rise to the 1st resistance.
Pivot: 6,346.35
1st Support: 6,296.98
1st Resistance: 6,435.90
Risk Warning:
Trading Forex and CFDs carries a high level of risk to your capital and you should only trade with money you can afford to lose. Trading Forex and CFDs may not be suitable for all investors, so please ensure that you fully understand the risks involved and seek independent advice if necessary.
Disclaimer:
The above opinions given constitute general market commentary, and do not constitute the opinion or advice of IC Markets or any form of personal or investment advice.
Any opinions, news, research, analyses, prices, other information, or links to third-party sites contained on this website are provided on an "as-is" basis, are intended only to be informative, is not an advice nor a recommendation, nor research, or a record of our trading prices, or an offer of, or solicitation for a transaction in any financial instrument and thus should not be treated as such. The information provided does not involve any specific investment objectives, financial situation and needs of any specific person who may receive it. Please be aware, that past performance is not a reliable indicator of future performance and/or results. Past Performance or Forward-looking scenarios based upon the reasonable beliefs of the third-party provider are not a guarantee of future performance. Actual results may differ materially from those anticipated in forward-looking or past performance statements. IC Markets makes no representation or warranty and assumes no liability as to the accuracy or completeness of the information provided, nor any loss arising from any investment based on a recommendation, forecast or any information supplied by any third-party.

US500: Bulls Pause as Pullback Risks GrowUS500 has been riding an impressive uptrend, with buyers pushing the index to fresh highs above 6,440, but the recent stalling near resistance suggests that momentum may be losing steam. With growth concerns, central bank caution, and a round of key economic data on deck, the risk of a corrective pullback is building. This setup highlights the importance of watching whether support levels hold or if sellers gain the upper hand.
Current Bias
Bearish (Short Term) – While the broader trend remains bullish, near-term technicals and macro uncertainty point toward a corrective pullback.
Key Fundamental Drivers
US Earnings Season: Mixed corporate earnings, with strength in tech offset by weakness in cyclicals.
Fed Policy: Markets are still weighing timing of potential rate cuts, but sticky inflation data and cautious Fed commentary keep rates elevated.
Bond Yields: US yields remain relatively high, pressuring equities when safe-haven flows emerge.
Macro Context
Interest Rates: The Fed is in a “wait-and-see” mode, balancing sticky services inflation against slowing growth. Rate cuts are still priced for later this year, but not aggressively.
Economic Growth: US economy shows signs of slowing, with softer retail sales and housing data, though labor markets remain resilient.
Commodities/Flows: Energy costs are stabilizing, but higher oil prices in recent weeks could add inflationary pressure.
Geopolitics: Trade tensions, tariffs, and Middle East instability add layers of risk, supporting defensive positioning.
Primary Risk to the Trend
A surprise dovish shift from the Fed or stronger-than-expected US earnings could quickly reignite bullish momentum and push US500 higher, invalidating the pullback scenario.
Most Critical Upcoming News/Event
FOMC Minutes & Powell Speeches – Markets will look for clarity on rate cut timing.
US CPI & PPI Data – Any upside surprises could weigh heavily on equities.
Leader/Lagger Dynamics
The US500 is a leader, often dictating global equity sentiment. Movements in US500 ripple into NASDAQ, DAX, FTSE, and risk-sensitive FX pairs such as AUD/JPY. Its role as a global risk benchmark makes it highly influential.
Key Levels
Support Levels: 6,370, 6,231, 5,920
Resistance Levels: 6,447 (recent high), 6,500 psychological barrier
Stop Loss (SL): 6,480 (above recent highs)
Take Profit (TP):
TP1: 6,370
TP2: 6,231
TP3: 5,920
Summary: Bias and Watchpoints
US500 bias is shifting to neutral-to-bearish, with the index showing signs of fatigue at highs around 6,440–6,450. A pullback toward 6,370 → 6,231 is possible, with 5,920 as an extended target if risk sentiment deteriorates. A protective stop at 6,480 is key in case bulls regain momentum. Traders should keep a close eye on Fed communication and US inflation data, as these remain the most powerful catalysts for near-term direction. With the US500 acting as a leader for global equities, its moves will likely shape broader market sentiment across stocks, indices, and even risk-sensitive currencies.

S&P500: Losing Momentum !I see the rally comes to end, the recent upside move has no momentum. The stocks need a new catalysts to continue, but I do not think this to happen. I suggest that US500 to go down in the next 30 days or so.
Disclaimer: This content is NOT a financial advise, it is for educational purpose only.

S&P500 Can the 4H MA50 save the day again?The S&P500 index (SPX) is on a short-term pull-back following the new All Time High (ATH) on August 15 of the 3-month Channel Up. It is just above the 4H MA50 (blue trend-line), which has been the most common level of Support throughout this pattern, before the 4H MA200 (orange trend-line), which formed its last Higher Low.
As a result, as long as it holds, it is more likely to see a continuation of the Bullish Leg that started on the 4H MA200 bounce (August 01). The previous Bullish Leg peaked on a +8.80% rise, so that gives us a medium-term Target of 6750.
-------------------------------------------------------------------------------
** Please LIKE 👍, FOLLOW ✅, SHARE 🙌 and COMMENT ✍ if you enjoy this idea! Also share your ideas and charts in the comments section below! This is best way to keep it relevant, support us, keep the content here free and allow the idea to reach as many people as possible. **
-------------------------------------------------------------------------------
Disclosure: I am part of Trade Nation's Influencer program and receive a monthly fee for using their TradingView charts in my analysis.
💸💸💸💸💸💸
👇 👇 👇 👇 👇 👇

S&P500 sideways consolidation resistance at 6520Summary:
The S&P 500 (-0.01%) slipped for a second consecutive session, dragged by weakness in tech.
The Magnificent 7 (-0.16%) edged lower, with Intel (-3.66%) among the worst performers on reports of a potential 10% US government stake, partly offset by news that SoftBank will buy $2bn in Intel shares.
Broader sentiment was weighed down by a hawkish rates re-pricing and a weaker-than-expected NAHB housing market index (32 vs. 34 expected).
There were some bright spots: the Russell 2000 (+0.35%) outperformed, and Europe’s STOXX 600 (+0.08%) inched up to a 3-month high.
Geopolitics remained in focus as Trump pushed for a summit between Putin and Zelenskiy, with US and EU officials moving on security guarantees for Ukraine.
Conclusion for S&P 500 trading:
The index remains under mild pressure, reflecting rate concerns and housing weakness, while Intel headlines added volatility to tech. Broader market resilience—highlighted by small-cap outperformance—suggests downside is limited in the near term, but the S&P 500 may stay range-bound until clearer signals emerge on rates and housing momentum.
Key Support and Resistance Levels
Resistance Level 1: 6520
Resistance Level 2: 6580
Resistance Level 3: 6637
Support Level 1: 6400
Support Level 2: 6372
Support Level 3: 6340
This communication is for informational purposes only and should not be viewed as any form of recommendation as to a particular course of action or as investment advice. It is not intended as an offer or solicitation for the purchase or sale of any financial instrument or as an official confirmation of any transaction. Opinions, estimates and assumptions expressed herein are made as of the date of this communication and are subject to change without notice. This communication has been prepared based upon information, including market prices, data and other information, believed to be reliable; however, Trade Nation does not warrant its completeness or accuracy. All market prices and market data contained in or attached to this communication are indicative and subject to change without notice.

Nasdaq100, DJIA & S&P500 - Quick technical analysisThe top three US indices are near their all-time highs. Will we see new all-time highs?
Let's take a look.
MARKETSCOM:US100
MARKETSCOM:US30
MARKETSCOM:US500
Let us know what you think in the comments below.
Thank you.
75.2% of retail investor accounts lose money when trading CFDs with this provider. You should consider whether you understand how CFDs work and whether you can afford to take the high risk of losing your money. Past performance is not necessarily indicative of future results. The value of investments may fall as well as rise and the investor may not get back the amount initially invested. This content is not intended for nor applicable to residents of the UK. Cryptocurrency CFDs and spread bets are restricted in the UK for all retail clients.

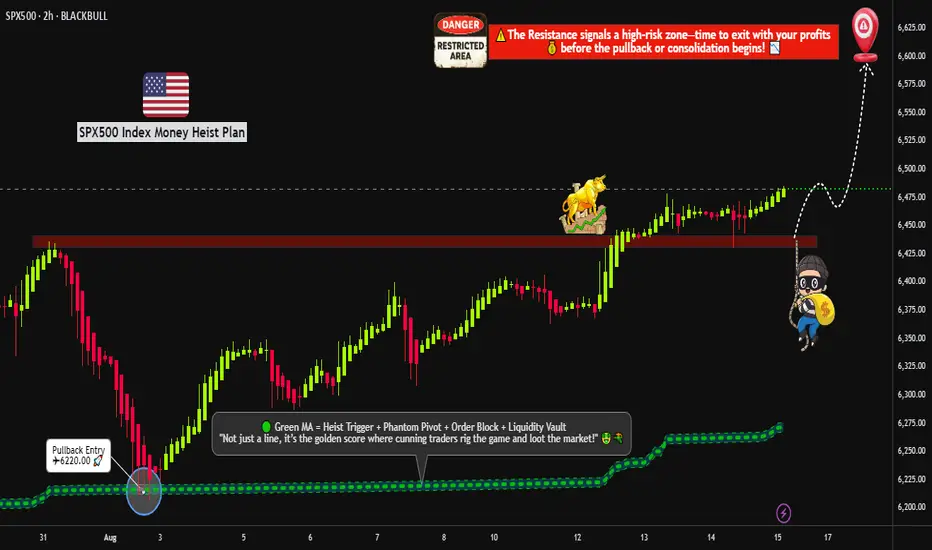
"US500 BREAKOUT – TIME TO LOAD LIMIT ORDERS FOR THE PUMP?"🔥🦹♂️ "SPX500 BANK HEIST – LAYERED BULL RAID IN PROGRESS!" 💰📈
(Thief Trader’s Multi-Limit Order Bullish Ambush – No Weak Hands Allowed)
📍 ASSET: US500 / SPX500 (S&P 500 INDEX)
🎯 HEIST PLAN: BULLISH BREAKOUT
💣 ENTRY: ANY PRICE LEVEL (Thieves use Layered Limit Orders – adapt like a pro!)
🔫 SAMPLE LAYERS: (Scale in like a boss!)
BUY LIMIT LAYER 1: 6475.00
BUY LIMIT LAYER 2: 6460.00
BUY LIMIT LAYER 3: 6440.00
(Add more layers if needed – flexibility is key!)
🛑 STOP LOSS: 6400.00 (Thief’s Emergency Exit – adjust based on your risk!)
🎯 TARGET: 6600.00 (First profit zone – trail or take gains!)
🦹♂️ THIEF TRADER’S MASTER PLAN:
"We don’t ask for permission – we take profits."
🔹 ENTRY TACTICS:
Use multiple limit orders (LAYERED STRATEGY) – like planting timed explosives at key levels.
No panic entries – thieves strike with precision, not emotion.
DCA if needed – but keep bullets for the real move.
🔹 STOP LOSS RULES:
6400 = Danger Zone – if price breaks, abort mission & regroup.
SL too tight? You’ll get stopped out by market noise. SL too wide? You’ll bleed. Find balance.
🔹 TAKE PROFIT STRATEGY:
First TP @ 6600 – secure partial profits.
Let runners ride with trailing stop – or full exit if momentum fades.
🚨 THIEF’S GOLDEN RULES:
✅ Only LONG – no revenge shorts, no greed traps.
✅ Trade in SILENCE – avoid high-impact news (CPI, NFP, Fed).
✅ Risk management = Survival – don’t blow your account on one play.
✅ BOOST & SHARE – if this plan helps, spread the word!
📢 FINAL WARNING:
"This is not financial advice – it’s a thief’s blueprint.
Plan your escape before entry. Market heists require discipline."
💬 COMMENT "ROBBING SPX" if you’re in!
🔥 LIKE & BOOST if you ride with the Thief Trader crew!
🦹♂️ THIEF TRADER OUT.
💸 STEAL SMART. GET RICH. REPEAT.
S&P500 bullish on rate cut betsS&P 500 hits new high on rate cut bets – The index rose +0.32% to another record as markets priced in further Fed easing. Gains were broad-based, with 421 constituents higher, while small-caps outperformed sharply (Russell 2000 +1.98%, best two-day run since April). The Magnificent 7 lagged (-0.31%), easing from Tuesday’s record.
Macro backdrop – Optimism was supported by rate cut expectations despite geopolitical tensions. Trump warned of “very severe consequences” for Russia without a ceasefire, while US Treasury Secretary Bessent urged Europe to toughen energy sanctions.
Risk appetite – Bitcoin hit a fresh record above $124,500, underscoring investor appetite for risk assets.
Takeaway for traders – Breadth-driven rally suggests underlying market strength beyond mega-caps, with small-cap momentum potentially spilling over into the broader index.
Key Support and Resistance Levels
Resistance Level 1: 6520
Resistance Level 2: 6580
Resistance Level 3: 6637
Support Level 1: 6400
Support Level 2: 6372
Support Level 3: 6340
This communication is for informational purposes only and should not be viewed as any form of recommendation as to a particular course of action or as investment advice. It is not intended as an offer or solicitation for the purchase or sale of any financial instrument or as an official confirmation of any transaction. Opinions, estimates and assumptions expressed herein are made as of the date of this communication and are subject to change without notice. This communication has been prepared based upon information, including market prices, data and other information, believed to be reliable; however, Trade Nation does not warrant its completeness or accuracy. All market prices and market data contained in or attached to this communication are indicative and subject to change without notice.

S&P500 INDEX (US500): Bullish Rally Continues
S&P500 is going to continue rising at least to 6500 level.
A confirmed break of structure BoS on a daily indicates
a clear dominance of the buyers.
With the absence of high impact US news today, the market will
remain strongly bullish.
❤️Please, support my work with like, thank you!❤️

US500 Short Setup: Bearish Momentum Toward 6205Currently holding a short position on the US500 from the 6358 level, based on Smart Money Concepts. Price has tapped into a premium zone within a higher time frame supply area, showing clear signs of distribution. Liquidity has been swept above recent highs, and a shift in market structure confirms bearish intent. I’m targeting the 6205 level, expecting a rapid downside move in the very short term as smart money drives price toward discounted levels.

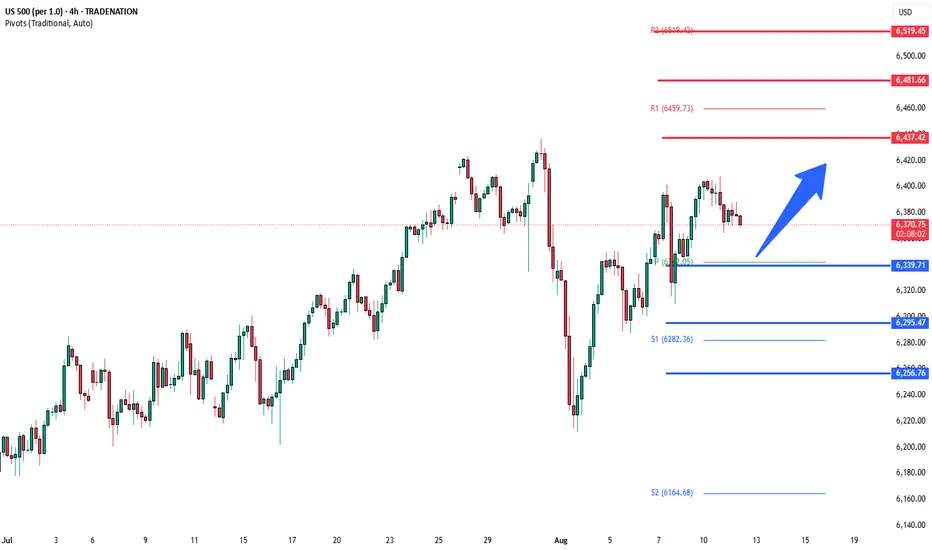
S&P500 awaits US CPI data capped by 6437US equities were little changed Monday. Nvidia (-0.35%) and AMD (-0.28%) slipped after agreeing to pay 15% of Chinese AI chip sales revenue to the US government in exchange for export licenses — a deal Trump confirmed, adding he may allow a scaled-down Blackwell chip to be sold in China. The Philadelphia Semiconductor Index fell -0.13%, cushioned by Intel (+3.51%) after its CEO met with Trump. The Mag-7 (-0.09%) saw slight outperformance, led by Tesla (+2.85%).
Trump extended the US–China tariff truce by 90 days to November 10, keeping additional tariffs at 30%. China matched the extension.
The Fed chair search now includes vice chairs Bowman and Jefferson, plus Dallas Fed President Logan. Trump appointed EJ Antoni (Heritage Foundation) to lead the Bureau of Labor Statistics.
Markets await today’s US CPI, which could influence Fed rate-cut bets, while gold traders look for clarity after Trump said gold imports won’t be tariffed.
Key Support and Resistance Levels
Resistance Level 1: 6437
Resistance Level 2: 6480
Resistance Level 3: 6520
Support Level 1: 6340
Support Level 2: 6295
Support Level 3: 6256
This communication is for informational purposes only and should not be viewed as any form of recommendation as to a particular course of action or as investment advice. It is not intended as an offer or solicitation for the purchase or sale of any financial instrument or as an official confirmation of any transaction. Opinions, estimates and assumptions expressed herein are made as of the date of this communication and are subject to change without notice. This communication has been prepared based upon information, including market prices, data and other information, believed to be reliable; however, Trade Nation does not warrant its completeness or accuracy. All market prices and market data contained in or attached to this communication are indicative and subject to change without notice.
S&P500 Channel Up going straight to 6670.The S&P500 index (SPX) has been trading within a 3-month Channel Up since the May 12 candle. All of this time, it has been supported by the 1D MA50 (blue trend-line) and as long as it holds, the new Bullish Leg is expected.
The last two rose by +7.06%, and ahead of a new 1D MACD Bullish Cross, that gives us a medium-term Target of 6670.
-------------------------------------------------------------------------------
** Please LIKE 👍, FOLLOW ✅, SHARE 🙌 and COMMENT ✍ if you enjoy this idea! Also share your ideas and charts in the comments section below! This is best way to keep it relevant, support us, keep the content here free and allow the idea to reach as many people as possible. **
-------------------------------------------------------------------------------
Disclosure: I am part of Trade Nation's Influencer program and receive a monthly fee for using their TradingView charts in my analysis.
💸💸💸💸💸💸
👇 👇 👇 👇 👇 👇

Big CorrectionThe S&P index.
The chart shows the potential end of the final rally from the 2009 low.
Currently, with this rally from the recent 4,800 low, we are still in a correction period that will end in late October (highs and lows are irrelevant), & We have a date coming up in August so let's see what happens there.
After this period, we will have a rally combined with uncertainty and unjustified speculative movements (bubble) that could take us to the final peak, which I expect in 2026.
This remains a possibility, but don't base your trades on it. However, caution is often good.

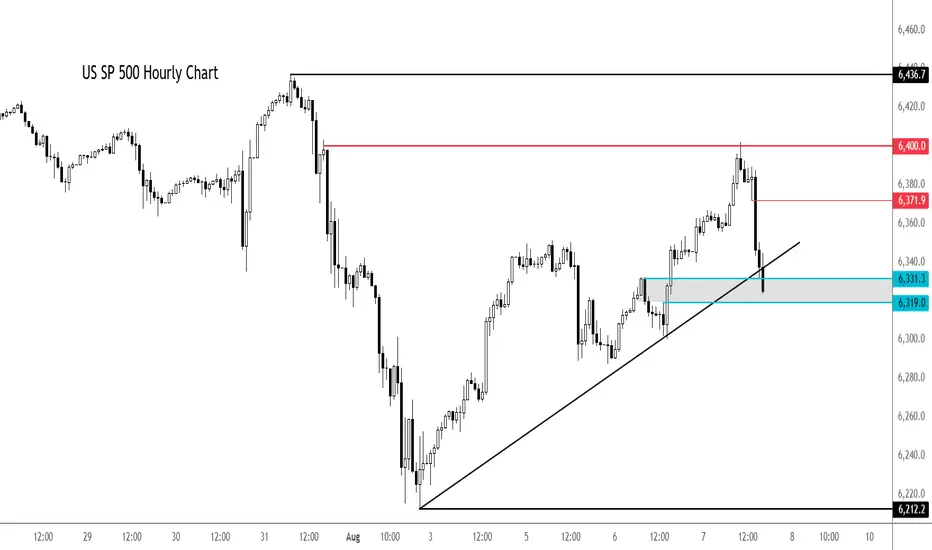
S&P 500 extends drop - can dip buyers come to rescue again?After a decent rally earlier in the day, the major indices and futures started to ease off around mid-morning London trade, before easing further lower in the last couple of hours.
At the time of writing, the S&P was testing its session lows. Here it was probing support and a short-term bullish trend line in the 6319-6331 range. This area needs to hold to keep the bulls happy and in charge. Break this and we could see a bigger correction in the days ahead.
Resistance now comes in at 6372 followed by 6,400.
By Fawad Razaqzada, markets analyst with FOREX>com
US500: Rebound Setup After Sharp Pullback – Key Support HoldingUS500 has experienced a strong corrective move after an extended bullish run but is now showing signs of stabilizing near a key support area. This zone aligns with both technical retracement levels and the market's reaction to fundamental shifts—particularly the dovish repricing of the Fed following weak US jobs data.
Technical Analysis (4H Chart)
Pattern: After a strong uptrend, price faced a steep correction, forming a potential short-term reversal setup.
Current Level: 6,235, holding above the 6,217 support zone.
Key Support Levels:
6,217 (immediate support; key defense zone for bulls).
6,171 (38.2% retracement, secondary support if deeper pullback occurs).
Resistance Levels:
6,272 (23.6% retracement and initial resistance).
6,360 (upper resistance zone and retest of recent breakdown).
6,429/6,436 (recent high and target if bullish momentum resumes).
Projection: A rebound from current levels could push US500 back toward 6,360–6,430 if support holds.
Fundamental Analysis
Bias: Neutral-to-bullish as macro drivers favor a recovery from pullback.
Key Fundamentals:
Fed Policy: Weak US jobs (+73K) and downward revisions have solidified rate cut expectations (~75% probability in September), boosting equity sentiment.
Inflation: Market awaits US CPI; softer data would further support equities.
Tariffs: While Trump’s tariffs create a medium-term risk for earnings, immediate Fed easing bets outweigh these concerns.
Risk Sentiment: Global risk remains supported by lower yields and optimism about Fed easing.
Risks:
Hot US CPI could reverse cut expectations, pressuring equities.
Geopolitical risks or tariff escalation could trigger renewed selling.
Key Events:
US CPI and PPI.
Fed speeches and rate expectations.
Earnings reports from key US companies.
Leader/Lagger Dynamics
US500 is a leader, driving global risk sentiment and influencing risk-sensitive assets like AUD/USD, NZD/USD, and JPY crosses.
Summary: Bias and Watchpoints
US500 is neutral-to-bullish, stabilizing at key support (6,217) after a sharp correction. Fed cut expectations and risk-on sentiment support the upside scenario, targeting 6,360–6,430 if US CPI aligns with softer inflation. However, a hot CPI print could invalidate this rebound and trigger another leg lower.

S&P bullish continuation supported at 6340Tariff Turmoil and Geopolitical Shifts – Implications for S&P 500 Trading
Donald Trump's sweeping new tariffs officially took effect, hitting nearly all U.S. trading partners. Switzerland, facing the steepest rates among developed nations, may retaliate by cancelling a major fighter jet purchase, signaling potential defense-sector implications.
Key developments:
Semiconductor imports to face 100% tariffs, unless production is moved onshore – a bullish signal for domestic chipmakers (e.g., Intel, GlobalFoundries) but negative for firms reliant on overseas fabs.
Additional tariffs floated on China over purchases of Russian oil, echoing similar penalties on India – suggesting growing fragmentation in global trade.
Market impact:
S&P 500 sectors likely affected:
Tech (Semis): Tariff pressure may weigh on multinationals like Nvidia or AMD short term, but benefit domestic fabs and U.S.-based supply chains.
Industrials/Defense: Swiss retaliation could ripple through defense contractors if deals are halted.
Energy/Commodities: Any China-Russia oil tensions could lead to energy volatility, affecting names like ExxonMobil or ConocoPhillips.
Meanwhile, China’s exports unexpectedly rose, softening the blow from the U.S. tariff crackdown. Chinese equity gains could calm broader EM sentiment, helping mitigate global risk-off contagion.
Finally, Trump signaled potential peace talks with Putin and Zelenskiy, with the Kremlin confirming a Putin meeting soon. A diplomatic breakthrough could ease geopolitical risk, supporting investor sentiment and equities globally.
Bottom Line for S&P 500:
Expect sector rotation as traders digest tariff fallout. Watch for:
Strength in domestically focused tech and defense stocks
Caution around globally exposed industrials and semis
Short-term volatility tied to trade rhetoric and geopolitical headlines
Key Support and Resistance Levels
Resistance Level 1: 6437
Resistance Level 2: 6480
Resistance Level 3: 6520
Support Level 1: 6340
Support Level 2: 6295
Support Level 3: 6256
This communication is for informational purposes only and should not be viewed as any form of recommendation as to a particular course of action or as investment advice. It is not intended as an offer or solicitation for the purchase or sale of any financial instrument or as an official confirmation of any transaction. Opinions, estimates and assumptions expressed herein are made as of the date of this communication and are subject to change without notice. This communication has been prepared based upon information, including market prices, data and other information, believed to be reliable; however, Trade Nation does not warrant its completeness or accuracy. All market prices and market data contained in or attached to this communication are indicative and subject to change without notice.

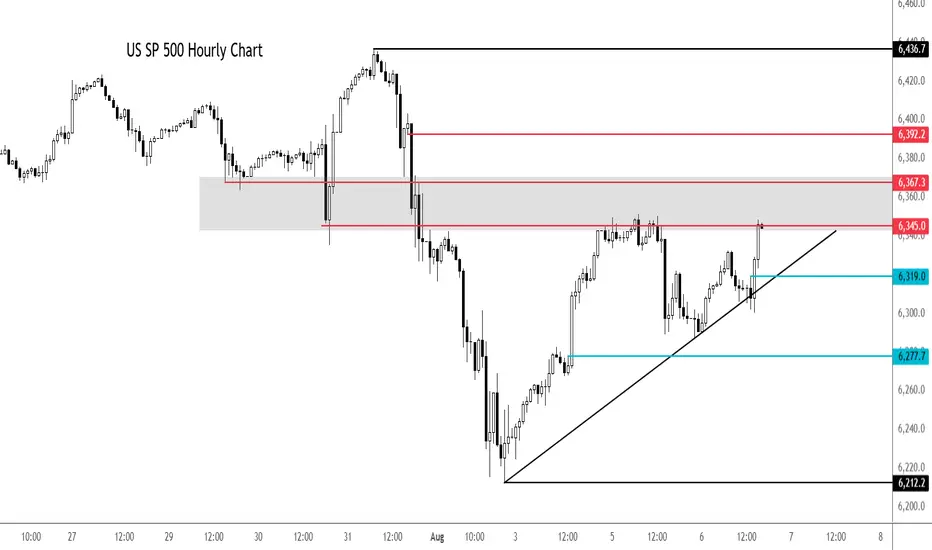
S&P 500 extends rally despite macro concernsThe 5% Apple rally aside, it is all about rate cut bets vs. strong earnings. So far, the latter has helped to keep US markets supported near all-time highs. But if macro concerns increase further, investors' perception about future earnings growth will weaken. And with that, we could see some cracks in expensive stocks.
Looking at the hourly chart of the SPX500, the US benchmark was testing a potential resistance zone in the shaded region between 6345 to 6367, an area which was previously support. Above this zone, 6392 is the next level of potential resistance and then the all-time high of 6436 comes into focus next.
earlier, the index bounced after a failed breakdown below the trend line shown on the chart. Another potential test of the trendline could see the index break lower. Short-term support is seen around 6319 then 6277.
By Fawad Razaqzada, market analyst with FOREX.com
Potential bearish drop?S&P500 is rising towards the pivot, which is a pullback resistance that aligns with the 61.8% Fibonacci retracement and could drop to the 1st support.
Pivot: 6,362.20
1st Support: 6,214.78
1st Resistance: 6,436.72
Risk Warning:
Trading Forex and CFDs carries a high level of risk to your capital and you should only trade with money you can afford to lose. Trading Forex and CFDs may not be suitable for all investors, so please ensure that you fully understand the risks involved and seek independent advice if necessary.
Disclaimer:
The above opinions given constitute general market commentary, and do not constitute the opinion or advice of IC Markets or any form of personal or investment advice.
Any opinions, news, research, analyses, prices, other information, or links to third-party sites contained on this website are provided on an "as-is" basis, are intended only to be informative, is not an advice nor a recommendation, nor research, or a record of our trading prices, or an offer of, or solicitation for a transaction in any financial instrument and thus should not be treated as such. The information provided does not involve any specific investment objectives, financial situation and needs of any specific person who may receive it. Please be aware, that past performance is not a reliable indicator of future performance and/or results. Past Performance or Forward-looking scenarios based upon the reasonable beliefs of the third-party provider are not a guarantee of future performance. Actual results may differ materially from those anticipated in forward-looking or past performance statements. IC Markets makes no representation or warranty and assumes no liability as to the accuracy or completeness of the information provided, nor any loss arising from any investment based on a recommendation, forecast or any information supplied by any third-party.
