EURUSD Breakout and Potential Retrace!Hey Traders, in today's trading session we are monitoring EURUSD for a buying opportunity around 1.18000 zone, EURUSD was trading in a downtrend and successfully managed to break it out. Currently is in a correction phase in which it is approaching the retrace area at 1.18000 support and resistance area.
Trade safe, Joe.
USD

AUDUSD Rally Into Sell Zone | Strong Dollar Theme Returns!Hey Traders,
In today’s trading session we are monitoring AUDUSD for a potential selling opportunity around the 0.70200 zone.
AUDUSD remains in a clear downtrend and is currently in a corrective pullback, approaching a confluence resistance area near 0.70200, where the descending trendline aligns with a key support-turned-resistance zone. This area could act as a sell-the-rally level if bearish momentum returns.
From a fundamental perspective, the recent Fed Chair nomination of Kevin Warsh is viewed as hawkish, which may support short-term USD strength. A stronger dollar typically pressures risk currencies like the Australian dollar, adding fundamental confluence to the bearish technical outlook.
As always, wait for confirmation and manage risk.
Trade safe,
Joe.

EURUSD H4 | Bullish Bounce Off 61.8% Fib SupportBased on the H4 chart analysis, we can see that the price is reacting off our buy entry levle at 1.1777, which is a pullback support that aligns with the 61.8% Fibonacci retracement.
Our stop loss is set at 1.1730, which is an overlap support that aligns with the78.6% Fibonacci retracement.
Our take profit is set at 1.1939, which is a pullback resistance that aligns with the 50% Fibonacci retracement.
High Risk Investment Warning
Stratos Markets Limited fxcm.com Stratos Europe Ltd fxcm.com
CFDs are complex instruments and come with a high risk of losing money rapidly due to leverage. 69% of retail investor accounts lose money when trading CFDs with this provider. You should consider whether you understand how CFDs work and whether you can afford to take the high risk of losing your money.
Stratos Global LLC fxcm.com Losses can exceed deposits.
Please be advised that the information presented on TradingView is provided to FXCM (‘Company’, ‘we’) by a third-party provider (‘TFA Global Pte Ltd’). Please be reminded that you are solely responsible for the trading decisions on your account. Any information and/or content is intended entirely for research, educational and informational purposes only and does not constitute investment or consultation advice or investment strategy. The information is not tailored to the investment needs of any specific person and therefore does not involve a consideration of any of the investment objectives, financial situation or needs of any viewer that may receive it. Past performance is not a reliable indicator of future results. Actual results may differ materially from those anticipated in forward-looking or past performance statements. We assume no liability as to the accuracy or completeness of any of the information and/or content provided herein and the Company cannot be held responsible for any omission, mistake nor for any loss or damage including without limitation to any loss of profit which may arise from reliance on any information supplied by TFA Global Pte Ltd.
Stratos Trading Pty. Limited fxcm.com
Trading FX/CFDs carries significant risks. FXCM AU (AFSL 309763), please read the Financial Services Guide, Product Disclosure Statement, Target Market Determination and Terms of Business at fxcm.com

Potential bullish rise?Gold (XAU/USD) has bounced off the pivot, which is an overlap support, and could rise to the 1st resistance, which is a pullback resistance.
Pivot: 4,766.74
1st Support: 4,600.24
1st Resistance: 5,091.71
Disclaimer:
The opinions given above constitute general market commentary and do not constitute the opinion or advice of IC Markets or any form of personal or investment advice.
Any opinions, news, research, analyses, prices, other information, or links to third-party sites contained on this website are provided on an "as-is" basis, are intended to be informative only, and are not advice, a recommendation, research, a record of our trading prices, an offer of, or solicitation for, a transaction in any financial instrument and thus should not be treated as such. The information provided does not involve any specific investment objectives, financial situation, or needs of any specific person who may receive it. Please be aware that past performance is not a reliable indicator of future performance and/or results. Past performance or forward-looking scenarios based upon the reasonable beliefs of the third-party provider are not a guarantee of future performance. Actual results may differ materially from those anticipated in forward-looking or past performance statements. IC Markets makes no representation or warranty and assumes no liability as to the accuracy or completeness of the information provided, nor any loss arising from any investment based on a recommendation, forecast, or any information supplied by any third party

USDCHF H4 | Bullish ReversalBased on the H4 chart analysis, we could see the price fall to our buy entry level at 0.7693, which is a pullback support that lines up with the 50% Fibonacci retracement.
Our stop loss is set at 0.7608, which is a swing low support.
Our take profit is set at 0.7861, which is a pullback resistance that aligns with the 61.8% Fibonacci retracement.
High Risk Investment Warning
Stratos Markets Limited fxcm.com Stratos Europe Ltd fxcm.com
CFDs are complex instruments and come with a high risk of losing money rapidly due to leverage. 69% of retail investor accounts lose money when trading CFDs with this provider. You should consider whether you understand how CFDs work and whether you can afford to take the high risk of losing your money.
Stratos Global LLC fxcm.com Losses can exceed deposits.
Please be advised that the information presented on TradingView is provided to FXCM (‘Company’, ‘we’) by a third-party provider (‘TFA Global Pte Ltd’). Please be reminded that you are solely responsible for the trading decisions on your account. Any information and/or content is intended entirely for research, educational and informational purposes only and does not constitute investment or consultation advice or investment strategy. The information is not tailored to the investment needs of any specific person and therefore does not involve a consideration of any of the investment objectives, financial situation or needs of any viewer that may receive it. Past performance is not a reliable indicator of future results. Actual results may differ materially from those anticipated in forward-looking or past performance statements. We assume no liability as to the accuracy or completeness of any of the information and/or content provided herein and the Company cannot be held responsible for any omission, mistake nor for any loss or damage including without limitation to any loss of profit which may arise from reliance on any information supplied by TFA Global Pte Ltd.
Stratos Trading Pty. Limited fxcm.com
Trading FX/CFDs carries significant risks. FXCM AU (AFSL 309763), please read the Financial Services Guide, Product Disclosure Statement, Target Market Determination and Terms of Business at fxcm.com

Stop!Loss|Market View: BRENT🙌 Stop!Loss team welcomes you❗️
In this post, we're going to talk about the near-term outlook for the BRENT ☝️
Potential trade setup:
🔔Entry level: 70.18
💰TP: 72.97
⛔️SL: 68.96
"Market View" - a brief analysis of trading instruments, covering the most important aspects of the FOREX market.
👇 In the comments 👇 you can type the trading instrument you'd like to analyze, and we'll talk about it in our next posts.
💬 Description: Technically, the situation is favorable for oil buyers. This is confirmed by the price movement within the ascending channel, as well as a likely retest of the 70-degree area, with a subsequent likely upward breakout. Furthermore, we shouldn't forget the geopolitical factor to which oil is very sensitive: the situation in the Middle East, which will likely push the price higher once again.
Thanks for your support 🚀
Profits for all ✅

Bullish bounce?USD/ZAR is falling towards the pivot and could bounce to the 1st resistance, which is a pullback resistance.
Pivot: 16.1268
1st Support: 16.01453
1st Resistance: 16.33042
Disclaimer:
The opinions given above constitute general market commentary and do not constitute the opinion or advice of IC Markets or any form of personal or investment advice.
Any opinions, news, research, analyses, prices, other information, or links to third-party sites contained on this website are provided on an "as-is" basis, are intended to be informative only, and are not advice, a recommendation, research, a record of our trading prices, an offer of, or solicitation for, a transaction in any financial instrument and thus should not be treated as such. The information provided does not involve any specific investment objectives, financial situation, or needs of any specific person who may receive it. Please be aware that past performance is not a reliable indicator of future performance and/or results. Past performance or forward-looking scenarios based upon the reasonable beliefs of the third-party provider are not a guarantee of future performance. Actual results may differ materially from those anticipated in forward-looking or past performance statements. IC Markets makes no representation or warranty and assumes no liability as to the accuracy or completeness of the information provided, nor any loss arising from any investment based on a recommendation, forecast, or any information supplied by any third party

Bullish bounce off jey support?WTI Oil (XTI/USD) is falling towards the pivot, which is an overlap support and could bounce to the 1st resistance.
Pivot: 62.02
1st Support: 60.27
1st Resistance: 66.23
Disclaimer:
The opinions given above constitute general market commentary and do not constitute the opinion or advice of IC Markets or any form of personal or investment advice.
Any opinions, news, research, analyses, prices, other information, or links to third-party sites contained on this website are provided on an "as-is" basis, are intended to be informative only, and are not advice, a recommendation, research, a record of our trading prices, an offer of, or solicitation for, a transaction in any financial instrument and thus should not be treated as such. The information provided does not involve any specific investment objectives, financial situation, or needs of any specific person who may receive it. Please be aware that past performance is not a reliable indicator of future performance and/or results. Past performance or forward-looking scenarios based upon the reasonable beliefs of the third-party provider are not a guarantee of future performance. Actual results may differ materially from those anticipated in forward-looking or past performance statements. IC Markets makes no representation or warranty and assumes no liability as to the accuracy or completeness of the information provided, nor any loss arising from any investment based on a recommendation, forecast, or any information supplied by any third party

CABLE H4 | Potential Bullish BounceThe price is reacting off our buy entry level at 1.3549, which is a pullback support that aligns with the 61.8% Fibonacci retracement and the 78.6% Fibonacci projection.
Our stop loss is set at 1.3479, which is a pullback support that aligns with the 100% Fibonacci projection.
Our take profit is set at 1.3685, which is a pullback resistance that aligns with the 50% Fibonacci retracement.
High Risk Investment Warning
Stratos Markets Limited fxcm.com Stratos Europe Ltd fxcm.com
CFDs are complex instruments and come with a high risk of losing money rapidly due to leverage. 69% of retail investor accounts lose money when trading CFDs with this provider. You should consider whether you understand how CFDs work and whether you can afford to take the high risk of losing your money.
Stratos Global LLC fxcm.com Losses can exceed deposits.
Please be advised that the information presented on TradingView is provided to FXCM (‘Company’, ‘we’) by a third-party provider (‘TFA Global Pte Ltd’). Please be reminded that you are solely responsible for the trading decisions on your account. Any information and/or content is intended entirely for research, educational and informational purposes only and does not constitute investment or consultation advice or investment strategy. The information is not tailored to the investment needs of any specific person and therefore does not involve a consideration of any of the investment objectives, financial situation or needs of any viewer that may receive it. Past performance is not a reliable indicator of future results. Actual results may differ materially from those anticipated in forward-looking or past performance statements. We assume no liability as to the accuracy or completeness of any of the information and/or content provided herein and the Company cannot be held responsible for any omission, mistake nor for any loss or damage including without limitation to any loss of profit which may arise from reliance on any information supplied by TFA Global Pte Ltd.
Stratos Trading Pty. Limited fxcm.com
Trading FX/CFDs carries significant risks. FXCM AU (AFSL 309763), please read the Financial Services Guide, Product Disclosure Statement, Target Market Determination and Terms of Business at fxcm.com

USD/JPY targeting 179 before trend changes back towards 89We should expect 179 to be a major resistance area that will change the trend back towards 89.
Good luck!

Bitcoin: Wave 5 Toward New Highs!Following on from our last Bitcoin update, here’s how the structure is currently developing.
Structure
- Higher timeframe: Wave 5 in progress, forming an ending diagonal
- Current wave: Wave 4 correction (W-X-Y), currently in wave Y
- Pattern / formation: Corrective pullback within a larger wave-5 advance
Bias
- Directional bias: Bullish
- Invalidation level: Loss of structure / failure to hold the buy zone
Focus
- What we are waiting for: Price to move into the buy zone, where we’ll look for lower-timeframe reversal confirmation (trendline break, impulsive reclaim, or momentum shift) to position for wave-5 continuation
Targets
- Primary targets: 125k, 150k
- Extended target: Hold a runner toward 200k

USDCAD - HTF AnalysisJust some analysis on USDCAD on the higher timeframes such as the daily, weekly, monthly.
Of course, using the usual concepts I use.
All is mentioned in the video, so do watch, share your thoughts.
Safe trading!
- R2F Trading

Ethereum is the KingEthereum , EURUSD and the FTSE100.
My previous analysis has proven to be right. ETH went bereash.
Same goes for the EURUSD.
FTSE100 is the new S&P100.

iKeyhan | EURUSD 4H EURUSD | H4 – Smart Money Bullish Continuation Setup
EURUSD is maintaining a clear bullish market structure on the H4 timeframe, characterized by higher highs and higher lows. Price has transitioned from accumulation into expansion, confirming a higher-timeframe bullish bias.
After an impulsive rally that expanded liquidity and attracted institutional participation, the market is now undergoing a healthy and controlled pullback. This retracement appears corrective rather than distributive, with no signs of trend exhaustion or reversal at the highs.
Price is currently reacting within a key demand and structure support zone around 1.1760 – 1.1780, which aligns with:
• The 61.8% Fibonacci retracement
• Previous resistance turned support
• Dynamic moving average support
• Demand imbalance
This multi-factor confluence significantly increases the probability of bullish continuation.
Moving averages remain positively sloped, and price is holding above them, confirming trend strength. No bearish crossover or structural breakdown is present.
Bullish Continuation Scenario
• As long as price holds above 1.1760
• Bullish confirmation candles on H4 may offer continuation entries
• Upside targets:
• 1.2080 (previous high / liquidity zone)
• Extension toward 1.2200 upon breakout
Invalidation
• A decisive H4 close below 1.1720
• Clear break of structure with momentum
This setup represents a classic smart-money continuation model: strong structure, healthy pullback into demand, Fibonacci confluence, and intact trend momentum.
Bias: Bullish
Key Support: 1.1760 – 1.1780
Targets: 1.2080 → 1.2200

Bullish bounce off?XAU/USD has bounced off the support level, which is an overlap support that is slightly above the 50% Fibonacci retracement and could rise from this level to our take profit.
Entry: 4,776.71
Why we like it:
There is an overlap support that is slightly above the 50% Fibonacci retracement.
Stop loss: 4,989.79
Why we like it:
There is a pullback support level that is slightly below the 78.6% Fibonacci retracement.
Take profit: 5,077.47
Why we like it:
There is a pullback resistance level.
Enjoying your TradingView experience? Review us!
Please be advised that the information presented on TradingView is provided to Vantage (‘Vantage Global Limited’, ‘we’) by a third-party provider (‘Everest Fortune Group’). Please be reminded that you are solely responsible for the trading decisions on your account. There is a very high degree of risk involved in trading. Any information and/or content is intended entirely for research, educational and informational purposes only and does not constitute investment or consultation advice or investment strategy. The information is not tailored to the investment needs of any specific person and therefore does not involve a consideration of any of the investment objectives, financial situation or needs of any viewer that may receive it. Kindly also note that past performance is not a reliable indicator of future results. Actual results may differ materially from those anticipated in forward-looking or past performance statements. We assume no liability as to the accuracy or completeness of any of the information and/or content provided herein and the Company cannot be held responsible for any omission, mistake nor for any loss or damage including without limitation to any loss of profit which may arise from reliance on any information supplied by Everest Fortune Group.

Bearish reversal off pullback resistance?USD/JPY is rising towards the resistance level, which is a pullback resistance that aligns with the 78.6% Fibonacci retracement and could reverse from this level to our take profit.
Entry: 157.71
Why we like it:
There is a pullback resistance level that aligns with the 78.6% Fibonacci retracement.
Stop loss: 159.39
Why we like it:
There is a swing high resistance level.
Take profit: 155.61
Why we like it:
There is a pullback support level.
Enjoying your TradingView experience? Review us!
Please be advised that the information presented on TradingView is provided to Vantage (‘Vantage Global Limited’, ‘we’) by a third-party provider (‘Everest Fortune Group’). Please be reminded that you are solely responsible for the trading decisions on your account. There is a very high degree of risk involved in trading. Any information and/or content is intended entirely for research, educational and informational purposes only and does not constitute investment or consultation advice or investment strategy. The information is not tailored to the investment needs of any specific person and therefore does not involve a consideration of any of the investment objectives, financial situation or needs of any viewer that may receive it. Kindly also note that past performance is not a reliable indicator of future results. Actual results may differ materially from those anticipated in forward-looking or past performance statements. We assume no liability as to the accuracy or completeness of any of the information and/or content provided herein and the Company cannot be held responsible for any omission, mistake nor for any loss or damage including without limitation to any loss of profit which may arise from reliance on any information supplied by Everest Fortune Group.

Bullish reversal off Fib levels?GBP/USD is reacting off the support level, which is a pullback support that aligns with the 61.8% Fibonacci retracement and the 78.6% Fibonacci projection, and could bounce from this level to our take profit.
Entry: 1.3548
Why we like it:
There is a pullback support level that aligns with the 61.8% Fibonaci retracement and the 78.6% Fibonacci projection.
Stop loss: 1.3479
Why we like it:
There is a pullback support level that aligns with the 100% Fibonacci projection.
Take profit: 1.3658
Why we like it:
There is a pullback resistance level.
Enjoying your TradingView experience? Review us!
Please be advised that the information presented on TradingView is provided to Vantage (‘Vantage Global Limited’, ‘we’) by a third-party provider (‘Everest Fortune Group’). Please be reminded that you are solely responsible for the trading decisions on your account. There is a very high degree of risk involved in trading. Any information and/or content is intended entirely for research, educational and informational purposes only and does not constitute investment or consultation advice or investment strategy. The information is not tailored to the investment needs of any specific person and therefore does not involve a consideration of any of the investment objectives, financial situation or needs of any viewer that may receive it. Kindly also note that past performance is not a reliable indicator of future results. Actual results may differ materially from those anticipated in forward-looking or past performance statements. We assume no liability as to the accuracy or completeness of any of the information and/or content provided herein and the Company cannot be held responsible for any omission, mistake nor for any loss or damage including without limitation to any loss of profit which may arise from reliance on any information supplied by Everest Fortune Group.

DOLLAR INDEX- BULLISH TO $102Right now there's a lot of gloom & doom around the DXY, with articles being published about it crashing. I'd be very careful as now is the time that institutions are more likely to buy the Dollar, while everyone else is scared off.
Confluences👇
⭕️A-B-C Correction Complete (3 Sub-Wave Correction).
⭕️Gold Bearish (Negative Correlation to DXY).
⭕️Downside LQ Grabbed From Multi-Month Low.

USDCHF - LONGS DOLLAR BULLS BACK Off the back of last week Friday we have seen dollar strength kickback into the markets.
The weekly candle closed with a wick sweeping liquidity at a major monthly support zone (0.77139) which held and buyers have come back into the market.
TP1: 0.78590
TP2: 0.79097
TP3:079550

USDCAD Q1 | D5 | W5 | Y26 ASIA RANGE BREAKDOWN !!! +5 % INCOMING📅 Q1 | D5 | W5 | Y26
📊 USDCAD — FRGNT DAILY FORECAST ASIA RANGE SHORT !!!!
🔍 Analysis Approach
I’m applying a developed version of Smart Money Concepts, with a structured focus on:
• Identifying Key Points of Interest (POIs) on Higher Time Frames (HTFs) 🕰️
• Using those POIs to define a clear and controlled trading range 📐
• Refining those zones on Lower Time Frames (LTFs) 🔎
• Waiting for a Break of Structure (BoS) as confirmation ✅
This process keeps me precise, disciplined, and aligned with market narrative, rather than reacting emotionally or chasing price.
💡 My Motto
“Capital management, discipline, and consistency in your trading edge.”
A positive risk-to-reward ratio, combined with a high-probability execution model, is the backbone of any sustainable trading plan 📈🔐
⚠️ On Losses
Losses are part of the mathematical reality of trading 🎲
They don’t define you — they are necessary, expected, and managed.
We acknowledge them, learn, and move forward 📊➡️
🙏 I appreciate you taking the time to review my Daily Forecast.
Further context and supporting material can be found in the Links section.
Stay sharp 🧠
Stay consistent 🎯
Protect your capital 🔐
— FRGNT 🚀📈
FX:USDCAD

EURUSD Market StructureEURUSD is trading mid-range.
London is set to push price into a key area: 1.1798–1.1803.
This suggests potential delivery into premium as we head into NY.
HTF bias remains bearish.
I’m only interested in shorts after premium is tapped and structure confirms.
No confirmation, no trade.
If it shows up, I execute.
If not, I stay flat.

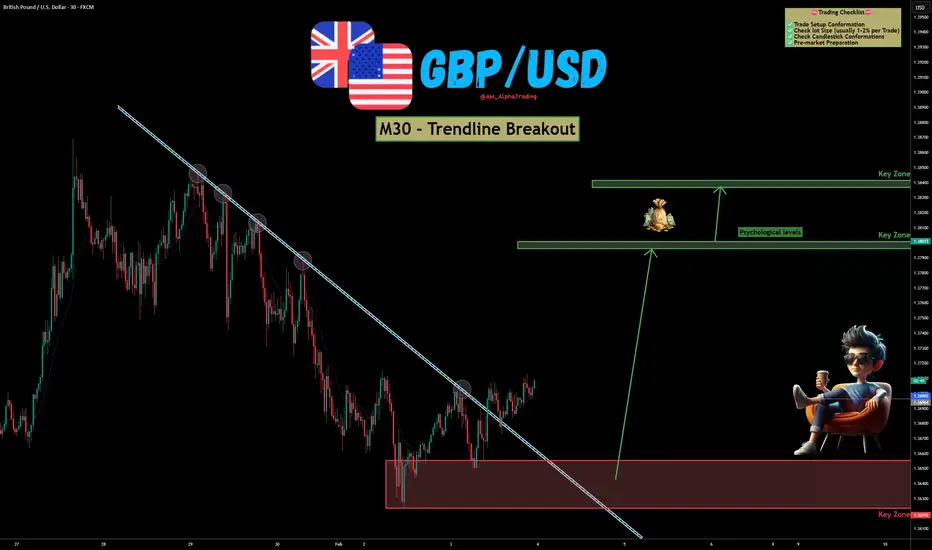
GBP/USD – Trendline Breakout | Bullish Reversal SetupGBP/USD has shown a clear breakout above a well-respected descending trendline on the M30 timeframe, hinting at a potential shift from bearish to bullish momentum. Price action is reacting strongly from a key demand zone, increasing the probability of continuation to the upside. OANDA:GBPUSD
📊 Technical Overview :
Price respected the descending trendline multiple times, confirming its validity.
The recent clean breakout and hold above the trendline suggests buyers are stepping in.
A strong base has formed at the lower demand zone, acting as a launchpad for the move.
Upside targets are aligned with psychological levels and higher-timeframe key zones, offering a favorable risk-to-reward setup.
As long as price holds above the breakout area, bullish continuation remains the preferred bias.
✅ Support this analysis with a
LIKE 👍 | COMMENT 💬 | FOLLOW 🔔
It helps a lot & keeps the ideas coming!
⚠️ Disclaimer: This analysis is for educational purposes only and does not constitute financial advice. Forex trading involves high risk. Trade only with capital you can afford to lose and always do your own research.
EURUSD - Analysis and EducationHere is an analysis on EURUSD and some learnings regarding liquidity, efficiency, and the manipulations that take place.
- R2F Trading
