USDOLLAR H4 | Bullish Bounce Off?The price is falling towards our buy entry level at 12.72, which is a pullback support that aligns with the 50% Fibonacci retracement.
Our stop loss is set at 12.70, which is a pullback support that is slightly above the 78.6% Fibonacci retracement.
Our take profit is set at 12.76, which is a multi swing high resistance.
High Risk Investment Warning
Stratos Markets Limited (
USD

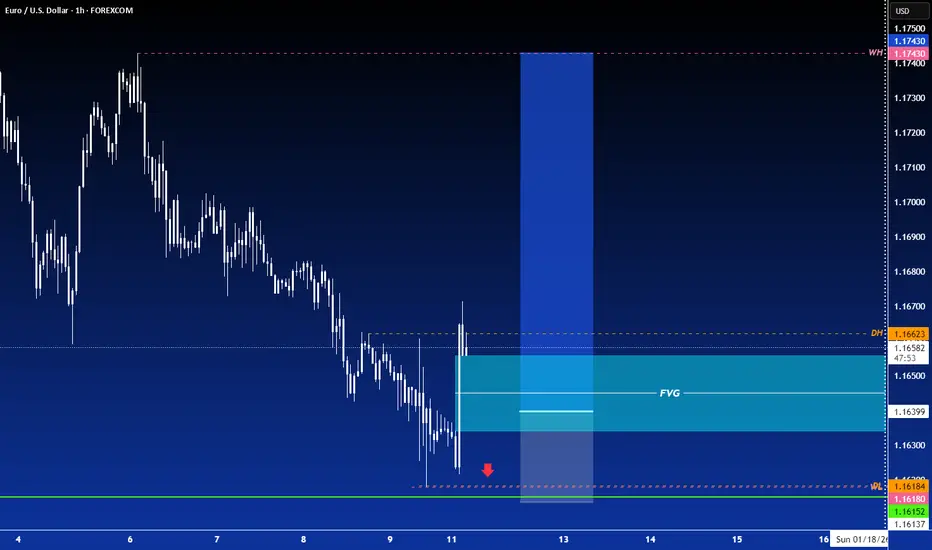
LONG ON EUR/USDEUR/USD has just given a CHOC (change of character) to the upside from is recent downtrend.
The dollar (DXY) is very bearish and I expect EUR/USD to simply retrace a little deeper into the FVG before it begins to rise.
looking to make 80-100 pips.
AUDUSD (Short)This is a good short opportunity, on Friday price failed to take out structure lows it looks like it's deciding to liquidate people who were targeting those lows first... I don't take this trade thinking it will just break that big liquidity today but I see it temporarily pulling back and targeting that TP1 and will decide later if to leave a part of the position run to the full TP.

Potential bullish reversal?WTI Oil (XTI/USD) could make a short-term pullback to the pivot and bounce to the 1st resistance, which has been identified as an overlap resistance.
Pivot: 58.10
1st Support: 55.13
1st Resistance: 62.14
Disclaimer:
The opinions given above constitute general market commentary and do not constitute the opinion or advice of IC Markets or any form of personal or investment advice.
Any opinions, news, research, analyses, prices, other information, or links to third-party sites contained on this website are provided on an "as-is" basis, are intended to be informative only, and are not advice, a recommendation, research, a record of our trading prices, an offer of, or solicitation for, a transaction in any financial instrument and thus should not be treated as such. The information provided does not involve any specific investment objectives, financial situation, or needs of any specific person who may receive it. Please be aware that past performance is not a reliable indicator of future performance and/or results. Past performance or forward-looking scenarios based upon the reasonable beliefs of the third-party provider are not a guarantee of future performance. Actual results may differ materially from those anticipated in forward-looking or past performance statements. IC Markets makes no representation or warranty and assumes no liability as to the accuracy or completeness of the information provided, nor any loss arising from any investment based on a recommendation, forecast, or any information supplied by any third party

Bearish reversal setup?Loonie (USD/CAD) is rising towards the pivot, which is a pullback resistance that aligns with the 61.8% Fibonacci retracement and could reverse to the 1st support.
Pivot: 1.3933
1st Support: 1.3796
1st Resistance: 1.4060
Disclaimer:
The opinions given above constitute general market commentary and do not constitute the opinion or advice of IC Markets or any form of personal or investment advice.
Any opinions, news, research, analyses, prices, other information, or links to third-party sites contained on this website are provided on an "as-is" basis, are intended to be informative only, and are not advice, a recommendation, research, a record of our trading prices, an offer of, or solicitation for, a transaction in any financial instrument and thus should not be treated as such. The information provided does not involve any specific investment objectives, financial situation, or needs of any specific person who may receive it. Please be aware that past performance is not a reliable indicator of future performance and/or results. Past performance or forward-looking scenarios based upon the reasonable beliefs of the third-party provider are not a guarantee of future performance. Actual results may differ materially from those anticipated in forward-looking or past performance statements. IC Markets makes no representation or warranty and assumes no liability as to the accuracy or completeness of the information provided, nor any loss arising from any investment based on a recommendation, forecast, or any information supplied by any third party

Potential bullish reversal?Swissie (USD/CHF) could make a short-term pullback to the pivot, which acts as a pullback support and could bounce to the 1st resistance.
Pivot: 0.7959
1st Support: 0.7855
1st Resistance: 0.8104
Disclaimer:
The opinions given above constitute general market commentary and do not constitute the opinion or advice of IC Markets or any form of personal or investment advice.
Any opinions, news, research, analyses, prices, other information, or links to third-party sites contained on this website are provided on an "as-is" basis, are intended to be informative only, and are not advice, a recommendation, research, a record of our trading prices, an offer of, or solicitation for, a transaction in any financial instrument and thus should not be treated as such. The information provided does not involve any specific investment objectives, financial situation, or needs of any specific person who may receive it. Please be aware that past performance is not a reliable indicator of future performance and/or results. Past performance or forward-looking scenarios based upon the reasonable beliefs of the third-party provider are not a guarantee of future performance. Actual results may differ materially from those anticipated in forward-looking or past performance statements. IC Markets makes no representation or warranty and assumes no liability as to the accuracy or completeness of the information provided, nor any loss arising from any investment based on a recommendation, forecast, or any information supplied by any third party

Falling towards 50% Fib support?Cable (GBP/USD) is falling towards the pivot, which acts as a pullback support that aligns with the 50% Fibonacci retracement and could bounce to the 1st resistance.
Pivot: 1.3296
1st Support: 1.3188
1st Resistance: 1.3545
Disclaimer:
The opinions given above constitute general market commentary and do not constitute the opinion or advice of IC Markets or any form of personal or investment advice.
Any opinions, news, research, analyses, prices, other information, or links to third-party sites contained on this website are provided on an "as-is" basis, are intended to be informative only, and are not advice, a recommendation, research, a record of our trading prices, an offer of, or solicitation for, a transaction in any financial instrument and thus should not be treated as such. The information provided does not involve any specific investment objectives, financial situation, or needs of any specific person who may receive it. Please be aware that past performance is not a reliable indicator of future performance and/or results. Past performance or forward-looking scenarios based upon the reasonable beliefs of the third-party provider are not a guarantee of future performance. Actual results may differ materially from those anticipated in forward-looking or past performance statements. IC Markets makes no representation or warranty and assumes no liability as to the accuracy or completeness of the information provided, nor any loss arising from any investment based on a recommendation, forecast, or any information supplied by any third party

Bearish reversal in play?Bitcoin (BTC/USD) has rejected off the pivot and could reverse to the 1st support.
Pivot: 94,255.27
1st Support: 80,712.26
1st Resistance: 106,846.29
Disclaimer:
The opinions given above constitute general market commentary and do not constitute the opinion or advice of IC Markets or any form of personal or investment advice.
Any opinions, news, research, analyses, prices, other information, or links to third-party sites contained on this website are provided on an "as-is" basis, are intended to be informative only, and are not advice, a recommendation, research, a record of our trading prices, an offer of, or solicitation for, a transaction in any financial instrument and thus should not be treated as such. The information provided does not involve any specific investment objectives, financial situation, or needs of any specific person who may receive it. Please be aware that past performance is not a reliable indicator of future performance and/or results. Past performance or forward-looking scenarios based upon the reasonable beliefs of the third-party provider are not a guarantee of future performance. Actual results may differ materially from those anticipated in forward-looking or past performance statements. IC Markets makes no representation or warranty and assumes no liability as to the accuracy or completeness of the information provided, nor any loss arising from any investment based on a recommendation, forecast, or any information supplied by any third party

Bearish reversal off overlap resistance?Ethereum (ETH/USD) is rising towards the pivot and could reverse to the overlap support that aligns with the 61.8% Fibonacci retracement.
Pivot: 3,390.47
1st Support: 2,725.92
1st Resistance: 3,838.62
Disclaimer:
The opinions given above constitute general market commentary and do not constitute the opinion or advice of IC Markets or any form of personal or investment advice.
Any opinions, news, research, analyses, prices, other information, or links to third-party sites contained on this website are provided on an "as-is" basis, are intended to be informative only, and are not advice, a recommendation, research, a record of our trading prices, an offer of, or solicitation for, a transaction in any financial instrument and thus should not be treated as such. The information provided does not involve any specific investment objectives, financial situation, or needs of any specific person who may receive it. Please be aware that past performance is not a reliable indicator of future performance and/or results. Past performance or forward-looking scenarios based upon the reasonable beliefs of the third-party provider are not a guarantee of future performance. Actual results may differ materially from those anticipated in forward-looking or past performance statements. IC Markets makes no representation or warranty and assumes no liability as to the accuracy or completeness of the information provided, nor any loss arising from any investment based on a recommendation, forecast, or any information supplied by any third party

Potential bullish rise?USD/Chf could make a short-term pullback to the support level, which has been identified as a pullback support, and could bounce from this level to our take profit.
Entry: 0.7966
Why we like it:
There is a pullback support level.
Stop loss: 0.7910
Why we like it:
There is an overlap support level.
Take profit: 0.8048
Why we like it:
There is a pullback resistance level.
Enjoying your TradingView experience? Review us!
Please be advised that the information presented on TradingView is provided to Vantage (‘Vantage Global Limited’, ‘we’) by a third-party provider (‘Everest Fortune Group’). Please be reminded that you are solely responsible for the trading decisions on your account. There is a very high degree of risk involved in trading. Any information and/or content is intended entirely for research, educational and informational purposes only and does not constitute investment or consultation advice or investment strategy. The information is not tailored to the investment needs of any specific person and therefore does not involve a consideration of any of the investment objectives, financial situation or needs of any viewer that may receive it. Kindly also note that past performance is not a reliable indicator of future results. Actual results may differ materially from those anticipated in forward-looking or past performance statements. We assume no liability as to the accuracy or completeness of any of the information and/or content provided herein and the Company cannot be held responsible for any omission, mistake nor for any loss or damage including without limitation to any loss of profit which may arise from reliance on any information supplied by Everest Fortune Group.

Bullish reversal off overlap support?GBP/USD is falling towards the support level, which is an overlap support that aligns with the 127.2% Fibonacci extension and the 38.2% Fibonacci retracement and could bounce from this level to our take profit.
Entry: 1.3355
Why we like it:
There is an overlap support that aligns with the 127.2% Fibonacci extension and the 38.2% Fibonacci retracement.
Stop loss: 1.3270
Why we like it:
There is a pullback support that aligns with the 78.6% Fibonacci retracement.
Take profit: 1.3485
Why we like it:
There is a pullback resistance
Enjoying your TradingView experience? Review us!
Please be advised that the information presented on TradingView is provided to Vantage (‘Vantage Global Limited’, ‘we’) by a third-party provider (‘Everest Fortune Group’). Please be reminded that you are solely responsible for the trading decisions on your account. There is a very high degree of risk involved in trading. Any information and/or content is intended entirely for research, educational and informational purposes only and does not constitute investment or consultation advice or investment strategy. The information is not tailored to the investment needs of any specific person and therefore does not involve a consideration of any of the investment objectives, financial situation or needs of any viewer that may receive it. Kindly also note that past performance is not a reliable indicator of future results. Actual results may differ materially from those anticipated in forward-looking or past performance statements. We assume no liability as to the accuracy or completeness of any of the information and/or content provided herein and the Company cannot be held responsible for any omission, mistake nor for any loss or damage including without limitation to any loss of profit which may arise from reliance on any information supplied by Everest Fortune Group.

Bullish reversal off key support?EUR/USD is falling towards the support level, which is an overlap support that aligns with the 161.8% Fibonacci extension and the 61.8% Fibonacci retracement and could bounce from this level to our take profit.
Entry; 1.1609
Why we like it:
There is an overlap support that aligns with the 161.8% Fibonacci extension and the 61.8% Fibonacci retracement.
Stop loss: 1.1569
Why we like it:
There is a pullback support that is slightly above the 78.6% Fibonacci retracement.
Take profit: 1.1673
Why we like it:
There is a pullback resistance level.
Enjoying your TradingView experience? Review us!
Please be advised that the information presented on TradingView is provided to Vantage (‘Vantage Global Limited’, ‘we’) by a third-party provider (‘Everest Fortune Group’). Please be reminded that you are solely responsible for the trading decisions on your account. There is a very high degree of risk involved in trading. Any information and/or content is intended entirely for research, educational and informational purposes only and does not constitute investment or consultation advice or investment strategy. The information is not tailored to the investment needs of any specific person and therefore does not involve a consideration of any of the investment objectives, financial situation or needs of any viewer that may receive it. Kindly also note that past performance is not a reliable indicator of future results. Actual results may differ materially from those anticipated in forward-looking or past performance statements. We assume no liability as to the accuracy or completeness of any of the information and/or content provided herein and the Company cannot be held responsible for any omission, mistake nor for any loss or damage including without limitation to any loss of profit which may arise from reliance on any information supplied by Everest Fortune Group.

NZDUSD Breakout and Potential Retrace!Hey Traders, in tomorrow's trading session we are monitoring NZDUSD For a buying opportunity around 0.56700 zone, NZDUSD was trading in a downtrend and successfully managed to break it out. Currently is in a correction phase in which it is approaching the retrace area at 0.56700 support and resistance area.
Trade safe, Joe.

GBPUSD - Looking for the StopSince the correction went slightly deeper than expected, let’s define where price may stop.
It’s still too early to say with full confidence that a deep correction has already started. Price may push a bit higher first and only then transition into a broader corrective move.
Key levels to watch:
1.336 - local corrective area
1.329 / 1.324 - potential reversal zones
---
Please subscribe and leave a comment.
You’ll get new information faster than anyone else.
---

EURUSD - Main Plan for 2026Looking at the movement since January 2025, EUR strengthened against USD for most of last year.
We drew a classic five-wave structure up to July 1, 2025. After that, a series of corrective moves kicked in.
In 2026 - time for change. The correction is expected to continue, with USD gaining strength.
This doesn’t mean a deep correction has already started; EUR could still tick up a bit. We’ll cover that in other ideas.
Key targets to watch:
1.1458
1.1213
1.1018
… and possibly even lower.
Crossing the previous peak at 1.1274 should confirm that USD strength can confidently continue.
Bottom line - now you’re in the know.
---
Please subscribe and leave a comment.
You’ll get new information faster than anyone else.
---

USD/CAD - Bullish Pennant Loading (09.01.2026)📝 Description 🔍 Setup (Technical Structure) FX:USDCAD
USD/CAD is forming a classic Bullish Pennant pattern after a strong impulsive move up (flagpole). Price is consolidating with higher lows, respecting short-term EMA support and holding above the Ichimoku cloud — a sign of healthy bullish continuation.
Key confirmations:
Strong bullish flagpole
Tight consolidation (pennant structure)
Price holding above EMA & cloud
No major bearish rejection yet
📍 Support & Resistance
🔴 Key Support: Pennant base / EMA zone
🟢 1st Resistance: 1.3911
🟢 2nd Resistance / Target: 1.3935
🎯 Measured Move Target: Based on flagpole height projection
#USDCAD #ForexTrading #BullishPennant #PriceAction #TrendContinuation #SupportResistance #TradingView #Kabhi_TA_Trading
⚠️ Disclaimer
This analysis is for educational purposes only.
Forex trading involves risk — always use proper risk management and stop-loss.
💬 Support the Analysis👍 Like if you see the bullish continuation
💬 Comment: Breakout or Fakeout? 🔁 Share with traders watching USD/CAD

USD Tempts a Turn into CPI Coming into 2025 it was very easy to be a USD bull. The pair had reversed in the prior Q4, and came into the New Year with a full head of steam. But - the currency found resistance less than two weeks into 2025, and the next month and change saw sellers take over before prodding an aggressive bearish trend that drove for the first-half of the year.
Since then, however, bears haven't been able to make much for big picture trend continuation; and coming into this year, it was really easy to be a USD bear as a sell-off sparked in December that brought with it the thought that bears were back in the U.S. Dollar.
So far in 2026 though, that sell-off has been stymied and the NFP report earlier today was illustration of that, as it was largely a mixed bag that could've been justified in either direction, yet the notable takeaway so far has been support defense at the 98.98 Fibonacci level and into fresh near-term highs.
For U.S. data, the GDP report released in December didn't seem all too bad, certainly not to the degree that would necessitate more near-term rate cuts. The Atlanta GDP Now Forecast is similarly looking quite bullish and optimistic, and with the unemployment rate at 4.4%, there's again further question as to whether the Fed needs to worry. This backdrop can support a continued short-squeeze in the USD, and perhaps even a push above the 100.00 level that was support in 2024 and then resistance on multiple occasions last year.
For next week, the focus is back on CPI and if we do see strength in that data point, USD bulls have an open door to push. - js

GBPUSD Channel Down starting new Bearish Leg.The GBPUSD pair has been trading within a 6-month Channel Down and appears to have just started its new Bearish Leg as Tuesday's Lower High was priced exactly on its top.
As the same time, it almost hit the 0.786 Fibonacci retracement level, which is where the previous (September 17 2025) Lower High was formed, while also the 1D RSI is on the decline after marginally turning overbought (above 70.00).
As a result, we expect the pattern's new Bearish Leg to unfold and can be confirmed as soon as the price breaks below the 1D MA200 (orange trend-line). The previous two Bearish Legs declined by -4.70% and -5.24% respectively, and in both cases the 1D RSI hit the 30.00 oversold barrier.
A new -4.70% decline would target 1.2930, but since this time the 1W MA100 (red trend-line) is in the way, which is the market's long-term Support, we expect a more fair Target to be 1.3050 until we can confirm further downside.
If the 1D RSI hits 30.00 before the price reaches 1.3050, we will take profit regardless.
---
** Please LIKE 👍, FOLLOW ✅, SHARE 🙌 and COMMENT ✍ if you enjoy this idea! Also share your ideas and charts in the comments section below! This is best way to keep it relevant, support us, keep the content here free and allow the idea to reach as many people as possible. **
---
💸💸💸💸💸💸
👇 👇 👇 👇 👇 👇

Update on my previous analysis (published on Feb 23, 2023):
As of now, Bitcoin appears to have formed a cycle top at the end of the projected period from my previous post.
Based on the same cyclical structure and historical behavior, I believe a new corrective / bearish cycle is starting.
My expectation is that this declining cycle will continue, and the next major cycle top could form roughly 1,400 days from here.
This analysis is based on long-term cycle timing and structural repetition rather than short-term price action.
Not financial advice. Just my personal market view.

USD Triangle Break - What's NextThe NFP report from this morning is one of those items that could be construed either way. The headline number was below expected but the unemployment rate was a touch better at 4.4% v/s 4.5% expected.
Initially there was a bit of chaos in DXY, which is to be expected, but so far a big level has held and bulls are pushing up to fresh highs.
The support in question is the 98.98 level, which is the 61.8% Fibonacci retracement of the 2021-2022 major move. That price has so far been defended and now for the past couple weeks, USD bulls have been making a strong push. Next resistance is near at 99.30 and the 100-100.22 level was a brick wall in Q4, after having shown as support in late-2024 trade.
On the driver side of the matter, USD/JPY is at a fresh high and this is a point of concern if chasing either market, as getting closer to that 160.00 handle could bring threats of intervention from the MoF. This doesn't necessarily mean a top is in place or nearby, but it does highlight caution if chasing USD/JPY breakouts as bull traps after fresh highs have been a more regular type of thing in the pair. - js

Gold Outlook: Key Break at 4475 Ahead of U.S. Jobs DataGOLD | Market OVERVIEW
Gold edges higher as traders await key U.S. economic data later today for clues on the rate path. Focus is on December NFP, expected to show solid hiring with steady unemployment—potentially reducing urgency for near-term Fed cuts. Markets are also watching the Fed leadership transition, after Treasury Secretary Scott Bessent said Donald Trump may name a successor to Jerome Powell later this month.
📉 MARKET BIAS
Short-term bearish below 4475; direction confirmed by intraday closes.
🔼 BEARISH SCENARIO (PRIMARY BELOW RESISTANCE)
• While below 4475, price may pull back toward 4458
• A 15M close below 4458 supports continuation toward:
🎯 4436 🎯 4407
🔼 BULLISH SCENARIO (INVALIDATION)
• A 1H close above 4475 flips momentum bullish
• Upside targets:
🎯 4500 🎯 4520
📌 KEY LEVELS
• Pivot: 4475
• Support: 4458 – 4436 – 4407
• Resistance: 4500 – 4520

GBPUSD Could Push Higher? | Rate-Cut Risk Pressures the Dollar!Hey Traders,
In today’s trading session, we are closely monitoring GBPUSD for a potential buying opportunity around the 1.33800 zone. GBPUSD remains in a well-established uptrend and is currently undergoing a healthy corrective pullback, approaching a key trendline confluence and the 1.33800 support-turned-resistance area, which may act as a strong demand zone for bullish continuation.
From a fundamental perspective, growing expectations of a potential interest rate cut by the Federal Reserve in the coming months continue to weigh on the US Dollar. A softer USD environment typically supports upside momentum in GBPUSD, reinforcing the bullish technical outlook.
As always, wait for confirmation and manage risk responsibly.
Trade safe,
Joe.

NZDUSD - Bears Brewing at a Critical Intersection!!!📉NZDUSD has been moving inside a clear bearish structure , with lower highs forming along the orange descending trendline.
⚔️Price is now approaching a major confluence area where the upper orange trendline meets the green resistance zone, a level that has repeatedly acted as a ceiling.
As price retests this intersection, we will be looking for trend-following short setups, expecting sellers to defend this area and potentially drive price back downward within the bearish cycle.
A strong breakout above the trendline would invalidate the short bias, but unless that happens, the bears remain in control.
Are you seeing the same reaction zone on your charts? Let me know 👇
⚠️ Disclaimer: This is not financial advice. Always do your own research and manage risk properly.
📚 Stick to your trading plan regarding entries, risk, and management.
Good luck! 🍀
All Strategies Are Good; If Managed Properly!
~Richard Nasr
