Bullish bounce off?GBP/USD is falling towards the support level, which is a pullback support that aligns with the 50% Fibonacci retracement and could bounce from this level to our take profit.
Entry: 1.3443
Why we like it:
There is a pullback support level that aligns with the 50% Fibonacci retracement.
Stop loss: 1.3414
Why we like it:
There is a support level at the 61.8% Fibonacci retracement.
Take profit: 1.3501
Why we like it:
There is a pullback resistance level.
Enjoying your TradingView experience? Review us!
Please be advised that the information presented on TradingView is provided to Vantage (‘Vantage Global Limited’, ‘we’) by a third-party provider (‘Everest Fortune Group’). Please be reminded that you are solely responsible for the trading decisions on your account. There is a very high degree of risk involved in trading. Any information and/or content is intended entirely for research, educational and informational purposes only and does not constitute investment or consultation advice or investment strategy. The information is not tailored to the investment needs of any specific person and therefore does not involve a consideration of any of the investment objectives, financial situation or needs of any viewer that may receive it. Kindly also note that past performance is not a reliable indicator of future results. Actual results may differ materially from those anticipated in forward-looking or past performance statements. We assume no liability as to the accuracy or completeness of any of the information and/or content provided herein and the Company cannot be held responsible for any omission, mistake nor for any loss or damage including without limitation to any loss of profit which may arise from reliance on any information supplied by Everest Fortune Group.
USD

Bearish breakout?EUR/USD has rejected off the resistance level, which his a pullback resistance, and could drop from this level to our take profit.
Entry: 1.1777
Why we like it:
There is a pullback resistance level.
Stop loss: 1.1807
Why we like it:
There is a swing high resistance level
Take profit: 1.1708
Why we like it:
There is a pullback support level.
Enjoying your TradingView experience? Review us!
Please be advised that the information presented on TradingView is provided to Vantage (‘Vantage Global Limited’, ‘we’) by a third-party provider (‘Everest Fortune Group’). Please be reminded that you are solely responsible for the trading decisions on your account. There is a very high degree of risk involved in trading. Any information and/or content is intended entirely for research, educational and informational purposes only and does not constitute investment or consultation advice or investment strategy. The information is not tailored to the investment needs of any specific person and therefore does not involve a consideration of any of the investment objectives, financial situation or needs of any viewer that may receive it. Kindly also note that past performance is not a reliable indicator of future results. Actual results may differ materially from those anticipated in forward-looking or past performance statements. We assume no liability as to the accuracy or completeness of any of the information and/or content provided herein and the Company cannot be held responsible for any omission, mistake nor for any loss or damage including without limitation to any loss of profit which may arise from reliance on any information supplied by Everest Fortune Group.

USD/JPY LONG: BoJ rate cut move. Hey everyone,
I'm buying the dip on USD/JPY at 156.10 – 156.30. The Yen had a brief moment of strength after the December 19th BoJ hike, but it’s struggling to maintain momentum as we close out 2025.
Why I’m Long (Fundamentals)
BoJ "Hawkish" Fatigue: The BoJ raised rates to 0.75% on Dec 19th.
US Resilience: While the Fed is cooling, US GDP is still printing above 4%. This "US Exceptionalism" keeps the Dollar bid on every major dip.
Fiscal Concerns: PM Takaichi’s record 122T Yen budget is raising debt concerns. This fiscal "looseness" devalues the Yen even if the central bank tries to tighten.
Year-End Flows: Liquidity is thin. I expect a relief bounce back toward the 157+ area (highlighted) as shorts cover before the 2026 open.
Technical Levels
Entry: 156.15 area
SL: 154.40 (Tight stop below the monthly swing low)
TP1: 157.50 (Recent resistance)
TP2: 158.20 (Double top target)

USD Vying for 2nd Consecutive Green QuarterThere was a lot thrown at the US Dollar in 2025.
The currency was riding a hot streak coming into the year but it set its high less than 2 weeks into 2025 and after President Trump was inaugurated, it was seemingly a chorus call of bearish drivers for the currency. Trump even had a comment in July that remains noteworthy:
"So when we have a strong dollar, one thing happens: It sounds good. But you don't do any tourism. You can't sell tractors, you can't sell trucks, you can't sell anything." He then went on to say: "It is good for inflation, that's about it."
This helps to explain the near-constant onslaught on the Fed for rate cuts, even with inflation remaining above the Fed's 2% target. Trump wants lower rates from the Fed with the hope that Treasury rates (and in-turn, mortgage rates) will follow-lower.
This is a tough position, hoping for extreme growth fueled by currency weakness in the global reserve, which sets the stage for 2025 performance as it was the fear of recession in the first half of the year that really drove the trend in DXY.
In the second half of the year though, not so much, even as the Fed pushed 75 bps of cuts and Trump continually dangled the Fed Chair nomination as a major chip in his economic design.
The sell-off in the Dollar has largely been stalled even despite a bearish backdrop; but the big question now since we're talking about currencies, is whether the Euro can take on significant strength into the New Year, which presents its own unique set of challenges.
Because currencies are the foundation for the global economic system, the only way to value a currency - is with another currency. This is why spot FX trades in pairs, it's the Euro in USD terms (EUR/USD) or the British Pounds priced in US Dollars (GBP/USD); or perhaps the US Dollar in Japanese Yen terms (USD/JPY). For the DXY basket, however, that relationship isn't as obvious, but DXY is simply a basket of underlying currencies, of which the Euro makes up a whopping 57.6% allocation.
So, we can be in a backdrop where everything is great in the US, and the economy is roaring higher - yet the US Dollar sells off. But the determinant to that is whether matters in Europe are even better, which would compel higher rate forecasts and expectations and more demand for Euros than USD.
But there's a knock on effect to this - as the Euro appreciates, both inflation and growth see pressure, because the more valuable Euro makes imports cheaper (and domestic products, by comparison, more expensive). This then prods growth of imports, and pressure on domestic producers, which then creates a headwind for growth.
The 2022-2023 saga illustrates this well, as a rampaging US Dollar brought down inflation in the US, and drove EUR/USD below parity, only for inflation to boost in Europe until the ECB had to come to the table with massive rate hikes of their own.
The big question for 2026 for both the Euro and the US Dollar, is whether Europe can exhibit that level of economic strength. If they can, there's a justifiable case for EUR/USD to push above 1.2000, and that can drive the USD lower which is probably what President Trump is hoping for. But, if not, there's a brewing backdrop for reversal in the USD, at least from the chart, as we've already seen two quarters where 'bad news' for the Dollar couldn't compel a bearish trend. - js

USDJPY is Nearing a Strong Resistance!Hey Traders,
In today’s trading session, we are monitoring USDJPY for a potential selling opportunity around the 156.200 zone.
Technically, the pair remains in a broader downtrend and is currently in a corrective move, retracing back toward the 156.20 area, which aligns with trend resistance and a key support/resistance flip. This zone has previously acted as a reaction level and now serves as a potential area for sellers to re-engage.
As long as price remains capped below this region, the prevailing bearish structure stays intact, with rallies viewed as corrective rather than impulsive.
Watching closely for price reaction and bearish confirmation around 156.200 before any continuation lower.
Trade safe,
Joe

EURUSD Staging a massive correction.The EURUSD pair has been rejected on the 2025 Resistance Zone, while at the same time its 1D RSI got rejected on its Lower Highs trend-line.
This is technically a preparation for a massive long-term bearish reversal but even on the shorter term, such rejections have declined by at least -3.46%. This targets directly Support 2 at 1.14000.
---
** Please LIKE 👍, FOLLOW ✅, SHARE 🙌 and COMMENT ✍ if you enjoy this idea! Also share your ideas and charts in the comments section below! This is best way to keep it relevant, support us, keep the content here free and allow the idea to reach as many people as possible. **
---
💸💸💸💸💸💸
👇 👇 👇 👇 👇 👇

GOLD H4 | Potential Bullish BounceBased on the H4 chart analysis, we can see that the price has bounced off our buy entry level at 4,343.11, whichis a pullback support that aligns with the 38.2% Fibonacci retracement.
Our stop loss is set at 4,265.18, which is an overlap support that lines up with the 50% Fibonacci retracement.
Our take profit is set at 4,446.51, which is a pullback resistance that aligns with the 61.8% Fibonacci retracement.
High Risk Investment Warning
Stratos Markets Limited (

Bullish bounce off?Silver (XAG/USD) has bounced off the pivot, which aligns with the 50% Fibonacci retracement and could potentially rise to the 1st resistance.
Pivot: 70.79
1st Support: 68.17
1st Resistance: 80.70
Disclaimer:
The opinions given above constitute general market commentary and do not constitute the opinion or advice of IC Markets or any form of personal or investment advice.
Any opinions, news, research, analyses, prices, other information, or links to third-party sites contained on this website are provided on an "as-is" basis, are intended to be informative only, and are not advice, a recommendation, research, a record of our trading prices, an offer of, or solicitation for, a transaction in any financial instrument and thus should not be treated as such. The information provided does not involve any specific investment objectives, financial situation, or needs of any specific person who may receive it. Please be aware that past performance is not a reliable indicator of future performance and/or results. Past performance or forward-looking scenarios based upon the reasonable beliefs of the third-party provider are not a guarantee of future performance. Actual results may differ materially from those anticipated in forward-looking or past performance statements. IC Markets makes no representation or warranty and assumes no liability as to the accuracy or completeness of the information provided, nor any loss arising from any investment based on a recommendation, forecast, or any information supplied by any third party

EURUSD - AnalysisHere is an analysis on EURUSD, expecting bullish prices. There is some nice confluence of PD Arrays on many different timeframes. Of course, it being the end of the year, there could be some major volatility OR major consolidation until the next year where we may see some Seek & Destroy profile happen.
Either way, be safe during this time. (And at all times =))
- R2F Trading

Bearish momentum to extend further?Loonie (USD/CAD) is rising towards the pivot, which is a pullback resistance, and could drop to the 1st support.
Pivot: 1.3773
1st Support: 1.3655
1st Resistance: 1.3773
Disclaimer:
The opinions given above constitute general market commentary and do not constitute the opinion or advice of IC Markets or any form of personal or investment advice.
Any opinions, news, research, analyses, prices, other information, or links to third-party sites contained on this website are provided on an "as-is" basis, are intended to be informative only, and are not advice, a recommendation, research, a record of our trading prices, an offer of, or solicitation for, a transaction in any financial instrument and thus should not be treated as such. The information provided does not involve any specific investment objectives, financial situation, or needs of any specific person who may receive it. Please be aware that past performance is not a reliable indicator of future performance and/or results. Past performance or forward-looking scenarios based upon the reasonable beliefs of the third-party provider are not a guarantee of future performance. Actual results may differ materially from those anticipated in forward-looking or past performance statements. IC Markets makes no representation or warranty and assumes no liability as to the accuracy or completeness of the information provided, nor any loss arising from any investment based on a recommendation, forecast, or any information supplied by any third party

Bearish drop off 50% Fib resistance?USD/JPY has rejected off the pivot and could drop to the 1st support, which has been identified as an overlap support.
Pivot: 156.68
1st Support: 155.31
1st Resistance: 157.26
Disclaimer:
The opinions given above constitute general market commentary and do not constitute the opinion or advice of IC Markets or any form of personal or investment advice.
Any opinions, news, research, analyses, prices, other information, or links to third-party sites contained on this website are provided on an "as-is" basis, are intended to be informative only, and are not advice, a recommendation, research, a record of our trading prices, an offer of, or solicitation for, a transaction in any financial instrument and thus should not be treated as such. The information provided does not involve any specific investment objectives, financial situation, or needs of any specific person who may receive it. Please be aware that past performance is not a reliable indicator of future performance and/or results. Past performance or forward-looking scenarios based upon the reasonable beliefs of the third-party provider are not a guarantee of future performance. Actual results may differ materially from those anticipated in forward-looking or past performance statements. IC Markets makes no representation or warranty and assumes no liability as to the accuracy or completeness of the information provided, nor any loss arising from any investment based on a recommendation, forecast, or any information supplied by any third party

Bearish drop off?Swissie (USD/CHF) could rise to the pivot, which is a pullback resistance that aligns with the 50% Fibonacci retracement and could reverse to the pullback support.
Pivot: 0.7922
1st Support: 0.7861
1st Resistance: 0.7968
Disclaimer:
The opinions given above constitute general market commentary and do not constitute the opinion or advice of IC Markets or any form of personal or investment advice.
Any opinions, news, research, analyses, prices, other information, or links to third-party sites contained on this website are provided on an "as-is" basis, are intended to be informative only, and are not advice, a recommendation, research, a record of our trading prices, an offer of, or solicitation for, a transaction in any financial instrument and thus should not be treated as such. The information provided does not involve any specific investment objectives, financial situation, or needs of any specific person who may receive it. Please be aware that past performance is not a reliable indicator of future performance and/or results. Past performance or forward-looking scenarios based upon the reasonable beliefs of the third-party provider are not a guarantee of future performance. Actual results may differ materially from those anticipated in forward-looking or past performance statements. IC Markets makes no representation or warranty and assumes no liability as to the accuracy or completeness of the information provided, nor any loss arising from any investment based on a recommendation, forecast, or any information supplied by any third party

Could we see a reversal on the Kiwi?Kiwi (NZD/USD) is rising towards the pivot, which is a pullback resistance that aligns with the 61.8% FIbonacci retracement and could reverse to the 1st support.
Pivot: 0.5822
1st Support: 0.5798
1st Resistance: 0.5834
Disclaimer:
The opinions given above constitute general market commentary and do not constitute the opinion or advice of IC Markets or any form of personal or investment advice.
Any opinions, news, research, analyses, prices, other information, or links to third-party sites contained on this website are provided on an "as-is" basis, are intended to be informative only, and are not advice, a recommendation, research, a record of our trading prices, an offer of, or solicitation for, a transaction in any financial instrument and thus should not be treated as such. The information provided does not involve any specific investment objectives, financial situation, or needs of any specific person who may receive it. Please be aware that past performance is not a reliable indicator of future performance and/or results. Past performance or forward-looking scenarios based upon the reasonable beliefs of the third-party provider are not a guarantee of future performance. Actual results may differ materially from those anticipated in forward-looking or past performance statements. IC Markets makes no representation or warranty and assumes no liability as to the accuracy or completeness of the information provided, nor any loss arising from any investment based on a recommendation, forecast, or any information supplied by any third party

Falling towards pullback support?Cable (GBP/USD) is falling towards the pivot which acts as a pullback support that lines up with the 38.2% Fibonacci retracement and could bounce to the swing h igh resistance.
Pivot: 1.3439
1st Support: 1.3383
1st Resistance: 1.3534
Disclaimer:
The opinions given above constitute general market commentary and do not constitute the opinion or advice of IC Markets or any form of personal or investment advice.
Any opinions, news, research, analyses, prices, other information, or links to third-party sites contained on this website are provided on an "as-is" basis, are intended to be informative only, and are not advice, a recommendation, research, a record of our trading prices, an offer of, or solicitation for, a transaction in any financial instrument and thus should not be treated as such. The information provided does not involve any specific investment objectives, financial situation, or needs of any specific person who may receive it. Please be aware that past performance is not a reliable indicator of future performance and/or results. Past performance or forward-looking scenarios based upon the reasonable beliefs of the third-party provider are not a guarantee of future performance. Actual results may differ materially from those anticipated in forward-looking or past performance statements. IC Markets makes no representation or warranty and assumes no liability as to the accuracy or completeness of the information provided, nor any loss arising from any investment based on a recommendation, forecast, or any information supplied by any third party

BCHUSD H4 | Bullish Bounce Off Pullback SupportBased on te h4 chart analysis, we could see the price fall to our buy entry level at 577.67, which is a pullback support that lines up with the 78.6% Fibonacci retracement.
Our stop is set at 552.67, which is an overlap support.
Our take profit is set at 619.93, which is a multi swing high resistance.
High Risk Investment Warning
Stratos Markets Limited (

GOLD H4 | Bullish Bounce OffBased on the H4 chart analysis, we can see that the price has bounced off our buy entry level at 4,314.95, which is a pullback support that aligns with the 61.8% Fibonacci retracement.
Our stop loss is set at 4,266.20, which is an overlap support that aligns with the 50% Fibonacci retracement.
Our take-profit is set at 4,418.33, which corresponds to a pullback resistance that aligns with the 50% Fibonacci retracement.
High Risk Investment Warning
Stratos Markets Limited (

Bullish continuation setup?Fiber (EUR/USD) has bounced off the pivot and could potentially rise to the 1st resistance.
Pivot: 1.1749
1st Support: 1.1725
1st Resistance: 1.1806
Disclaimer:
The opinions given above constitute general market commentary and do not constitute the opinion or advice of IC Markets or any form of personal or investment advice.
Any opinions, news, research, analyses, prices, other information, or links to third-party sites contained on this website are provided on an "as-is" basis, are intended to be informative only, and are not advice, a recommendation, research, a record of our trading prices, an offer of, or solicitation for, a transaction in any financial instrument and thus should not be treated as such. The information provided does not involve any specific investment objectives, financial situation, or needs of any specific person who may receive it. Please be aware that past performance is not a reliable indicator of future performance and/or results. Past performance or forward-looking scenarios based upon the reasonable beliefs of the third-party provider are not a guarantee of future performance. Actual results may differ materially from those anticipated in forward-looking or past performance statements. IC Markets makes no representation or warranty and assumes no liability as to the accuracy or completeness of the information provided, nor any loss arising from any investment based on a recommendation, forecast, or any information supplied by any third party

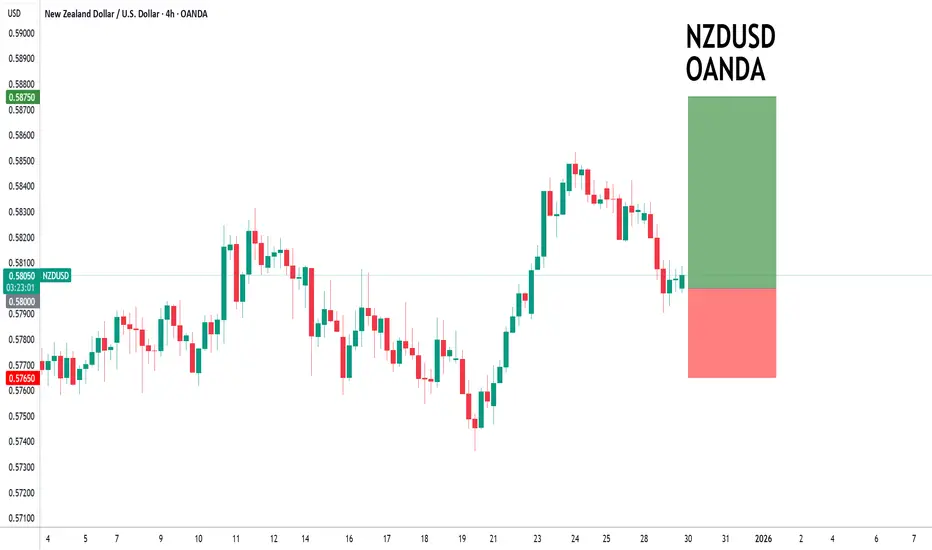
NZDUSD to find support market price?NZDUSD - 24h expiry
There is no clear indication that the upward move is coming to an end.
Although we remain bullish overall, a correction is possible with plenty of room to move lower without impacting the trend higher.
Risk/Reward would be poor to call a buy from current levels.
A move through 0.5850 will confirm the bullish momentum.
The measured move target is 0.5900.
We look to Buy at 0.5800 (stop at 0.5765)
Our profit targets will be 0.5875 and 0.5900
Resistance: 0.5850 / 0.5875 / 0.5900
Support: 0.5800 / 0.5775 / 0.5750
Risk Disclaimer
The trade ideas beyond this page are for informational purposes only and do not constitute investment advice or a solicitation to trade. This information is provided by Signal Centre, a third-party unaffiliated with OANDA, and is intended for general circulation only. OANDA does not guarantee the accuracy of this information and assumes no responsibilities for the information provided by the third party. The information does not take into account the specific investment objectives, financial situation, or particular needs of any particular person. You should take into account your specific investment objectives, financial situation, and particular needs before making a commitment to trade, including seeking, under a separate engagement, as you deem fit.
You accept that you assume all risks in independently viewing the contents and selecting a chosen strategy.
Where the research is distributed in Singapore to a person who is not an Accredited Investor, Expert Investor or an Institutional Investor, Oanda Asia Pacific Pte Ltd (“OAP“) accepts legal responsibility for the contents of the report to such persons only to the extent required by law. Singapore customers should contact OAP at 6579 8289 for matters arising from, or in connection with, the information/research distributed.
GBPUSD Pullback Toward 1.34500 Keeps Bullish Trend in Play!Hey Traders,
In the coming week, we are monitoring GBPUSD for a potential buying opportunity around the 1.34500 zone.
The pair remains in a well-established uptrend and is currently undergoing a controlled correction. Price is approaching the 1.34500 area, a key zone where trendline support converges with a former support/resistance level, making it a technically important area to watch.
As long as this level holds, the broader bullish structure remains intact, and a constructive reaction here could open the door for a continuation toward higher levels.
don't forget to boost and leave your opinion in the comment section!
Trade safe,
Joe

GBPUSD Multi-year downtrend is starting.The GBPUSD pair has been quietly trading within a multi-decade Channel Down since its November 2007 market Top. The price is now the closest it has been to its 1M MA200 (orange trend-line) since it broke below in August 2014. This is also the 0.786 Fibonacci Channel level, the trend-line where that 2014 Bearish Leg started.
With the 1M RSI also rejected on its 65.00 Resistance, we believe the pair is starting a new multi-year Bearish Leg. The minimum such a Bearish Leg declined by within this pattern, has been -20.75%, which gives us a Target of at least 1.0950 by 2027. GBPUSD is perhaps one of the strongest long-term sell opportunities in the market right now.
---
** Please LIKE 👍, FOLLOW ✅, SHARE 🙌 and COMMENT ✍ if you enjoy this idea! Also share your ideas and charts in the comments section below! This is best way to keep it relevant, support us, keep the content here free and allow the idea to reach as many people as possible. **
---
💸💸💸💸💸💸
👇 👇 👇 👇 👇 👇

Bullish reversal off key support?NZD/USD is reacting off the support level which is an overlap support that is slightly below the 38.2% Fibonacci retracement and could bounce from this level to our take profit.
Entry: 90.48
Why we like it:
There is an overlap support that is slightly below the 38.2% Fibonacci retracement.
Stop loss: 90.27
Why we like it:
There is a pullback support level that line sup with the 50% Fibonacci retracement.
Take profit: 90.87
Why we like it:
There is a pullback resistance that lines up with the 38.2% Fibonacci retracement.
Enjoying your TradingView experience? Review us!
Please be advised that the information presented on TradingView is provided to Vantage (‘Vantage Global Limited’, ‘we’) by a third-party provider (‘Everest Fortune Group’). Please be reminded that you are solely responsible for the trading decisions on your account. There is a very high degree of risk involved in trading. Any information and/or content is intended entirely for research, educational and informational purposes only and does not constitute investment or consultation advice or investment strategy. The information is not tailored to the investment needs of any specific person and therefore does not involve a consideration of any of the investment objectives, financial situation or needs of any viewer that may receive it. Kindly also note that past performance is not a reliable indicator of future results. Actual results may differ materially from those anticipated in forward-looking or past performance statements. We assume no liability as to the accuracy or completeness of any of the information and/or content provided herein and the Company cannot be held responsible for any omission, mistake nor for any loss or damage including without limitation to any loss of profit which may arise from reliance on any information supplied by Everest Fortune Group.

GBPUSD Pullback Toward 1.34500 Keeps Bullish Trend in Play!Hey Traders,
In tomorrow's trading session, we are monitoring GBPUSD for a potential buying opportunity around the 1.34500 zone.
The pair remains in a well-established uptrend and is currently undergoing a controlled correction. Price is approaching the 1.34500 area, a key zone where trendline support converges with a former support/resistance level, making it a technically important area to watch.
As long as this level holds, the broader bullish structure remains intact, and a constructive reaction here could open the door for a continuation toward higher levels.
Trade safe,
Joe

GOLD H1 | Could We See A Bounce?The price is reacting off our buy entry level of 4,444.83, which is a pullback support that aligns with the 50% Fibonacci retracement.
Our take profit is at 4,519.14, which is a pullback resistance.
Our stop loss is at 4,417.57, which is a pullback support that aligns with the 127.2% Fibonacci extension.
High Risk Investment Warning
Stratos Markets Limited (
