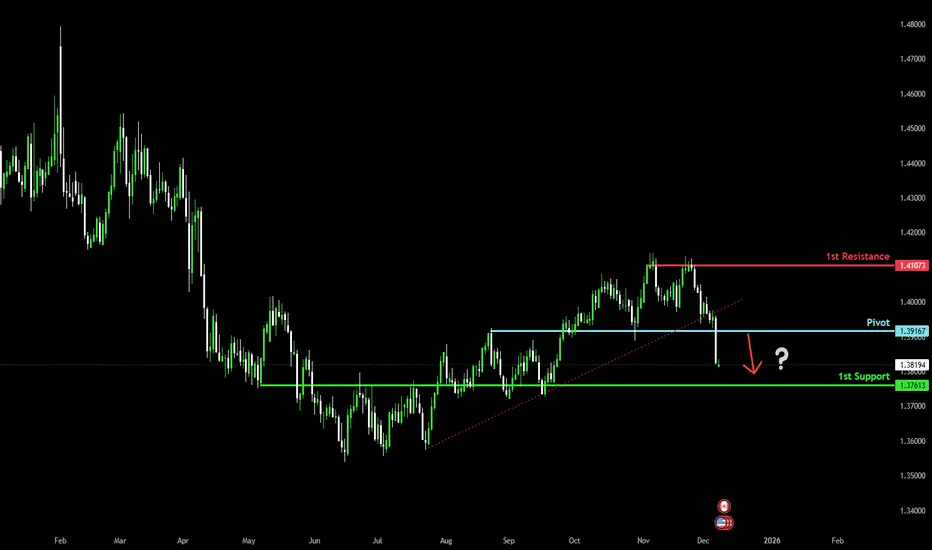
Bearish continuation setup?Loonie (USD/CAD) could rise to the pivot, which acts as an overlap resistance, and could reverse to the 1st support, which has been identified as an overlap support.
Pivot: 1.3916
1st Support: 1.3761
1st Resistance: 1.4107
Disclaimer:
The opinions given above constitute general market commentary and do not constitute the opinion or advice of IC Markets or any form of personal or investment advice.
Any opinions, news, research, analyses, prices, other information, or links to third-party sites contained on this website are provided on an "as-is" basis, are intended to be informative only, and are not advice, a recommendation, research, a record of our trading prices, an offer of, or solicitation for, a transaction in any financial instrument and thus should not be treated as such. The information provided does not involve any specific investment objectives, financial situation, or needs of any specific person who may receive it. Please be aware that past performance is not a reliable indicator of future performance and/or results. Past performance or forward-looking scenarios based upon the reasonable beliefs of the third-party provider are not a guarantee of future performance. Actual results may differ materially from those anticipated in forward-looking or past performance statements. IC Markets makes no representation or warranty and assumes no liability as to the accuracy or completeness of the information provided, nor any loss arising from any investment based on a recommendation, forecast, or any information supplied by any third party.
USD
Falling towards major support?Swissie (USD/CHF) is falling towards the pivot and could bounce to the 1st resistance, which is an overlap resistance.
Pivot: 0.7875
1st Support: 0.7739
1st Resistance: 0.8084
Disclaimer:
The opinions given above constitute general market commentary and do not constitute the opinion or advice of IC Markets or any form of personal or investment advice.
Any opinions, news, research, analyses, prices, other information, or links to third-party sites contained on this website are provided on an "as-is" basis, are intended to be informative only, and are not advice, a recommendation, research, a record of our trading prices, an offer of, or solicitation for, a transaction in any financial instrument and thus should not be treated as such. The information provided does not involve any specific investment objectives, financial situation, or needs of any specific person who may receive it. Please be aware that past performance is not a reliable indicator of future performance and/or results. Past performance or forward-looking scenarios based upon the reasonable beliefs of the third-party provider are not a guarantee of future performance. Actual results may differ materially from those anticipated in forward-looking or past performance statements. IC Markets makes no representation or warranty and assumes no liability as to the accuracy or completeness of the information provided, nor any loss arising from any investment based on a recommendation, forecast, or any information supplied by any third party.

Bearish reversal off 50% Fibonacci resistance?Cable (GBP/USD) is reacting off the pivot which has been identified as a pullback resistance that aligns with the 50% Fibonacci retracement and could reverse to the 1st support.
Pivot: 1.3394
1st Support: 1.3189
1st Resistance: 1.3585
Disclaimer:
The opinions given above constitute general market commentary and do not constitute the opinion or advice of IC Markets or any form of personal or investment advice.
Any opinions, news, research, analyses, prices, other information, or links to third-party sites contained on this website are provided on an "as-is" basis, are intended to be informative only, and are not advice, a recommendation, research, a record of our trading prices, an offer of, or solicitation for, a transaction in any financial instrument and thus should not be treated as such. The information provided does not involve any specific investment objectives, financial situation, or needs of any specific person who may receive it. Please be aware that past performance is not a reliable indicator of future performance and/or results. Past performance or forward-looking scenarios based upon the reasonable beliefs of the third-party provider are not a guarantee of future performance. Actual results may differ materially from those anticipated in forward-looking or past performance statements. IC Markets makes no representation or warranty and assumes no liability as to the accuracy or completeness of the information provided, nor any loss arising from any investment based on a recommendation, forecast, or any information supplied by any third party.

Bearish reversal?Ethereum (ETH/USD) is rising towards the pivot and could reverse to the 1st support.
Pivot: 3,203.88
1st Support: 2,725.92
1st Resistance: 3,681.97
Disclaimer:
The opinions given above constitute general market commentary and do not constitute the opinion or advice of IC Markets or any form of personal or investment advice.
Any opinions, news, research, analyses, prices, other information, or links to third-party sites contained on this website are provided on an "as-is" basis, are intended to be informative only, and are not advice, a recommendation, research, a record of our trading prices, an offer of, or solicitation for, a transaction in any financial instrument and thus should not be treated as such. The information provided does not involve any specific investment objectives, financial situation, or needs of any specific person who may receive it. Please be aware that past performance is not a reliable indicator of future performance and/or results. Past performance or forward-looking scenarios based upon the reasonable beliefs of the third-party provider are not a guarantee of future performance. Actual results may differ materially from those anticipated in forward-looking or past performance statements. IC Markets makes no representation or warranty and assumes no liability as to the accuracy or completeness of the information provided, nor any loss arising from any investment based on a recommendation, forecast, or any information supplied by any third party.

Bearish momentum to extend?Bitcoin (BTC/USD) is rising towards the pivot which acts as a pullback resistance and could reverse to the 1st support.
Pivot: 94,255.27
1st Support: 80,712.26
1st Resistance: 106,846.29
Disclaimer:
The opinions given above constitute general market commentary and do not constitute the opinion or advice of IC Markets or any form of personal or investment advice.
Any opinions, news, research, analyses, prices, other information, or links to third-party sites contained on this website are provided on an "as-is" basis, are intended to be informative only, and are not advice, a recommendation, research, a record of our trading prices, an offer of, or solicitation for, a transaction in any financial instrument and thus should not be treated as such. The information provided does not involve any specific investment objectives, financial situation, or needs of any specific person who may receive it. Please be aware that past performance is not a reliable indicator of future performance and/or results. Past performance or forward-looking scenarios based upon the reasonable beliefs of the third-party provider are not a guarantee of future performance. Actual results may differ materially from those anticipated in forward-looking or past performance statements. IC Markets makes no representation or warranty and assumes no liability as to the accuracy or completeness of the information provided, nor any loss arising from any investment based on a recommendation, forecast, or any information supplied by any third party.

AUDUSD Potential UpsidesHey Traders, in tomorrow's trading session we are monitoring AUDUSD for a buying opportunity around 0.66300 zone, AUDUSD is trading in an uptrend and currently is in a correction phase in which it is approaching the trend at 0.66300 support and resistance area.
Trade safe, Joe.

Could we see a reversal from here?NZD/USD is reacting off the resistance level, which is a pullback resistance and could reverse from this level to our take profit.
Entry: 0.5782
Why we like it:
There is a pullback resistance level.
Stop loss: 0.5804
Why we like it:
There is a swing high resistance level
Take profit: 0.5728
Why we like it:
There is a pullback support level that is slightly below the 23.2% Fibonacci retracement.
Please be advised that the information presented on TradingView is provided to Vantage (‘Vantage Global Limited’, ‘we’) by a third-party provider (‘Everest Fortune Group’). Please be reminded that you are solely responsible for the trading decisions on your account. There is a very high degree of risk involved in trading. Any information and/or content is intended entirely for research, educational and informational purposes only and does not constitute investment or consultation advice or investment strategy. The information is not tailored to the investment needs of any specific person and therefore does not involve a consideration of any of the investment objectives, financial situation or needs of any viewer that may receive it. Kindly also note that past performance is not a reliable indicator of future results. Actual results may differ materially from those anticipated in forward-looking or past performance statements. We assume no liability as to the accuracy or completeness of any of the information and/or content provided herein and the Company cannot be held responsible for any omission, mistake nor for any loss or damage including without limitation to any loss of profit which may arise from reliance on any information supplied by Everest Fortune Group.

Bearish reversal of 50% Fibonacci resistance?GBP/USD is reacting off the resistance level, which is a pullback resistance that aligns with the 50% Fibonacci retracement and could fall from this level to our take profit.
Entry: 1.3337
Why we like it:
There is a pullback resistance that aligns with the 50% Fibonacci retracement.
Stop loss: 1.3373
Why we like it:
There is a pullback resistance level.
Take profit: 1.3276
Why we like it:
There is a pullback support level that is slightly below the 50% Fibonacci retracement.
Enjoying your TradingView experience? Review us!
Please be advised that the information presented on TradingView is provided to Vantage (‘Vantage Global Limited’, ‘we’) by a third-party provider (‘Everest Fortune Group’). Please be reminded that you are solely responsible for the trading decisions on your account. There is a very high degree of risk involved in trading. Any information and/or content is intended entirely for research, educational and informational purposes only and does not constitute investment or consultation advice or investment strategy. The information is not tailored to the investment needs of any specific person and therefore does not involve a consideration of any of the investment objectives, financial situation or needs of any viewer that may receive it. Kindly also note that past performance is not a reliable indicator of future results. Actual results may differ materially from those anticipated in forward-looking or past performance statements. We assume no liability as to the accuracy or completeness of any of the information and/or content provided herein and the Company cannot be held responsible for any omission, mistake nor for any loss or damage including without limitation to any loss of profit which may arise from reliance on any information supplied by Everest Fortune Group.

Potential bearish drop off?EUR/USD has rejected off the resistance level which is a swing high resistance and could drop from this level to our take profit.
Entry: 1.165
Why we like it:
There is a swing high resistance.
Stop loss: 1.1709
Why we like it:
There is a swing high resistance level that is slightly below the 78.6% Fibonacci extension.
Take profit: 1.1598
Why we like it:
There is an overlap support level that is slightly below the 38.2% Fibonacci retracement.
Enjoying your TradingView experience? Review us!
Please be advised that the information presented on TradingView is provided to Vantage (‘Vantage Global Limited’, ‘we’) by a third-party provider (‘Everest Fortune Group’). Please be reminded that you are solely responsible for the trading decisions on your account. There is a very high degree of risk involved in trading. Any information and/or content is intended entirely for research, educational and informational purposes only and does not constitute investment or consultation advice or investment strategy. The information is not tailored to the investment needs of any specific person and therefore does not involve a consideration of any of the investment objectives, financial situation or needs of any viewer that may receive it. Kindly also note that past performance is not a reliable indicator of future results. Actual results may differ materially from those anticipated in forward-looking or past performance statements. We assume no liability as to the accuracy or completeness of any of the information and/or content provided herein and the Company cannot be held responsible for any omission, mistake nor for any loss or damage including without limitation to any loss of profit which may arise from reliance on any information supplied by Everest Fortune Group.

Bearish reversal setup?USD/JPY is rising towards the resistance level, which his a pullback resistance that aligns with the 50% Fibonacci retracement and could reverse from this level to our take profit.
Entry: 156.29
Why we like it:
There is a pullback resistance level that aligns with the 50% Fibonacci retracement.
Stop loss: 157.56
Why we like it:
There is a swing high resistance level.
Take profit: 154.27
Why we like it:
There is an overlap support level.
Enjoying your TradingView experience? Review us!
Please be advised that the information presented on TradingView is provided to Vantage (‘Vantage Global Limited’, ‘we’) by a third-party provider (‘Everest Fortune Group’). Please be reminded that you are solely responsible for the trading decisions on your account. There is a very high degree of risk involved in trading. Any information and/or content is intended entirely for research, educational and informational purposes only and does not constitute investment or consultation advice or investment strategy. The information is not tailored to the investment needs of any specific person and therefore does not involve a consideration of any of the investment objectives, financial situation or needs of any viewer that may receive it. Kindly also note that past performance is not a reliable indicator of future results. Actual results may differ materially from those anticipated in forward-looking or past performance statements. We assume no liability as to the accuracy or completeness of any of the information and/or content provided herein and the Company cannot be held responsible for any omission, mistake nor for any loss or damage including without limitation to any loss of profit which may arise from reliance on any information supplied by Everest Fortune Group.

how dollar index look like now!!This is a long-term structural analysis of the U.S. Dollar Index (DXY).
While no analyst can predict the exact future path of price, studying major structures, liquidity zones, long-term channels, and timing cycles can provide a meaningful macro perspective.
In this chart I highlight:
• Key liquidity pools and distribution/accumulation zones
• Long-term ascending and descending channels
• Major Fibonacci confluence zones
• Structural breaks and mitigation blocks
• Possible multi–year corrective cycles
• Time cycles that have previously aligned with major turning points
The overall idea suggests that DXY may be entering a macro inflection point, where both bullish and bearish scenarios become highly sensitive to structural confirmation.
A deeper correction remains possible if price loses the mid–range support zone, while a reclaim of upper structure could extend the bullish cycle first.
This is not a prediction — it’s a roadmap.
Price will choose its own path, but having a broader structural view helps traders understand where major reactions may occur over the next several years.

EURUSD | Into The Next WeekLooking for a bullish continuation into the next week for both EURUSD and GBPUSD. Both looking strong.
I have 2 best case possibilities shown on the chart.
we either see a direct move to the upside, will be looking for bullish setups for the rest of the week.
Or we see a small drop first into the lower time frame support, and again a move up.
Let me know what your outlook is on EURUSD!
Stay safe out there and do your own due diligence, this is not investment advise!

EURUSD Uptrend Structure Intact — Path Toward 1.1700 ResistanceHello traders! I want to share my view on the current EURUSD setup. After a corrective decline, the pair formed a solid local bottom around the Support Level near 1.16200–1.16400, where buyers stepped in and stopped the downward momentum. As shown on the chart, price is now trading inside a clear ascending structure, supported by the rising Support Line and guided by a parallel Resistance Line, forming a well-defined upward channel. Inside this structure, the Buyer Zone has played a key role, serving as the base for multiple impulsive breakouts in the past. Several breakdown attempts turned into fake breakouts, confirming that buyers continue to defend this area and maintain short-term trend control. After these rebounds, EURUSD pushed into the upper part of the channel, reaching the Resistance Line and forming a local rejection that caused a pullback back toward the Buyer Zone. Currently, price is hovering near the ascending support line, and as long as EURUSD stays above the 1.16400 support area, the bullish scenario remains intact. If buyers successfully defend this zone and maintain structure inside the rising channel, I expect the market to move toward TP1 → 1.17000, which aligns with the major Resistance Level highlighted on the chart. A clean breakout above this level would open the way for further continuation, potentially driving the pair deeper into the higher resistance zone. However, if the price breaks below the Buyer Zone and violates the ascending Support Line, the bullish scenario becomes invalid, and the pair may revisit lower support levels around the 1.16000 area. For now, the structure remains moderately bullish as long as demand holds and EURUSD continues respecting the rising channel. Please share this idea with your friends and click Boost 🚀

EUR/USD Still Struggling to Trend but Bulls Take Step ForwardThat 1.1500 level in EUR/USD has proven to be a tough spot to crack and the higher-low from two weeks ago has now pushed into a higher-high.
But with that said, buyers seemingly refused to drive this week even with a higher-high to go along with that higher-low, and this sets the stage for next week's FOMC meeting as a breakdown in the USD will likely need EUR/USD bulls to make a push.
For next week, it's the 1.1593 level that looms large in EUR/USD and if that level gives way, it's going to look like a failed breakout and it'll expose the 1.1500 level for another re-test.
For USD-weakness, GBP/USD has shown more attractive bullish structure and for USD-strength, USD/JPY makes for a stronger argument, at least until some semblance of trend shows itself in EUR/USD. - js

GBPUSD on a multi-year decline that's far from being over.The GBPUSD pair is currently on a 5-week rebound following the November 03 Low just below its 1W MA50 (blue trend-line). Despite this short-term reaction, the general long-term trend remains bearish following the June 30 2025 High.
That High started a Double Top sequence that is similar to both previous Cycle Tops since January 22 2018. Even though this latest one didn't take place exactly on the Lower Highs trend-line, it was priced on the closest level to the 1M MA200 (red trend-line) since September 2014.
At the same time, the 1W RSI printed the exact same 8-year Resistance Zone rejection pattern as the previous 4 times. Based on the previous 2 Cycles, we expect the 1st Leg of this long-term correction to approach the 1W MA200 (orange trend-line) on a -7.64% (minimum) drop, targeting 1.2750. Then after a bounce to retest and get rejected on the 1W MA50, we expect it to aim then 9-year Symmetrical Support Zone at 1.2100.
---
** Please LIKE 👍, FOLLOW ✅, SHARE 🙌 and COMMENT ✍ if you enjoy this idea! Also share your ideas and charts in the comments section below! This is best way to keep it relevant, support us, keep the content here free and allow the idea to reach as many people as possible. **
---
💸💸💸💸💸💸
👇 👇 👇 👇 👇 👇

Bullish breakout?WTI Oil (XTI/USD) is reacting off the pivot, which acts as a pullback support that aligns with the 50% Fibonacci retracement and could bounce to the 1st resistance.
Pivot: 59.54
1st Support: 59.01
1st Resistance: 60.82
Disclaimer:
The opinions given above constitute general market commentary and do not constitute the opinion or advice of IC Markets or any form of personal or investment advice.
Any opinions, news, research, analyses, prices, other information, or links to third-party sites contained on this website are provided on an "as-is" basis, are intended to be informative only, and are not advice, a recommendation, research, a record of our trading prices, an offer of, or solicitation for, a transaction in any financial instrument and thus should not be treated as such. The information provided does not involve any specific investment objectives, financial situation, or needs of any specific person who may receive it. Please be aware that past performance is not a reliable indicator of future performance and/or results. Past performance or forward-looking scenarios based upon the reasonable beliefs of the third-party provider are not a guarantee of future performance. Actual results may differ materially from those anticipated in forward-looking or past performance statements. IC Markets makes no representation or warranty and assumes no liability as to the accuracy or completeness of the information provided, nor any loss arising from any investment based on a recommendation, forecast, or any information supplied by any third party.

Bullish continuation?Gold (XAU/USD) could fall to the pivot, which acts as a pullback support, and could bounce to the 1st resistance.
Pivot: 4,146.41
1st Support: 4,085.30
1st Resistance: 4,264.13
Disclaimer:
The opinions given above constitute general market commentary and do not constitute the opinion or advice of IC Markets or any form of personal or investment advice.
Any opinions, news, research, analyses, prices, other information, or links to third-party sites contained on this website are provided on an "as-is" basis, are intended to be informative only, and are not advice, a recommendation, research, a record of our trading prices, an offer of, or solicitation for, a transaction in any financial instrument and thus should not be treated as such. The information provided does not involve any specific investment objectives, financial situation, or needs of any specific person who may receive it. Please be aware that past performance is not a reliable indicator of future performance and/or results. Past performance or forward-looking scenarios based upon the reasonable beliefs of the third-party provider are not a guarantee of future performance. Actual results may differ materially from those anticipated in forward-looking or past performance statements. IC Markets makes no representation or warranty and assumes no liability as to the accuracy or completeness of the information provided, nor any loss arising from any investment based on a recommendation, forecast, or any information supplied by any third party.

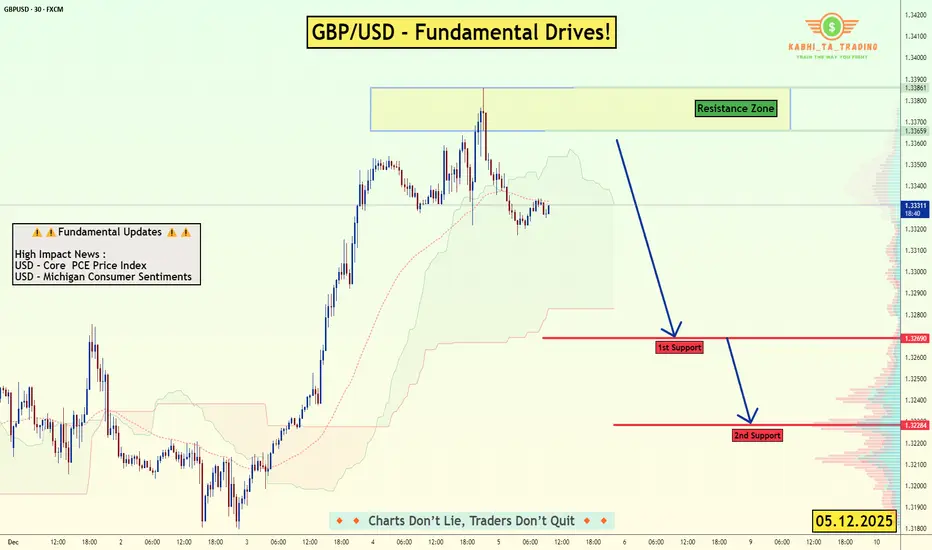
GBP/USD – Fundamentals Drive the Move! (05.12.2025)📝 Description FX:GBPUSD
GBP/USD is currently trading below the resistance zone after failing to hold recent bullish momentum. With USD Core PCE Price Index and Michigan Consumer Sentiment releasing today, the pair may see increased volatility, potentially pushing the price lower if USD strengthens.
A rejection from the resistance zone combined with weakening intraday structure suggests a possible bearish continuation toward support levels.
📌 Key Support & Resistance Levels
🔺 Resistance Zone: 1.3359 – 1.3386
🟥 1st Support: 1.3269
🟥 2nd Support: 1.3228
⚠️ Fundamentals Today
1️⃣ USD – Core PCE Price Index (High Impact)
2️⃣ USD – Michigan Consumer Sentiment (High Impact)
#GBPUSD #ForexAnalysis #PriceAction #Fundamentals #USDNews #TechnicalAnalysis #TradingPlan #ChartAnalysis #FXTrading #TradingView #Kabhi_TA_Trading
⚠️ Disclaimer
This chart is for educational purposes only, not financial advice.
Always use stop-loss and manage position size according to your risk tolerance.
👍 Support the Analysis❤️ Please LIKE💬 Drop a COMMENT
🔁 SHARE if you found this helpful!
Bullish reversal setup?USD/JPY has bounced off the pivot which acts as an overlap support and could potentially rise to the 50% Fibonacci resistance.
Pivot: 154.44
1st Support: 153.45
1st Resistance: 156.28
Disclaimer:
The opinions given above constitute general market commentary and do not constitute the opinion or advice of IC Markets or any form of personal or investment advice.
Any opinions, news, research, analyses, prices, other information, or links to third-party sites contained on this website are provided on an "as-is" basis, are intended to be informative only, and are not advice, a recommendation, research, a record of our trading prices, an offer of, or solicitation for, a transaction in any financial instrument and thus should not be treated as such. The information provided does not involve any specific investment objectives, financial situation, or needs of any specific person who may receive it. Please be aware that past performance is not a reliable indicator of future performance and/or results. Past performance or forward-looking scenarios based upon the reasonable beliefs of the third-party provider are not a guarantee of future performance. Actual results may differ materially from those anticipated in forward-looking or past performance statements. IC Markets makes no representation or warranty and assumes no liability as to the accuracy or completeness of the information provided, nor any loss arising from any investment based on a recommendation, forecast, or any information supplied by any third party.

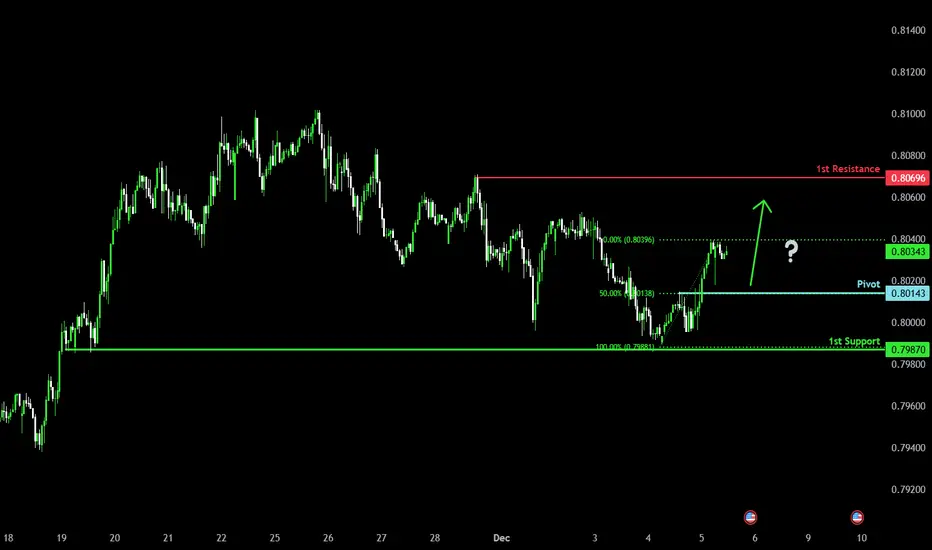
Bullish bounce off pullback support?Swissie (USD/CHF) could fall towards the pivot which acts as a pullback support that aligns witht he 50% Fibonacci retracement and could bounce to the 1st resistance.
Pivot: 0.8014
1st Support: 0.7987
1st Resistance: 0.8069
Disclaimer:
The opinions given above constitute general market commentary and do not constitute the opinion or advice of IC Markets or any form of personal or investment advice.
Any opinions, news, research, analyses, prices, other information, or links to third-party sites contained on this website are provided on an "as-is" basis, are intended to be informative only, and are not advice, a recommendation, research, a record of our trading prices, an offer of, or solicitation for, a transaction in any financial instrument and thus should not be treated as such. The information provided does not involve any specific investment objectives, financial situation, or needs of any specific person who may receive it. Please be aware that past performance is not a reliable indicator of future performance and/or results. Past performance or forward-looking scenarios based upon the reasonable beliefs of the third-party provider are not a guarantee of future performance. Actual results may differ materially from those anticipated in forward-looking or past performance statements. IC Markets makes no representation or warranty and assumes no liability as to the accuracy or completeness of the information provided, nor any loss arising from any investment based on a recommendation, forecast, or any information supplied by any third party.
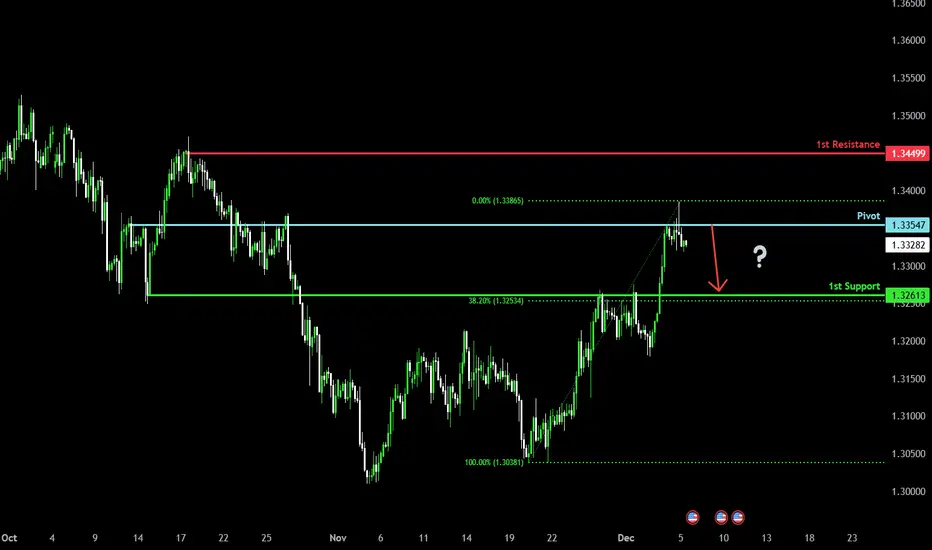
Could we see a reversal from here?Cable (GBP/USD) has rejected off the pivot and could drop to the 1st support.
Pivot: 1.3354
1st Support: 1.3261
1st Resistance: 1.3449
Disclaimer:
The opinions given above constitute general market commentary and do not constitute the opinion or advice of IC Markets or any form of personal or investment advice.
Any opinions, news, research, analyses, prices, other information, or links to third-party sites contained on this website are provided on an "as-is" basis, are intended to be informative only, and are not advice, a recommendation, research, a record of our trading prices, an offer of, or solicitation for, a transaction in any financial instrument and thus should not be treated as such. The information provided does not involve any specific investment objectives, financial situation, or needs of any specific person who may receive it. Please be aware that past performance is not a reliable indicator of future performance and/or results. Past performance or forward-looking scenarios based upon the reasonable beliefs of the third-party provider are not a guarantee of future performance. Actual results may differ materially from those anticipated in forward-looking or past performance statements. IC Markets makes no representation or warranty and assumes no liability as to the accuracy or completeness of the information provided, nor any loss arising from any investment based on a recommendation, forecast, or any information supplied by any third party.
Bearish reversal off swing high?Fiber (EUR/USD) has rejected off the pivot and could reverse to the 1st support which is an overlap support.
Pivot: 1.1666
1st Support: 1.1611
1st Resistance: 1.1709
Disclaimer:
The opinions given above constitute general market commentary and do not constitute the opinion or advice of IC Markets or any form of personal or investment advice.
Any opinions, news, research, analyses, prices, other information, or links to third-party sites contained on this website are provided on an "as-is" basis, are intended to be informative only, and are not advice, a recommendation, research, a record of our trading prices, an offer of, or solicitation for, a transaction in any financial instrument and thus should not be treated as such. The information provided does not involve any specific investment objectives, financial situation, or needs of any specific person who may receive it. Please be aware that past performance is not a reliable indicator of future performance and/or results. Past performance or forward-looking scenarios based upon the reasonable beliefs of the third-party provider are not a guarantee of future performance. Actual results may differ materially from those anticipated in forward-looking or past performance statements. IC Markets makes no representation or warranty and assumes no liability as to the accuracy or completeness of the information provided, nor any loss arising from any investment based on a recommendation, forecast, or any information supplied by any third party.

Bullish reversal off overlap support?USDJPY is falling towards the support level, which is an overlap support that is slightly above the 618% Fibonacci retracement and also aligns with the 61.8% Fibonacci projection and could bounce from this level to our take profit.
Entry: 154.23
Why we like it:
There is an overlap support level that is slightly above the 618% Fibonacci retracement and also aligns with the 61.8% Fibonacci projection.
Stop loss: 153.04
Why we like it:
There is an overlap support that aligns with he 78.6% Fibonacci retracement and the 100% Fibonacci projection.
Take profit: 156.21
Why we like it:
There is an overlap resistance level.
Enjoying your TradingView experience? Review us!
Please be advised that the information presented on TradingView is provided to Vantage (‘Vantage Global Limited’, ‘we’) by a third-party provider (‘Everest Fortune Group’). Please be reminded that you are solely responsible for the trading decisions on your account. There is a very high degree of risk involved in trading. Any information and/or content is intended entirely for research, educational and informational purposes only and does not constitute investment or consultation advice or investment strategy. The information is not tailored to the investment needs of any specific person and therefore does not involve a consideration of any of the investment objectives, financial situation or needs of any viewer that may receive it. Kindly also note that past performance is not a reliable indicator of future results. Actual results may differ materially from those anticipated in forward-looking or past performance statements. We assume no liability as to the accuracy or completeness of any of the information and/or content provided herein and the Company cannot be held responsible for any omission, mistake nor for any loss or damage including without limitation to any loss of profit which may arise from reliance on any information supplied by Everest Fortune Group.
