USDJPY Potential DownsidesHey Traders, in today's trading session we are monitoring USDJPY for a selling opportunity around 155.900 zone, USDJPY is trading in a downtrend and currently is in a correction phase in which it is approaching the trend at 155.900 support and resistance area.
Trade safe, Joe.
USD

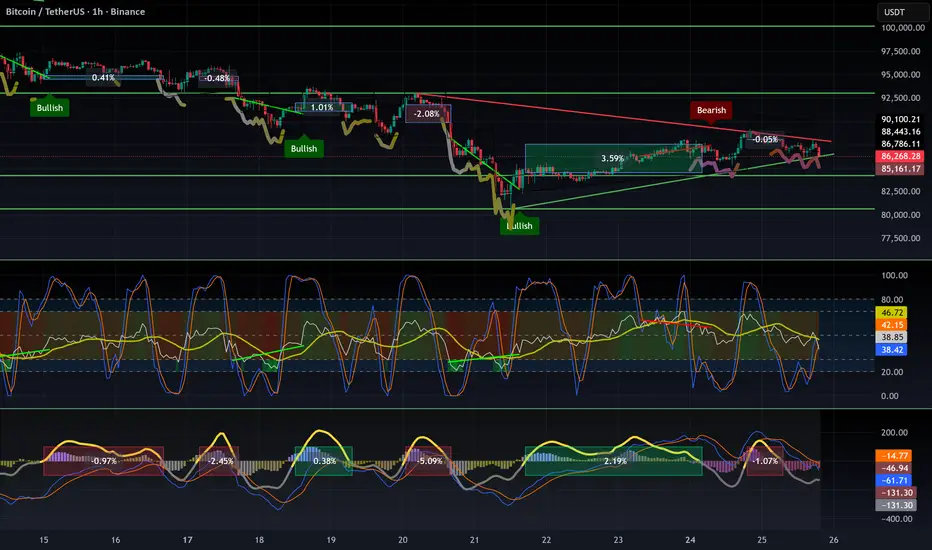
BTC: The Bitcoin bounce is not a trend reversal🚫 The Bitcoin bounce is not a trend reversal
Here’s why the current move looks more like a liquidity trap than a real bullish reversal:
- Momentum is lagging — the rebound isn’t supported by strength.
- Liquidity spikes look engineered to squeeze short positions rather than coming from genuine buyers.
- ETFs are selling while BTC is pumping → classic exit liquidity behaviour.
- We remain in a bearish trend, and the current flag pattern is on the verge of breaking. Statistically, these patterns break down, with targets equal to the size of the previous leg.
- Price is rising while volume is falling → this is a hidden bearish divergence on volume.
🎯 What I’m seeing
It looks like many institutions were caught off guard by the depth of this downtrend, and now they’re trying to reduce exposure.
They appear to be engineering a bounce to attract retail FOMO, allowing them to exit with smaller losses — a classic liquidity extraction move.
As I’ve mentioned several times already:
👉 The primary trend remains bearish until Q2 2026, though we should expect bounces and manipulative moves along the way.
⚠️ My advice
Don’t deploy all your capital into a fake FOMO rally and become the institutions’ exit liquidity.
Wait for a proper bottom confirmation, such as:
A W pattern, followed by a successful retest with a higher low.
❌ Invalidation
This analysis becomes invalid only if the current pattern breaks upward with strong volume.
DYOR
USD/JPY - H4 - Breakdown Watch!(29.11.2025)📝 Technical Description FX:USDJPY
USD/JPY has been moving inside a clean ascending channel on the H4 timeframe.
Price is now sitting inside the Reversal Zone, struggling to break above the channel’s mid-line resistance. A bearish correction is possible if the market fails to reclaim the upper zone.
This setup remains a pending order, and requires confirmation before execution.*
📊 Trading Plan (My View)🔻 Bearish Scenario (Primary Setup)
If price rejects the Reversal Zone, expect a bearish channel breakdown.
Target a correction toward the key support zones shown on the chart.
🎯 Key Levels
Reversal Zone: 156.300 – 156.500
Support Zone (Target): 153.093
⚠️ Today’s Fundamental Updates – 29 Nov 2025
1️⃣ Bank of Japan Policy Sentiment Shifts
BoJ Governor Ueda hinted that an interest rate increase may come sooner,
as the government boosts spending to stimulate the economy.
➡ This generally strengthens the JPY, increasing downside pressure on USD/JPY.
2️⃣ US Dollar Weakness Drivers
Rising expectations of rate cuts from the Federal Reserve.
Treasury yields softening due to recession worries.
➡ A weaker USD supports the bearish setup on USD/JPY.
📌 Summary
Strong channel resistance + bearish fundamentals on USD → JPY
= High-probability reversal correction setup once confirmation appears.
⚠️ Wait for breakout confirmation before entering.
⚠️ Disclaimer
This analysis is for education only.
Not financial advice. Always trade with proper risk management.
❤️ Support the Work
If this analysis helped you,👉 Please LIKE 👍 & COMMENT 💬
Your support motivates me to post more high-quality setups daily!
#usdjpy #forex #forexanalysis #priceaction #channelpattern #technicalanalysis
#fxsignals #tradingview #chartanalysis #jpy #boj #fundamentals #usdweakness #reversalpattern

Heading into key resistance?WTI Oil (XTI/USD) is rising towards the pivot, which acts as an overlap resitance and could reverse to the 1st support.
Pivot: 62.24
1st Support: 56.51
1st Resistance: 65.75
Disclaimer:
The opinions given above constitute general market commentary and do not constitute the opinion or advice of IC Markets or any form of personal or investment advice.
Any opinions, news, research, analyses, prices, other information, or links to third-party sites contained on this website are provided on an "as-is" basis, are intended to be informative only, and are not advice, a recommendation, research, a record of our trading prices, an offer of, or solicitation for, a transaction in any financial instrument and thus should not be treated as such. The information provided does not involve any specific investment objectives, financial situation, or needs of any specific person who may receive it. Please be aware that past performance is not a reliable indicator of future performance and/or results. Past performance or forward-looking scenarios based upon the reasonable beliefs of the third-party provider are not a guarantee of future performance. Actual results may differ materially from those anticipated in forward-looking or past performance statements. IC Markets makes no representation or warranty and assumes no liability as to the accuracy or completeness of the information provided, nor any loss arising from any investment based on a recommendation, forecast, or any information supplied by any third party.

Potential bullish bounce?Kiwi (NZD/USD) is falling towards the pivot and could bounce to the 1st resistance.
Pivot: 0.5682
1st Support: 0.5584
1st Resistance: 0.5838
Disclaimer:
The opinions given above constitute general market commentary and do not constitute the opinion or advice of IC Markets or any form of personal or investment advice.
Any opinions, news, research, analyses, prices, other information, or links to third-party sites contained on this website are provided on an "as-is" basis, are intended to be informative only, and are not advice, a recommendation, research, a record of our trading prices, an offer of, or solicitation for, a transaction in any financial instrument and thus should not be treated as such. The information provided does not involve any specific investment objectives, financial situation, or needs of any specific person who may receive it. Please be aware that past performance is not a reliable indicator of future performance and/or results. Past performance or forward-looking scenarios based upon the reasonable beliefs of the third-party provider are not a guarantee of future performance. Actual results may differ materially from those anticipated in forward-looking or past performance statements. IC Markets makes no representation or warranty and assumes no liability as to the accuracy or completeness of the information provided, nor any loss arising from any investment based on a recommendation, forecast, or any information supplied by any third party.

Bullish momentum to extend?USD/JPY is falling towards the pivot, which has been identified as a pullback support and could bounce to the 1st resistance.
Pivot: 154.41
1st Support: 151.03
1st Resistance: 158.33
Disclaimer:
The opinions given above constitute general market commentary and do not constitute the opinion or advice of IC Markets or any form of personal or investment advice.
Any opinions, news, research, analyses, prices, other information, or links to third-party sites contained on this website are provided on an "as-is" basis, are intended to be informative only, and are not advice, a recommendation, research, a record of our trading prices, an offer of, or solicitation for, a transaction in any financial instrument and thus should not be treated as such. The information provided does not involve any specific investment objectives, financial situation, or needs of any specific person who may receive it. Please be aware that past performance is not a reliable indicator of future performance and/or results. Past performance or forward-looking scenarios based upon the reasonable beliefs of the third-party provider are not a guarantee of future performance. Actual results may differ materially from those anticipated in forward-looking or past performance statements. IC Markets makes no representation or warranty and assumes no liability as to the accuracy or completeness of the information provided, nor any loss arising from any investment based on a recommendation, forecast, or any information supplied by any third party.

Bullish continuation?Loonie (USD/CAD) is falling towards the pivot which is an overlap support and could bounce to the 1st resistance.
Pivot: 1.3916
1st Support: 1.3761
1st Resistance: 1.4264
Disclaimer:
The opinions given above constitute general market commentary and do not constitute the opinion or advice of IC Markets or any form of personal or investment advice.
Any opinions, news, research, analyses, prices, other information, or links to third-party sites contained on this website are provided on an "as-is" basis, are intended to be informative only, and are not advice, a recommendation, research, a record of our trading prices, an offer of, or solicitation for, a transaction in any financial instrument and thus should not be treated as such. The information provided does not involve any specific investment objectives, financial situation, or needs of any specific person who may receive it. Please be aware that past performance is not a reliable indicator of future performance and/or results. Past performance or forward-looking scenarios based upon the reasonable beliefs of the third-party provider are not a guarantee of future performance. Actual results may differ materially from those anticipated in forward-looking or past performance statements. IC Markets makes no representation or warranty and assumes no liability as to the accuracy or completeness of the information provided, nor any loss arising from any investment based on a recommendation, forecast, or any information supplied by any third party.

Bullish bounce off major support?Swissie (USD/CHF) is falling towards the pivot and could bounce to the pullback resistance.
Pivot: 0.7875
1st Support: 0.7720
1st Resistance: 0.8165
Disclaimer:
The opinions given above constitute general market commentary and do not constitute the opinion or advice of IC Markets or any form of personal or investment advice.
Any opinions, news, research, analyses, prices, other information, or links to third-party sites contained on this website are provided on an "as-is" basis, are intended to be informative only, and are not advice, a recommendation, research, a record of our trading prices, an offer of, or solicitation for, a transaction in any financial instrument and thus should not be treated as such. The information provided does not involve any specific investment objectives, financial situation, or needs of any specific person who may receive it. Please be aware that past performance is not a reliable indicator of future performance and/or results. Past performance or forward-looking scenarios based upon the reasonable beliefs of the third-party provider are not a guarantee of future performance. Actual results may differ materially from those anticipated in forward-looking or past performance statements. IC Markets makes no representation or warranty and assumes no liability as to the accuracy or completeness of the information provided, nor any loss arising from any investment based on a recommendation, forecast, or any information supplied by any third party.

Headnig into pullback resistance?Cable (GBP/USD) is rising towards the pivot, which acts as a pullback resistance and could reverse to the 1st support, which has been identified as an overlap support.
Pivot: 1.3290
1st Support: 1.3002
1st Resistance: 1.3459
Disclaimer:
The opinions given above constitute general market commentary and do not constitute the opinion or advice of IC Markets or any form of personal or investment advice.
Any opinions, news, research, analyses, prices, other information, or links to third-party sites contained on this website are provided on an "as-is" basis, are intended to be informative only, and are not advice, a recommendation, research, a record of our trading prices, an offer of, or solicitation for, a transaction in any financial instrument and thus should not be treated as such. The information provided does not involve any specific investment objectives, financial situation, or needs of any specific person who may receive it. Please be aware that past performance is not a reliable indicator of future performance and/or results. Past performance or forward-looking scenarios based upon the reasonable beliefs of the third-party provider are not a guarantee of future performance. Actual results may differ materially from those anticipated in forward-looking or past performance statements. IC Markets makes no representation or warranty and assumes no liability as to the accuracy or completeness of the information provided, nor any loss arising from any investment based on a recommendation, forecast, or any information supplied by any third party.

Bearish reversal?Fiber (EUR/USD) is rising towards the pivot and could reverse to the swing low support.
Pivot: 1.1654
1st Support: 1.1403
1st Resistance: 1.1807
Disclaimer:
The opinions given above constitute general market commentary and do not constitute the opinion or advice of IC Markets or any form of personal or investment advice.
Any opinions, news, research, analyses, prices, other information, or links to third-party sites contained on this website are provided on an "as-is" basis, are intended to be informative only, and are not advice, a recommendation, research, a record of our trading prices, an offer of, or solicitation for, a transaction in any financial instrument and thus should not be treated as such. The information provided does not involve any specific investment objectives, financial situation, or needs of any specific person who may receive it. Please be aware that past performance is not a reliable indicator of future performance and/or results. Past performance or forward-looking scenarios based upon the reasonable beliefs of the third-party provider are not a guarantee of future performance. Actual results may differ materially from those anticipated in forward-looking or past performance statements. IC Markets makes no representation or warranty and assumes no liability as to the accuracy or completeness of the information provided, nor any loss arising from any investment based on a recommendation, forecast, or any information supplied by any third party.

Falling towards key support?USD/CAD is falling towards the support level which is an overlap support that i slightly below the 38.2% Fibonacci retracement and could bounce from this level to our take profit.
Entry: 0.8006
Why we like it:
There is an overlap support that i slightly below the 38.2% Fibonacci retracement.
Stop loss: 0.7968
Why we like it:
There is a pullback support level that aligns with the 61.8% Fibonacci retracement.
Take profit: 0.8067
Why we like it:
There is a pullback resistance level.
Enjoying your TradingView experience? Review us!
Please be advised that the information presented on TradingView is provided to Vantage (‘Vantage Global Limited’, ‘we’) by a third-party provider (‘Everest Fortune Group’). Please be reminded that you are solely responsible for the trading decisions on your account. There is a very high degree of risk involved in trading. Any information and/or content is intended entirely for research, educational and informational purposes only and does not constitute investment or consultation advice or investment strategy. The information is not tailored to the investment needs of any specific person and therefore does not involve a consideration of any of the investment objectives, financial situation or needs of any viewer that may receive it. Kindly also note that past performance is not a reliable indicator of future results. Actual results may differ materially from those anticipated in forward-looking or past performance statements. We assume no liability as to the accuracy or completeness of any of the information and/or content provided herein and the Company cannot be held responsible for any omission, mistake nor for any loss or damage including without limitation to any loss of profit which may arise from reliance on any information supplied by Everest Fortune Group.

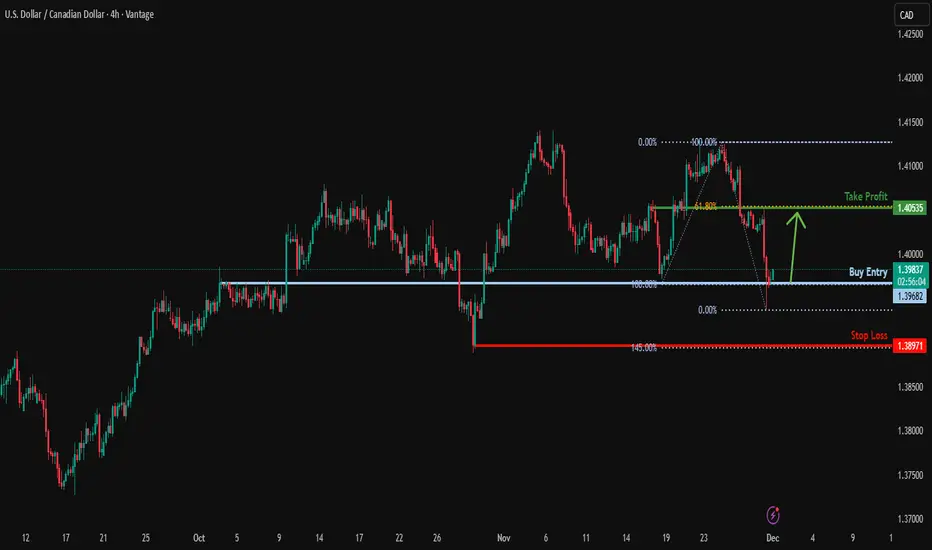
Potential bullish reversal?USD/CAD is reacting off the support level which is a pullback support and could bounce from this level to our take profit.
Entry: 1.3968
Why we like it:
There is a pullback support level.
Stop loss: 1.3897
Why we like it:
There is a swing low support level that aligns with the 145% Fibonacci extension.
Take profit: 1.4053
Why we like it:
There is a pullback resistance level that aligns with the 61.8% Fibonacci retracement.
Enjoying your TradingView experience? Review us!
Please be advised that the information presented on TradingView is provided to Vantage (‘Vantage Global Limited’, ‘we’) by a third-party provider (‘Everest Fortune Group’). Please be reminded that you are solely responsible for the trading decisions on your account. There is a very high degree of risk involved in trading. Any information and/or content is intended entirely for research, educational and informational purposes only and does not constitute investment or consultation advice or investment strategy. The information is not tailored to the investment needs of any specific person and therefore does not involve a consideration of any of the investment objectives, financial situation or needs of any viewer that may receive it. Kindly also note that past performance is not a reliable indicator of future results. Actual results may differ materially from those anticipated in forward-looking or past performance statements. We assume no liability as to the accuracy or completeness of any of the information and/or content provided herein and the Company cannot be held responsible for any omission, mistake nor for any loss or damage including without limitation to any loss of profit which may arise from reliance on any information supplied by Everest Fortune Group.
Bullish bounce off key supportGBP/USD is falling towards the support level, which is a pullback support that is slightly above the 38.2% Fibonacci retracement and could bounce from this level to our take profit.
Entry: 1.3194
Why we like it:
There is a pullback support that is slightly above the 38.2% Fibonacci retracement.
Stop loss: 1.3140
Why we like it:
There is a pullback support that is slightly above the 61.8% Fibonacci retracement.
Take profit: 1.3322
Why we like it:
There is a pullback resistance level that aligns with the 161.8% Fibonacci extension.
Enjoying your TradingView experience? Review us!
Please be advised that the information presented on TradingView is provided to Vantage (‘Vantage Global Limited’, ‘we’) by a third-party provider (‘Everest Fortune Group’). Please be reminded that you are solely responsible for the trading decisions on your account. There is a very high degree of risk involved in trading. Any information and/or content is intended entirely for research, educational and informational purposes only and does not constitute investment or consultation advice or investment strategy. The information is not tailored to the investment needs of any specific person and therefore does not involve a consideration of any of the investment objectives, financial situation or needs of any viewer that may receive it. Kindly also note that past performance is not a reliable indicator of future results. Actual results may differ materially from those anticipated in forward-looking or past performance statements. We assume no liability as to the accuracy or completeness of any of the information and/or content provided herein and the Company cannot be held responsible for any omission, mistake nor for any loss or damage including without limitation to any loss of profit which may arise from reliance on any information supplied by Everest Fortune Group.

Bullish bounce off?EUR/USD has bounced off the support level, which is a pullback support, and could rise from this level to our take profit.
Entry: 1.1552
Why we like it:
There is an overlap support level.
Stop loss: 1.1492
Why we like it:
There is a pullback support level.
Take profit: 1.1666
Why we like it:
There is a swing high resistance that aligns with the 100% Fibonacci projection.
Enjoying your TradingView experience? Review us!
Please be advised that the information presented on TradingView is provided to Vantage (‘Vantage Global Limited’, ‘we’) by a third-party provider (‘Everest Fortune Group’). Please be reminded that you are solely responsible for the trading decisions on your account. There is a very high degree of risk involved in trading. Any information and/or content is intended entirely for research, educational and informational purposes only and does not constitute investment or consultation advice or investment strategy. The information is not tailored to the investment needs of any specific person and therefore does not involve a consideration of any of the investment objectives, financial situation or needs of any viewer that may receive it. Kindly also note that past performance is not a reliable indicator of future results. Actual results may differ materially from those anticipated in forward-looking or past performance statements. We assume no liability as to the accuracy or completeness of any of the information and/or content provided herein and the Company cannot be held responsible for any omission, mistake nor for any loss or damage including without limitation to any loss of profit which may arise from reliance on any information supplied by Everest Fortune Group.

USD/JPY: Seeking a Swing LowThe daily chart of USD/JPY shows an established uptrend, though prices have been retracing lower for the past seven trading days. I am therefore on the lookout for a swing low in anticipation of a move back to at least 157.
The daily RSI (2) has not yet reached oversold and momentum on the lower timeframes is currently bearish. But with the 155 handle, 155.20 weekly VPOC and monthly pivot point at 155.62 nearby for potential support, perhaps a swing low is near.
Bulls could seek dips towards 155 in anticipation of a move top 157.
Matt Simpson, Market Analyst at City Index

Downfall of DXY?!? Bears Flag The Possibility!Here on TVC:DXY we can see that last week it ended in a Bearish Breakout of an Ascending Channel, the perfect Bear Flag scenario!
Now price closed the week on the ascent possibly being the Retest of the Breakout.
If the Channel holds price on a successful retest, TVC:DXY will drop!
Fundamentally, USD has impactful news all week this week. Even so, with limited data from back logged events not available until after next FOMC Meeting, this means the Federal Reserve will continue to make decisions in "the dark" and with a high probability of a Rate Cut coming in December!
If the Bear Flag is successful in being a continuation pattern set-up, we could see price drop down to the prior Low of November under 99!

4 Biggest trading opportunities this week This week presents several key events traders should keep a close eye on:
Korean inflation – Monday 6pm
The last reading for SK CPI came in at +2.4% year‑on‑year in October 2025, above the 2.1% expected by economists. Another surprise uptick might reinforce expectations of a rate pause (or even a re‑tightening), which could boost KRW.
Euro inflation – Tuesday 5am
Inflation data out of the eurozone will shape expectations for the European Central Bank (ECB). If inflation remains sticky or rises, it could bolster ECB hawkishness, strengthening EUR and European bond yields.
Australian GDP Growth – Tuesday 7.30am
Australia’s GDP report will offer a snapshot of the local economic picture. A strong GDP print could support the Australian dollar and lift demand for commodity‑linked assets, given Australia’s status as a major commodity exporter.
US PCE – Friday 10am
The upcoming release of the Personal Consumption Expenditures Price Index (PCE) matters because the Fed views it as its preferred inflation gauge. A hotter‑than‑expected PCE could reaffirm caution on rate cuts and lift USD, bond yields, and potentially weigh on risk assets.

XAUUSD: Channel Push Points to $4,220 as Next TargetHello everyone, here is my breakdown of the current Gold setup.
Market Analysis
Gold remains in a broader bullish structure, but the recent price action is developing inside a well-defined ascending channel, where price is currently moving from the lower boundary toward the upper one. After a sharp correction, XAUUSD found strong support at the $4,040 level, which aligns with the bottom of the channel and produced a fake breakout, signaling lack of bearish continuation.
Currently, price has started a new upward swing, respecting both the channel structure and the mid-line trend dynamics. However, despite the recovery, XAUUSD is still trading below the major $4,220 resistance, which previously acted as a strong reaction zone and remains the key obstacle for buyers.
My Scenario & Strategy
My scenario is bullish, as long as price stays above the support zone around $4,040 and maintains structure inside the ascending channel. I expect Gold to continue climbing toward the $4,220 resistance, where the upper channel boundary also converges, forming a strong confluence area.
Therefore, a clean breakout above $4,220 would open the way for higher targets and continuation of the broader trend. However, if price reaches this zone and shows strong rejection or weakness, we may see a pullback into the channel — but the bullish structure remains intact as long as the lower boundary holds. For now, the market supports a long bias, with the key objective being a retest of the $4,220 resistance zone, which is the next major level buyers are aiming for.
That's the setup I'm tracking. Thank you for your attention, and always manage your risk.

EURUSD Downside Outlook: Price Eyes Retest of 1.1540 Buyer ZoneHello traders! Here’s my technical outlook on EUR/USD based on the current market structure. After testing the Seller Zone near 1.16000–1.16200, the price once again faced rejection, forming a fake breakout around the descending Resistance Line. This confirms that sellers are still defending this area and keeping the pair inside a broader bearish structure. From there, EUR/USD pulled back toward the Buyer Zone, located between 1.15400–1.15000, which has acted as a reliable support area multiple times. The market is now moving inside a corrective pattern, showing weakening bullish momentum as it approaches support. As long as the pair trades below the Seller Zone and the descending trendline, bearish pressure remains dominant. The chart suggests a likely continuation toward the TP1 target at 1.15400, where buyers previously stepped in and produced notable recoveries. A clean bounce from this zone may trigger another short-term bullish correction — but without a breakout above 1.16000, any upside is likely to remain limited. A breakdown below 1.15400 could open the way for deeper declines toward lower support levels, while a confirmed breakout above the Seller Zone would shift short-term sentiment. Please share this idea with your friends and click Boost 🚀

EURUSD H1 | Bullish Bounce OffMomentum: Bullish
The price is falling towards the buy entry which aligns with the 50% Fibonacci retracement.
Buy entry: 1.1551
Strong overlap support
50% Fibonacci retracement
Stop loss: 1.1527
Pullback support
78.6% Fibonacci retracement
Take profit: 1.1605
Strong overlap resistance
High Risk Investment Warning
Stratos Markets Limited (tradu.com ), Stratos Europe Ltd (tradu.com ):
CFDs are complex instruments and come with a high risk of losing money rapidly due to leverage. 70% of retail investor accounts lose money when trading CFDs with this provider. You should consider whether you understand how CFDs work and whether you can afford to take the high risk of losing your money.
Stratos Global LLC (tradu.com ): Losses can exceed deposits.
Please be advised that the information presented on TradingView is provided to Tradu (‘Company’, ‘we’) by a third-party provider (‘TFA Global Pte Ltd’). Please be reminded that you are solely responsible for the trading decisions on your account. Any information and/or content is intended entirely for research, educational and informational purposes only and does not constitute investment or consultation advice or investment strategy. The information is not tailored to the investment needs of any specific person and therefore does not involve a consideration of any of the investment objectives, financial situation or needs of any viewer that may receive it. Past performance is not a reliable indicator of future results. Actual results may differ materially from those anticipated in forward-looking or past performance statements. We assume no liability as to the accuracy or completeness of any of the information and/or content provided herein and the Company cannot be held responsible for any omission, mistake nor for any loss or damage including without limitation to any loss of profit which may arise from reliance on any information supplied by TFA Global Pte Ltd.

GBPUSD H1 | Bullish Bounce Off Pullback SupportMomentum: Bullish
The price is falling towards the buy entry, which is slightly below the 38.2% Fibonacci retracement.
Entry: 1.3138
Pullback support
Slightly below 38.2% Fibonacci retracement.
Stop loss: 1.3108
Pullback support
61.8% Fibonacci retracement
Take profit: 1.3212
Multi swing high resistance
High Risk Investment Warning
Stratos Markets Limited (tradu.com ), Stratos Europe Ltd (tradu.com ):
CFDs are complex instruments and come with a high risk of losing money rapidly due to leverage. 70% of retail investor accounts lose money when trading CFDs with this provider. You should consider whether you understand how CFDs work and whether you can afford to take the high risk of losing your money.
Stratos Global LLC (tradu.com ): Losses can exceed deposits.
Please be advised that the information presented on TradingView is provided to Tradu (‘Company’, ‘we’) by a third-party provider (‘TFA Global Pte Ltd’). Please be reminded that you are solely responsible for the trading decisions on your account. Any information and/or content is intended entirely for research, educational and informational purposes only and does not constitute investment or consultation advice or investment strategy. The information is not tailored to the investment needs of any specific person and therefore does not involve a consideration of any of the investment objectives, financial situation or needs of any viewer that may receive it. Past performance is not a reliable indicator of future results. Actual results may differ materially from those anticipated in forward-looking or past performance statements. We assume no liability as to the accuracy or completeness of any of the information and/or content provided herein and the Company cannot be held responsible for any omission, mistake nor for any loss or damage including without limitation to any loss of profit which may arise from reliance on any information supplied by TFA Global Pte Ltd.

USDCHF H4 | Could We See A bounce From Here?Momentum: Bullish
Price is currently pulling back toward the buy entry, which sits slightly above the 38.2% Fibonacci retracement level.
Buy Entry: 0.8023
Pullback support
Slightly above the 38.2% Fibonacci retracement
Stop Loss: 0.7994
Pullback support
Aligned with the 50% Fibonacci retracement
Take Profit: 0.8066
Pullback resistance
High Risk Investment Warning
Stratos Markets Limited (tradu.com ), Stratos Europe Ltd (tradu.com ):
CFDs are complex instruments and come with a high risk of losing money rapidly due to leverage. 70% of retail investor accounts lose money when trading CFDs with this provider. You should consider whether you understand how CFDs work and whether you can afford to take the high risk of losing your money.
Stratos Global LLC (tradu.com ): Losses can exceed deposits.
Please be advised that the information presented on TradingView is provided to Tradu (‘Company’, ‘we’) by a third-party provider (‘TFA Global Pte Ltd’). Please be reminded that you are solely responsible for the trading decisions on your account. Any information and/or content is intended entirely for research, educational and informational purposes only and does not constitute investment or consultation advice or investment strategy. The information is not tailored to the investment needs of any specific person and therefore does not involve a consideration of any of the investment objectives, financial situation or needs of any viewer that may receive it. Past performance is not a reliable indicator of future results. Actual results may differ materially from those anticipated in forward-looking or past performance statements. We assume no liability as to the accuracy or completeness of any of the information and/or content provided herein and the Company cannot be held responsible for any omission, mistake nor for any loss or damage including without limitation to any loss of profit which may arise from reliance on any information supplied by TFA Global Pte Ltd.

AUDUSD H4 | Bearish Reversal Off 61.8% Fibonacci ResistanceMomentum: Bearish
The price is rising toward the sell entry, which aligns with the 61.8% Fibonacci retracement.
Sell entry: 0.6516
Strong overlap resistance
61.8% Fibonacci retracement
Stop loss: 0.6537
Pullback resistance
Slightly below the 78.6% Fibonacci retracement.
Take profit: 0.6465
Overlap support
High Risk Investment Warning
Stratos Markets Limited (tradu.com ), Stratos Europe Ltd (tradu.com ):
CFDs are complex instruments and come with a high risk of losing money rapidly due to leverage. 70% of retail investor accounts lose money when trading CFDs with this provider. You should consider whether you understand how CFDs work and whether you can afford to take the high risk of losing your money.
Stratos Global LLC (tradu.com ): Losses can exceed deposits.
Please be advised that the information presented on TradingView is provided to Tradu (‘Company’, ‘we’) by a third-party provider (‘TFA Global Pte Ltd’). Please be reminded that you are solely responsible for the trading decisions on your account. Any information and/or content is intended entirely for research, educational and informational purposes only and does not constitute investment or consultation advice or investment strategy. The information is not tailored to the investment needs of any specific person and therefore does not involve a consideration of any of the investment objectives, financial situation or needs of any viewer that may receive it. Past performance is not a reliable indicator of future results. Actual results may differ materially from those anticipated in forward-looking or past performance statements. We assume no liability as to the accuracy or completeness of any of the information and/or content provided herein and the Company cannot be held responsible for any omission, mistake nor for any loss or damage including without limitation to any loss of profit which may arise from reliance on any information supplied by TFA Global Pte Ltd.
