US Dollar: Look For Buys As The Pullback Ends!Welcome back to the Weekly Forex Forecast for the week of Nov. 17 - 21st.
In this video, we will analyze the following FX market: USD Dollar
The USD was in retracement last week. It looks like that may be ending, and a new bullish leg could potential start early this week.
Wait patiently for the bullish shift in the market at a key poi... like the Weekly +FVG highlighted in the video. The 1H TF should make this obvious, and look to long the USD against its currency counterparts.
Enjoy!
May profits be upon you.
Leave any questions or comments in the comment section.
I appreciate any feedback from my viewers!
Disclaimer:
I do not provide personal investment advice and I am not a qualified licensed investment advisor.
All information found here, including any ideas, opinions, views, predictions, forecasts, commentaries, suggestions, expressed or implied herein, are for informational, entertainment or educational purposes only and should not be construed as personal investment advice. While the information provided is believed to be accurate, it may include errors or inaccuracies.
I will not and cannot be held liable for any actions you take as a result of anything you read here.
Conduct your own due diligence, or consult a licensed financial advisor or broker before making any and all investment decisions. Any investments, trades, speculations, or decisions made on the basis of any information found on this channel, expressed or implied herein, are committed at your own risk, financial or otherwise.
Usdindexanalysis

Forex Traders Focus on Central Bank DecisionsForex Traders Focus on Central Bank Decisions
As expected, the Federal Reserve yesterday cut the Federal Funds Rate from 4.25% to 4.00%, while Jerome Powell’s remarks reduced the likelihood of further rate cuts. Meanwhile, decisions by other key central banks are also influencing the currency markets, according to Forex Factory:
→ The Bank of Canada lowered its policy rate from 2.50% to 2.25%, in line with market expectations. Its official statement highlighted risks of slower GDP growth, “continued weakness in the economy”, and concerns over U.S. trade relations and tariffs.
→ The Bank of Japan (BoJ) kept interest rates unchanged but signalled readiness to raise borrowing costs if economic conditions allow. This has shifted traders’ focus towards a possible rate hike as early as December.
→ The European Central Bank (ECB) is expected to leave its key rate steady, with the decision due at 16:15 GMT+3 today.
→ Next week, both the Reserve Bank of Australia and the Bank of England are scheduled to announce their policy decisions.
Against this backdrop, attention is increasingly turning to the Dollar Index (DXY) chart today.
Technical Analysis of the DXY Chart
On 19 September, we conducted a key analysis of the DXY chart, noting that:
→ The long-term downward channel (shown in red) remains relevant, divided into quarters by the intermediate QL and QH lines.
→ The index had rebounded from the QL line (marked by an arrow).
→ A bullish scenario was emerging.
Following that rebound, the price began to form an upward trajectory, reaching the upper boundary of the channel by 10 October — which, as anticipated, acted as strong resistance.
Currently, the DXY chart displays a narrowing triangle pattern, where:
→ The resistance is defined by the upper edge of the long-term descending channel that has contained the index’s 2025 movements.
→ The short-term upward channel from the September low remains intact.
This formation may reflect both the current balance of the U.S. dollar against a basket of major currencies and the uncertainty among analysts about its future direction.
Given the combination of central bank decisions, the U.S. government shutdown, geopolitical risks, and trade tensions, a breakout from this triangle could mark the start of a major trend lasting several weeks or even months.
Yesterday’s Fed decision strengthened the dollar, breaking through a local Bullish Flag pattern (shown in blue) and increasing the likelihood of further upward momentum.
This article represents the opinion of the Companies operating under the FXOpen brand only. It is not to be construed as an offer, solicitation, or recommendation with respect to products and services provided by the Companies operating under the FXOpen brand, nor is it to be considered financial advice.

US Dollar Index (DXY) Rises Ahead of Fed Chair’s SpeechUS Dollar Index (DXY) Rises Ahead of Fed Chair’s Speech
On Monday, we:
→ noted that the US Dollar Index (DXY) was consolidating at the start of a week packed with key events;
→ outlined a descending channel (shown in red);
→ highlighted that the price was trading around the channel’s median line, signalling a balanced market;
→ suggested that a test of one of the quarter lines (QL or QH), which divide the channel into four parts, could take place.
As the DXY chart indicates, since then the balance has shifted in favour of buyers, with the price forming an upward trajectory (shown in purple lines) and breaking through short-term resistance R (which has now turned into support, as marked by the blue arrow). Support line S remains relevant.
Today brings the key event that may have the greatest impact on the US Dollar Index (DXY) this week – Jerome Powell’s speech at the annual Jackson Hole Symposium.
This appearance is particularly significant because:
→ it is likely to be Powell’s last speech after seven years as Fed Chair, with his term expiring in May amid ongoing tensions with President Trump;
→ market participants will closely monitor the tone of his remarks, as a rate cut is expected in September, while recent economic data – namely the rise in the Producer Price Index – suggest that the US economy could face renewed inflationary pressures due to Trump’s tariffs.
Technical analysis of the DXY chart
From a bullish perspective, in the short term the US dollar is advancing within the purple channel, supported by:
→ the lower boundary of this channel;
→ the demand imbalance zone in favour of buyers (shown in green), confirmed by yesterday’s sharp bullish candle.
From a bearish perspective:
→ the RSI has entered overbought territory;
→ bullish momentum may fade after a breakout above the QH line;
→ a key resistance at the 99 level lies nearby – a level that reclaimed its role as resistance at the beginning of August (indicated by black arrows).
A corrective pullback in the US Dollar Index (DXY) could happen after its rally to the highest level since 6 August. However, the further trajectory will largely depend on Powell’s words this evening. According to Forex Factory, the speech is scheduled for 17:00 GMT+3.
This article represents the opinion of the Companies operating under the FXOpen brand only. It is not to be construed as an offer, solicitation, or recommendation with respect to products and services provided by the Companies operating under the FXOpen brand, nor is it to be considered financial advice.

DXY Eyes Breakout – Dollar Strength Gaining GroundThe U.S. Dollar Index (DXY) is testing its 50-day moving average on the daily chart, with bulls eyeing a potential breakout. A move above 98.75 could confirm a short-term trend reversal and open the path for further gains.
Stronger-than-expected U.S. economic data continues to support the greenback. Recent inflation prints, job market resilience, and solid retail spending have pushed back expectations for imminent Fed rate cuts. This shift in rate outlook provides fundamental support for the dollar.
In addition, strong U.S. corporate earnings are bolstering equity markets, attracting capital flows into U.S. assets and indirectly supporting dollar demand. Rising Treasury yields, especially on the short end, also offer more attractive returns for dollar-based investments.
Geopolitical uncertainties and trade tensions in Asia and Europe are prompting a rotation into the dollar as a safe-haven currency.
Meanwhile, some emerging market currencies are under pressure, increasing global demand for dollar liquidity.
Technically, a close above 98.75 could confirm bullish momentum, with 99.80 as the next upside target. As long as macro and risk dynamics lean in the dollar’s favor, DXY may continue its rebound from recent lows.
USD INDEXHello Traders.
This is my analysis for USD INDEX.
I am not a professional and I would be happy if you share your opinion in the comments.

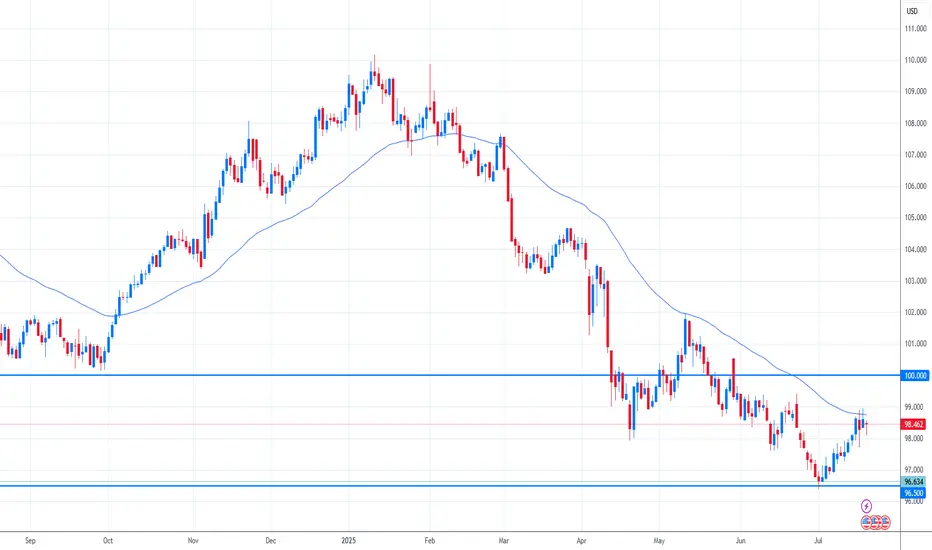
DXY Ready to Pop – Watch That 100 Break!After breaking below the key psychological level at 100 and making a low just under 98, the Dollar Index ( TVC:DXY ) has entered a consolidation phase.
Over the past three weeks, price has developed an inverted head and shoulders pattern, with the neckline perfectly aligning with the horizontal resistance at 100 — a strong zone of confluence from both a technical and psychological standpoint.
Despite the current hesitation under resistance, the structure suggests bullish potential. I believe we are approaching a breakout above 100, and once that happens, an acceleration to the upside is likely to follow.
🎯 Target: 102
🔒 Invalidation: A break below 98 would cancel the bullish bias.
As long as the price stays above the 98 area, I remain bullish and expect the dollar to strengthen.
🚀 The breakout hasn’t happened yet — but the pressure is building.

$USD Breaks Down – “Mission Accomplished” or Just Getting📉 The US Dollar Index ( AMEX:USD / TVC:DXY / $USINDEX) has officially broken beneath the multi-year support zone from 2020, right as Trump prepares to declare "Mission Accomplished".
From Inauguration to Liberation Day, and now the final stage: Meltdown.
🧭 Key Events Marked:
🟥 Inauguration
🟥 Trade War
🟥 Liberation Day
🟩 Mission Accomplished
🔻 Meltdown incoming?
📊 The breakdown aligns with a sharp spike in Nasdaq down volume (see chart). This isn't just a currency move — it's a market-wide stress signal.
Watch closely:
TVC:DXY below 99 = structural weakness.
Risk-on assets may melt up temporarily, but volatility could snap back fast.
Global currency pairs ( FX:EURUSD , FX:USDJPY , FX:GBPUSD ) are all on alert.

Weekly Forex Forecast Nov. 25-28th: USD INDEX Is Still Bullish!November 25 -28th
The DXY is still showing strength, but can pull back at any time. After breaching a Swing High, a pullback is naturally expected. But until it gives a bearish BOS, I am still buying the USD.
Don't be too quick to start selling!
Check the comments section below for updates regarding this analysis throughout the week.
Enjoy!
May profits be upon you.
Leave any questions or comments in the comment section.
I appreciate any feedback from my viewers!
Like and/or subscribe if you want more accurate analysis.
Thank you so much!
Disclaimer:
I do not provide personal investment advice and I am not a qualified licensed investment advisor.
All information found here, including any ideas, opinions, views, predictions, forecasts, commentaries, suggestions, expressed or implied herein, are for informational, entertainment or educational purposes only and should not be construed as personal investment advice. While the information provided is believed to be accurate, it may include errors or inaccuracies.
I will not and cannot be held liable for any actions you take as a result of anything you read here.
Conduct your own due diligence, or consult a licensed financial advisor or broker before making any and all investment decisions. Any investments, trades, speculations, or decisions made on the basis of any information found on this channel, expressed or implied herein, are committed at your own risk, financial or otherwise.

What if the USD rally is only just getting started?The USD rally has entered its seventh week and continues to defy its seasonal tendency to weaken in Q4. And that is simply because the macro backdrop 'Trumps' its average performance this time of the year. Today I take a step back to admire the bigger-picture view of the USD index, to show why I think this rally could still just be getting started.
MS

US DOLLAR INDEX (DXY) Expecting a BULLISH Move This WeekLooking for an Internal to External move this week.
Price is currently in a a +FVG, showing respect, and Friday's candle shows momentum towards the high of the previous week, which is the draw on liquidity.
Watch for the short term down move before the move up. Wed's opposing candle should act as support, and send price the other way.
LIKE, COMMENT or SUBSCRIBE if you like and want to see more analysis.
Thank you for viewing!

DXY 18May2023The mid-week DXY looks in accordance with the initial analysis, experiencing bullish entry into the impulse wave, if now is the period of wave C, and wave C usually consists of 5 waves, then wave 3 has at least the same length as wave 1. we can estimate the movement of the wave 3 using the Fibo Extension.

USD Dollar Index possible doubble btoomDemand zone for long 100.80-40. 14th April daily key reversal bar indication for strength ahead. Price in range between descending triangle. if breaks down demand level then possible for 0.9330.

A USD move lower will help Gold bullsThe USD is ranging in the near term but could easily move down into lows which would be supportive of Spot Gold and other USD denominated assets.

usd may falli still believe usdindex is making leg E of an expanding triangle and leg E are the most noisy, sometimes difficult to spot, so, if this is the case it should fall soon, not sure when but is better to anticipate worst scenario to be allways prepared and lower risks.


USD INDEXHello traders. I expect the price to rise again to $ 96 after reaching the $ 94.5 range and then complete the third wave of correction. Be profitable

DXYWave 5 of 3 is probably over, if it's true, we have ABC correction, it's not true, the price come back to up from here.


US DOLLAR INDEX READY FOR A MOVE DOWNUS Dollar index at a huge level of resistance so may give a push down to back the other currencies I'm looking at trading, USD index to push down would give EURUSD a nice upside move! Also a weaker US dollar will back my short bias on USDCAD. Anyone that doesn't use these index's as a reference I think should, it gives a good indication of how that currency is preforming.

USD Index Nearly Its Correctio Level, Let the marker correctUSD Index Nearly Its Correctio Level, Let the marker correct first, then we can carry buy the USD against all other major currencies except safe-haven assets again.
As an investor and trader, you should buy at a low price and close at a higher price if you can't win at buying and must not make a profit at selling.
From the present condition, 95/95.30 is identified as a rising channel trend-line resistance level. So, the Dollar index may go for a downward correction to 94/93.80 points. So, all the primary currencies may get strong against 70/100 pips against the USD.
So, before you sell any central pair like Eur/USD, GBP/USD, AUD/USD, and NZD/USD or sell USD/CAD and USD/CHF, I suggest you think first. Let the market complete the correction first, then enter. Otherwise, it will be costly.
USD index strong supports identified at 93.50./93.00 points. As long as the market is above 93.00 points, we can continue to buy the USD. Breaking below the 93.00 points, the USD index will change its trend, not before I think so. and the upside target is 96/97.00 in the upcoming days.

DXY , Where we are Hello guys
Are you ready for this week ??
In here , this idex is between these 2 R & S zone that shown on chart
But we have a key in chart ( key : the point of change trend ) , And now at this time the trend of idex is downward and we need best zone and area to take short position and sell
At first when the price is coming to our sell zone area then take signal like ... then take short position and sell
Dont forget use stop loss and attention to money management
Good Luck
Abtin

DXY DAILY TIMEFRAMESNIPER STRATEGY
DXY Daily Timeframe
So us dollar index is falling guys
I warn you again there might be pullbacks but it will pay off and rewarding the believers hugely
And once again start believing

DXY- A new leg up is more and more probable After reaching 89.20 low, Usd Index seemed to have found some life and corrected to 91 zone.
A new attempt from bears was met with strong buying in 90 zone and at this point, it looks like we have a higher low in place.
I expect a new leg of correction from DXY and my bullish bias will remain intact as long as 90 support is intact.
My target for Usd Index is 92 resistance and I will look to sell EurUsd and AudUsd and buy UsdCad into this correction
