Euro Under Pressure from Strong USDThe euro continues to show weakness against the dollar as global risk sentiment cools and investors shift toward safer assets. Market participants remain cautious ahead of key inflation data from the Eurozone and upcoming comments from Federal Reserve officials, which could clarify the next phase of U.S. monetary policy.
The recent euro recovery attempts have met consistent supply, reflecting pressure from subdued European growth and stronger U.S. economic resilience. The dollar remains supported by robust labor market conditions and persistent inflation expectations, which sustain demand for U.S. yields and Treasury assets.
Liquidity patterns suggest that institutions are still offloading positions near recent highs, keeping EUR/USD confined within a broader corrective cycle. Energy price fluctuations and diverging rate expectations between the ECB and the Fed continue to weigh on sentiment.
Overall, the pair remains under macroeconomic strain, with capital flows favoring the dollar as global markets seek stability amid geopolitical uncertainty and slowing global trade momentum.
DJ FXCM Index

USDJPY IDEA FOR 28, OCT 2025.The US Dollar against the Japanese Yen is still overall bullish but short-term bearish, which is currently trying to form an M pattern on the Daily timeframe and 4Hour respectively and also the market may be coming back down to clear a previous Gap of inactivity it had left behind during the previous trading weeks which will be propelled by new information and volume through News which is expected to be coming into the markets shortly at the beginning of the new trading month.

EURUSD Huge Bearish Divergence and Cross targets 1.12000.The EURUSD pair has been trading within a 3-year Channel Up since the September 28 2022 market bottom. On September 17 2025 it hit its top (Higher Highs trend-line) for the first time since the July 18 2023 High.
The current Bullish Leg has almost been the same as the previous one (around +18%) and is about to form a 1D MA50 (blue trend-line) - 1D MA100 (green trend-line) Bearish Cross. That will be the first such pattern since September 25 2023. Along with the already established 1D RSI Bearish Divergence, it is more likely to see the pattern start the new Bearish Leg now (max extension +18.28% at 1.20450).
The first Target of the previous Higher High rejection was the 0.5 Fibonacci retracement level. Our Target is again slightly above it at 1.12000.
-------------------------------------------------------------------------------
** Please LIKE 👍, FOLLOW ✅, SHARE 🙌 and COMMENT ✍ if you enjoy this idea! Also share your ideas and charts in the comments section below! This is best way to keep it relevant, support us, keep the content here free and allow the idea to reach as many people as possible. **
-------------------------------------------------------------------------------
💸💸💸💸💸💸
👇 👇 👇 👇 👇 👇

XAUUSD Bearish Short-Term, Bullish Longer-TermFundamental approach:
- Gold prices traded lower this week after setting fresh record highs earlier in Oct, pressured by profit-taking and cautious sentiment ahead of delayed US inflation data.
- Geopolitical uncertainty and expectations of further Fed easing continued to support underlying demand for safe havens in the longer term.
- US President Trump'sTrump's new sanctions on Russia and export restrictions toward China, alongside the prolonged US government shutdown, reinforced demand early in the week. At the same time, stabilization in trade rhetoric and rising yields curbed momentum later.
- However, a stronger US dollar and rising Treasury yields amid improved global risk appetite and optimism around an upcoming US. China dialogue also reduced safe-haven demand in the short term, especially with today's CPI, which is expected to rise.
Technical approach:
- Gold consolidated within the range of 4054-4113. The price is below the converging EMAs, indicating that a bearish momentum persists.
- If the XAUUSD breaches the support at 4054, the price may decline further toward the next support level at 3950.
- On the contrary, remaining above 4054 may prompt a retest of the upper range at 4143, confluenced with the EMA21.
Analysis by: Dat Tong, Senior Financial Markets Strategist at Exness

Bullish reversal?The US Dollar Index (DXY) is reacting off the pivot which aligns with the 50% Fibonacci retracement and could bounce from this level to the major resistance.
Pivot: 98.55
1st Support: 98
1st Resistance: 99.53
Disclaimer:
The above opinions given constitute general market commentary, and do not constitute the opinion or advice of IC Markets or any form of personal or investment advice.
Any opinions, news, research, analyses, prices, other information, or links to third-party sites contained on this website are provided on an "as-is" basis, are intended only to be informative, is not an advice nor a recommendation, nor research, or a record of our trading prices, or an offer of, or solicitation for a transaction in any financial instrument and thus should not be treated as such. The information provided does not involve any specific investment objectives, financial situation and needs of any specific person who may receive it. Please be aware, that past performance is not a reliable indicator of future performance and/or results. Past Performance or Forward-looking scenarios based upon the reasonable beliefs of the third-party provider are not a guarantee of future performance. Actual results may differ materially from those anticipated in forward-looking or past performance statements. IC Markets makes no representation or warranty and assumes no liability as to the accuracy or completeness of the information provided, nor any loss arising from any investment based on a recommendation, forecast or any information supplied by any third-party.

EUR/USD – Triangle Breakout (CPI Data ahead)EUR/USD – Buy Entry (M30- Channel Breakout Pattern)
The EUR/USD Pair, Price has been trading within a Triangle Breakout Pattern on the M30 chart, forming consistent higher highs and higher lows. Price action is now testing the upper boundary of the Pattern, signalling a possible breakout.
✅Market Context:
1️⃣Strong Upward Structure Inside the Pattern.
2️⃣Buyers are showing strength near Resistance.
3️⃣Breakout above the Trendline indicates Momentum continuation toward higher zones.
✅Trade Plan:
Entry: Buy after Confirmed Breakout above the Resistance (m30 candle close above trendline or retest of the breakout).
💰Take Profit (TP): At the Key Zone – a Major Resistance area identified ahead.
🛑Stop Loss (SL): Below the Pattern Structure.
✅Psychological Discipline :
1️⃣Stick to plan – No Revenge Trades.
2️⃣Accept losing trades as Part of the Strategy.
3️⃣Risk only 1–2% of your account balance per trade.
💬 Support the community: If you found this useful, drop a 👍 like and share your thoughts in the comments!
⚠️ Disclaimer: This analysis is for educational purposes only and does not constitute financial advice. Forex trading involves high risk. Trade only with capital you can afford to lose and always do your own research.

J.D. Vance and the market consequences of successionJ.D. Vance’s sudden rise to the Presidency could mark a dramatic shift for financial markets if he breaks from his current boss’s stance on how to govern an economy.
Before being picked as Trump’s VP, Vance was known for his opposition to corporate monopolies. In the past, he criticised the power of firms like Google, Apple, and Amazon, calling for antitrust enforcement. A sudden shift to a Vance-led administration could crash markets that have priced in continued support for the “Magnificent Seven,” who have driven much of the S&P 500’s recent performance. Ultimately, In the long run, however, breaking up dominant players can spark greater innovation (and potential stock gains), as the incumbents lose their ability to acquire and bury emerging competition.
Meanwhile, one of the defining trends of Trump’s second term has been the significant decline of the U.S. dollar. A change in leadership, especially one less inclined toward isolationist policies and piling on national debt, could potentially strengthen the dollar in the short term. Gold might also take a hit and find a medium-term price level below $4000.

My long USDCHF idea 27th of October 2025I see a very clear support and resistance zone here so it can be an easy in and out trade. I think price is way too over extended to the downside so we have room for it to bounce up a little.

USDCHF Huge Bullish Divergence like 2020.The USDCHF pair has recently broken above its 1D MA50 (red trend-line) for the first time since March 2025, following a long-term sharp decline. The multi-year pattern is a Channel Down and the current price action is taking place right on its bottom.
At the same time, while the price is on Lower Lows, the 1W RSI has been rising on Higher Lows, showcasing a huge Bullish Divergence. The last time we saw this happening at the bottom of this Channel Down, was between August - December 2020. That was the pattern's previous Lower Low bottom formation and after the 1D MA100 break-out took place, the pair started its new Bullish Leg that exceeded the 0.618 Fibonacci retracement level, while smashing through its 1W MA200 (orange trend-line).
As a result, we have turned bullish long-term on USDCHF, targeting the 0.618 Fib at 0.86750, expecting a contact with its 1W MA200 there.
-------------------------------------------------------------------------------
** Please LIKE 👍, FOLLOW ✅, SHARE 🙌 and COMMENT ✍ if you enjoy this idea! Also share your ideas and charts in the comments section below! This is best way to keep it relevant, support us, keep the content here free and allow the idea to reach as many people as possible. **
-------------------------------------------------------------------------------
💸💸💸💸💸💸
👇 👇 👇 👇 👇 👇

U.S. Dollar Index | Countertrend Break Aligning Toward ExpansionThe Market Flow | October 26, 2025
Technical Overview
Monthly:
• The bearish countertrend from the 108.50 pivot remains active but is slowing after completing a 138.2% Fibonacci projection.
• Price structure is consolidating above the 95.99 breakout base, showing early signs of phase rotation.
• A monthly close above 100.80 would confirm a higher timeframe structural shift.
Weekly:
• The down impulse reached the 138.2% target near 95.99 and turned higher into corrective structure.
• The active weekly pivot at 98.54 defines current bias.
• The correction phase persists toward the 38.2% retracement at 101.43 , with 106.64 as weekly expansion resistance.
• Structure favors continuation within a developing countertrend recovery channel.
Daily:
• The daily trend remains bullish above 98.54 , with higher lows intact.
• Price currently trades within the 61.8% Fibonacci retracement zone (98.75–98.85) , overlapping with the H4 expansion base — a structural sweet spot of alignment between the daily and H4 expansion phases.
• A sustained move above the green countertrend line confirms continuation toward 99.97 → 100.81 → 101.43 .
• The active daily pivot at 98.12 defines primary invalidation for the short-term bullish structure.
H4:
• Consolidation within the 61.8% Fibonacci zone supports accumulation before potential expansion.
• A confirmed H4 close above 99.25 (EXP) initiates the expansion phase toward 99.97 → 100.81 → 101.43 → 101.94 .
• Failure to hold 98.12 (D Pivot) neutralizes the short-term phase alignment and reopens 97.70 .
Trade Structure & Levels
• Bias: Long above 97.70
• Trigger = H4 > 99.25 → clean H4 breakdown (EXP line)
• Primary Invalidation = 98.12 (D Pivot)
• Secondary Invalidation = 98.54 (W Pivot)
• Path → 99.97 → 100.81 → 101.43
• Phase: Countertrend Break → Expansion Setup (Daily–H4 Confluence Zone)
Risk & Event Context
• U.S. macro data (PCE inflation, Treasury auctions, and Fed commentary) may drive volatility near key resistance zones.
• Momentum confirmation above 99.25 aligns all active timeframes in expansion phase.
Conclusion
DXY sits within a confluence of daily and H4 61.8% target Fibonacci zone — a structural sweet spot supporting continuation of the expansion phase. A H4 break above 99.25 would validate alignment across both timeframes, targeting the 100–101.40 zone.

USD/JPY) Bearish trend analysis Read The captionSMC Trading point update
Technical analysis of USD/JPY – Bearish Reversal Setup (4H Chart)
Technical Overview:
Instrument: USD/JPY
Timeframe: 4-Hour
Current Price: 152.86
Bias: Bearish Reversal
Next Target: 150.47
---
Chart Breakdown:
1. Liquidity Zone (Top Blue Box):
Price has tapped into a strong liquidity zone / supply area around 152.90 – 153.20, where previous highs were swept. This area acts as major resistance.
2. Rejection from Resistance:
After testing the upper liquidity region, the candle structure shows rejection wicks, indicating potential seller pressure and distribution phase.
3. Fibonacci Retracement Setup:
The retracement levels (0.5 – 0.79) highlight a probable correctional move. Price is expected to retrace back into the discount zone, around 151.00 – 150.50.
4. EMA Structure:
50 EMA (Blue): Currently acting as dynamic support (~151.77).
200 EMA (Black): Sits lower around 150.07, aligning perfectly with the next target area, strengthening the bearish projection.
5. Projected Move:
The chart suggests a short-term pullback after the rejection, followed by a deeper drop toward the demand zone near 150.50 (next target).
---
Trade Idea:
Sell Zone: 152.90 – 153.20 (liquidity area)
Target 1: 151.50 (near EMA 50)
Target 2: 150.50 (major demand zone)
MR SMC Trading point
---
Market Bias:
Bearish Bias – The liquidity sweep at the top, followed by lower-timeframe rejections, hints at a potential reversal or corrective phase toward the next major support.
---
Please support boost 🚀 this analysis

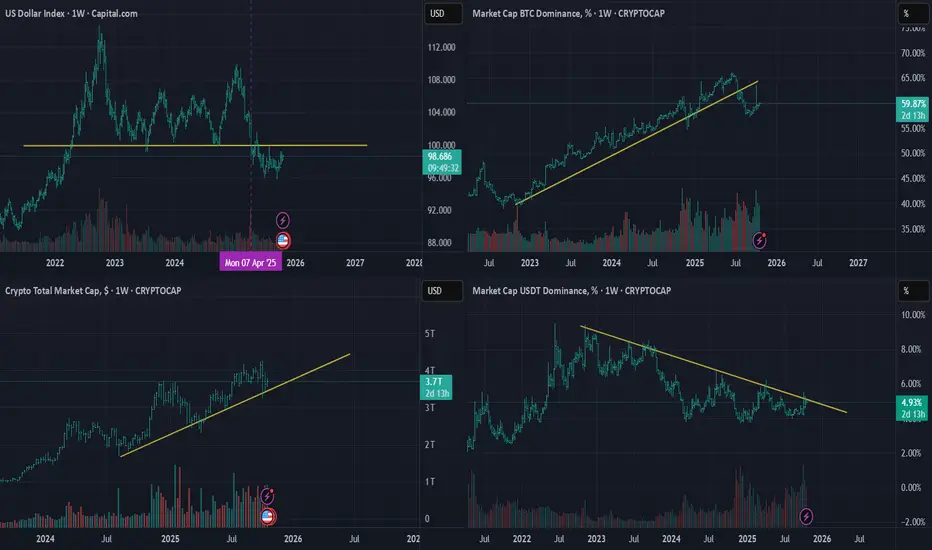
USD Index, BTC Domination, Crypto Total Market USDT Domination Hi everyone,
I just noticed a rare and exciting opportunity — the global market indexes are currently in sync in favor of altcoins.
All the charts are lining up perfectly, and to me, this looks like one of the best times to enter the market or add to your existing positions.
Wishing you all the best! :)
USD/CHF - Channel Breakout (24.10.2025) Setup Overview:
USD/CHF has completed a rising channel formation and is now showing signs of a bearish breakout below the lower trendline. The pair rejected the resistance zone near 0.7985 – 0.7970, confirming exhaustion in bullish momentum.
💡 Technical Setup:
Pattern: Rising Channel Breakout
Cloud Cross: Adds bearish confluence
Resistance Zone: 0.7985 – 0.7970
Trendline: Clear breakdown structure visible on 30-min timeframe
📉 Trading Plan:
Bias: Bearish below 0.7960
🟥 1st Support: 0.7925
🟥 2nd Support: 0.7906
Invalidation: A daily close above 0.7985 may negate this setup
📰 Market Context:
1.The U.S. dollar faces minor pullbacks as traders await upcoming inflation data and FOMC signals.
2.Swiss franc gains slight safe-haven demand amid geopolitical and risk market concerns.
3. Technically and fundamentally, short-term sentiment favors a downside correction on USD/CHF.
#USDCHF #Forex #TechnicalAnalysis #PriceAction #ChannelBreakout #BearishSetup #Ichimoku #TradingView #KABHI_TA_TRADING #ChartsDontLieTradersDontQuit #FXMarket #USD #CHF #TrendlineBreak #CloudCross
⚠️ Disclaimer:
This analysis is for educational purposes only — not financial advice. Please do your own research and use strict risk management when trading live markets.
📣 Support My Work
If you like my analysis — LIKE 👍, COMMENT 💬, and FOLLOW 🔔 for more daily Forex setups and updates!

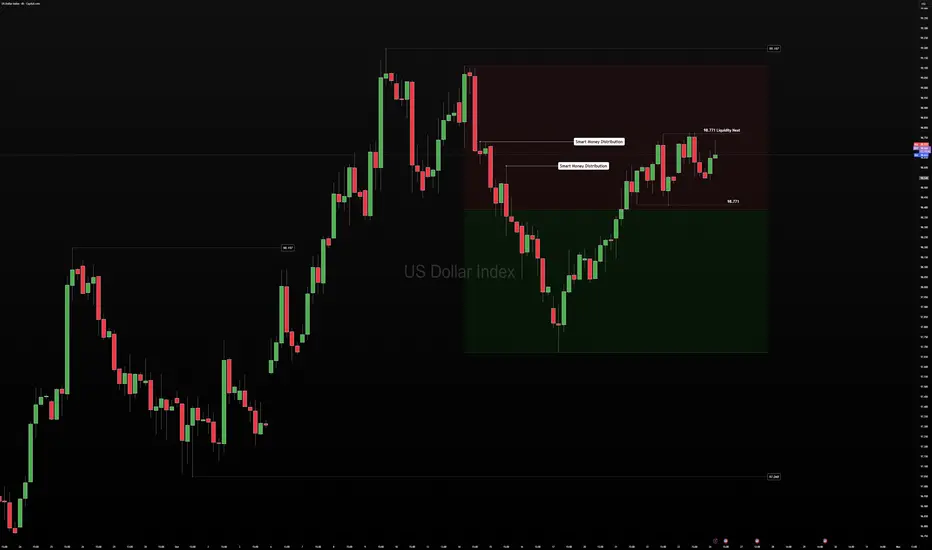
US Dollar — Pre-London Market NoteSmart Money Distribution — The Dollar’s Quiet Exit
🧭 Context
The U.S. Dollar Index is sitting in a premium range, absorbing liquidity near the highs.
This isn’t random — it’s the textbook signature of smart money distribution.
When professionals unload into late sellers and buyers end of week , the market looks stable… until it isn’t.
We’re watching the same pattern unfold into week’s end — a slow bleed of premium selling to generate liquidity for next week’s open.
📊 Technical Frame
Structure remains bearish on the weekly, bullish on the daily — a structural crossfire.
Retail eyes see a bounce; institutions see exit liquidity.
Dynamic structure math says: chasing longs here is paying premium for risk.
The 4H range low at 98.0 is under pressure; a sweep toward 98.77 during London would complete the liquidity cycle.
🌐 Fundamental Pulse
GDP and Core PCE ahead — both can shift yield expectations.
Yields up → stronger dollar, liquidity drains from risk assets.
Yields down → softer dollar, risk finds temporary relief.
This tug-of-war defines positioning — not headlines, but how liquidity behaves around them.
🧠 Trader’s Mindset
Smart money doesn’t predict — it prepares.
This week’s goal isn’t to be early; it’s to read how the distribution completes.
Patience preserves capital — and perspective.
💡 Takeaway
When everyone sees strength, the pros are already selling into it.
That’s smart money distribution in motion.
Learn to spot it, and you’ll stop donating to those who already have.
USOIL : Full analysisHello friends
Well, considering the sharp decline we had, the price has entered a descending channel and is slowly going down in this channel.
Now the price has reached a critical point, namely the bottom of the channel.
We need to see if buyers will support the price at the bottom of the channel like the previous two times or not?
If we do not see support from buyers and the channel is broken, we can expect lower prices.
56.30 and 53 dollars respectively.
But we will most likely see buyers' support in this area and the price could even reach the channel ceiling.
*Trade safely with us*

GBPUSD Channel Down targeting at least 1.3250The GBPUSD pair has been trading within a 1-month Channel Down pattern since the September 23 rejection on its 4H MA200 (orange trend-line). In fact, we are currently on the third Bearish Leg of this pattern, all of which have been initiated by 4H MA200 rejections.
We expect the price to target at least 1.3250, where it might technically rebound due to the presence of the 1D MA200 (red trend-line). If it breaks though, we can see a -2.07% standard Bearish Leg extension to 1.32000, which would make a perfect technical Lower Low at the bottom of the Channel Down.
-------------------------------------------------------------------------------
** Please LIKE 👍, FOLLOW ✅, SHARE 🙌 and COMMENT ✍ if you enjoy this idea! Also share your ideas and charts in the comments section below! This is best way to keep it relevant, support us, keep the content here free and allow the idea to reach as many people as possible. **
-------------------------------------------------------------------------------
💸💸💸💸💸💸
👇 👇 👇 👇 👇 👇

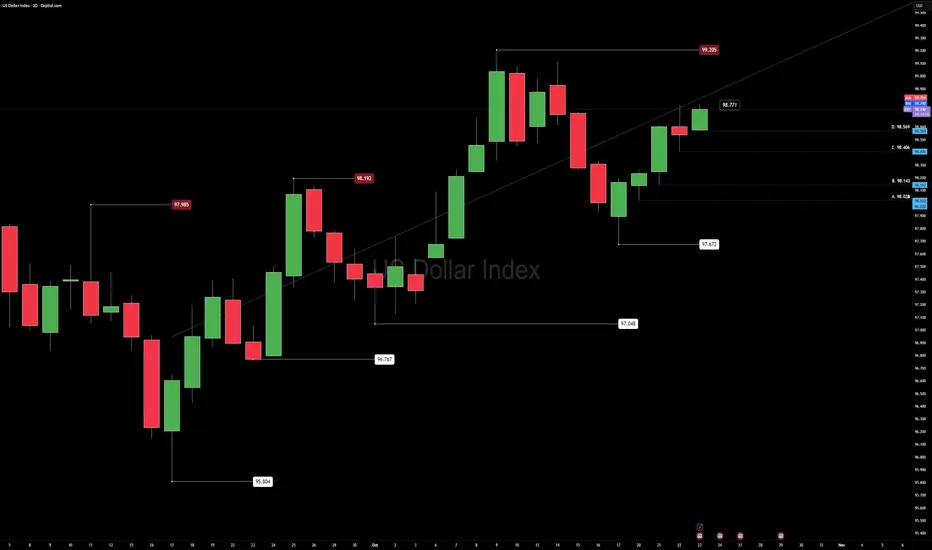
US DOLLAR AnalysisRespect the Higher Low: The Quiet Power of an Uptrend
U.S. Dollar Index (DXY) | 23 Oct 2025 | Pre–New York Session Outlook
By Daniel Fadeley
The U.S. Dollar continues to show a bullish bias, with higher lows forming consistently across both the weekly and daily structure. This ongoing strength keeps the broader tone positive for USD, while EURUSD and GBPUSD remain under cross-asset pressure.
We’re currently operating inside a bullish range with 97.672 as the range low and 99.205 as the range high.
Context
Momentum favors the dollar as buyers continue defending each pullback. If this month’s bullish structure holds, the market could confirm a longer-term upward phase.
However, conditions are slightly extended on Fibonacci sequence levels, suggesting reduced reward-to-risk for new swing positions until a clean retest offers better value.
Technical Map
Price took out yesterday’s high (98.771) and approaches the range ceiling at 99.205.
Volatility remains elevated through the week, and intraday momentum supports buy-the-dip behavior while daily lows continue to hold.
For cross-assets, this structure implies ongoing pressure on major USD pairs while the dollar holds above recent higher lows.
Fundamental Outlook
The week ahead features several key macro events:
U.S. GDP advance data
Core PCE inflation release
Multiple Federal Reserve speakers
Ongoing U.S. government funding discussions
Impact lens:
Yields rising → typically strengthens USD and tightens global liquidity.
Yields easing → can relieve pressure on risk assets such as equities and crypto.
Liquidity trends show ETF inflows slowing and capital rotating defensively, consistent with cautious macro positioning.
Plan
Current outlook remains bullish within range, focusing on position trades from defended lows and short-term rotational setups during volatility spikes.
Patience near 99.205 is key — a clean breakout with retest would confirm continuation; failure there could mean another controlled rotation inside the range.
Mindset
“Structure builds confidence. Clarity builds control.”
In fast markets, the goal is not prediction but preparation — follow structure, protect capital, and let confirmation lead conviction.
Educational use only — not financial advice.
Follow @CORE5DAN for calm, data-driven analysis and weekly structure lessons.
— CORE5DAN
Institutional Logic. Modern Technology. Real Freedom.
USD/JPY – Buy Entry (H1- Channel Breakout Pattern)
The USD/JPY Pair, Price has been trading within a Channel Breakout Pattern on the H1 chart, forming consistent higher highs and higher lows. Price action is now testing the upper boundary of the Pattern, signalling a possible breakout. FX:USDJPY
✅Market Context:
1️⃣Strong Upward Structure Inside the Pattern.
2️⃣Buyers are showing strength near Resistance.
3️⃣Breakout above the Trendline indicates Momentum continuation toward higher zones.
✅Trade Plan:
Entry: Buy after Confirmed Breakout above the Resistance (H1 candle close above trendline or retest of the breakout).
💰Take Profit (TP): At the Key Zone – a Major Resistance area identified ahead.
🛑Stop Loss (SL): Below the Pattern Structure.
✅Psychological Discipline :
1️⃣Stick to plan – No Revenge Trades.
2️⃣Accept losing trades as Part of the Strategy.
3️⃣Risk only 1–2% of your account balance per trade.
💬 Support the community: If you found this useful, drop a 👍 like and share your thoughts in the comments!
⚠️ Disclaimer: This analysis is for educational purposes only and does not constitute financial advice. Forex trading involves high risk. Trade only with capital you can afford to lose and always do your own research.

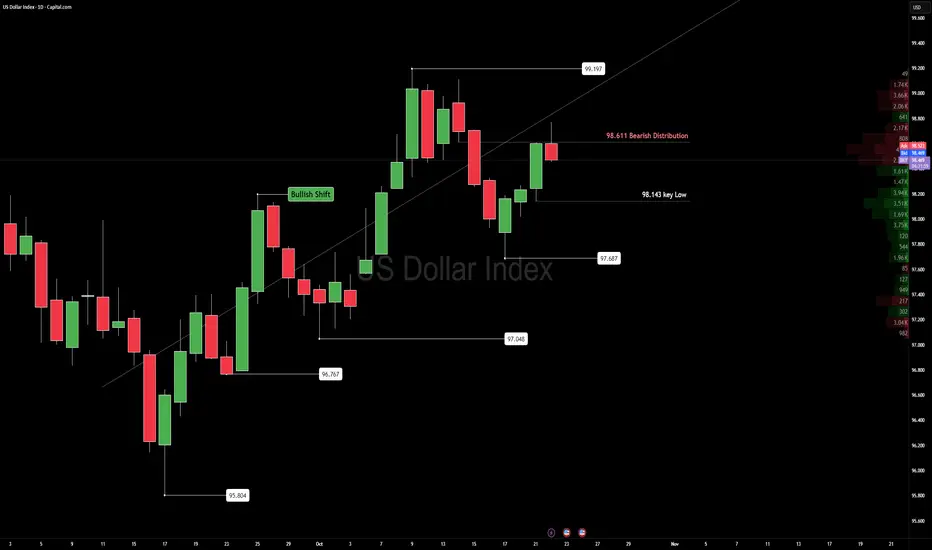
DXY UpdateDXY — Reaction at 98.611 Distribution Zone
The U.S. Dollar Index met firm resistance near 98.611, the same Bearish distribution area that capped momentum last week.
Price remains inside a wide daily range but shows the first sign of cooling after a strong stretch higher.
Below sits 98.143, the line that that changes chart bearish. Until then We are still good.
Acceptance under that level would confirm a structure shift and open space for continued rotation lower.
Upcoming jobless claims and Fed remarks may decide which side gains conviction.
For now, this is a market balancing inventory — not trending, just redistributing.
Trade confirmation, not anticipation.
Key levels:
98.611 — Distribution cap
98.143 — Structural pivot
— Institutional Logic. Modern Technology. Real Freedom.
BTCUSD SHORT Jan.1 You try, 2026. jan 1. Short position
Target 1
Target 2
Target 3
check out my profile!
Easy!

GBP/USD – Sell Entry (H1 – Channel Pattern)
The GBP/USD Pair, Price has been trading within a Channel Pattern on the H1 chart, forming consistent lower highs and lower lows. Price action is now testing the lower boundary of the pattern, signalling a possible breakdown.
✅Market Context:
1️⃣Downward structure building inside the pattern.
2️⃣Sellers are showing strength near support levels.
3️⃣Breakdown below the trendline indicates momentum continuation toward lower zones.
✅Trade Plan:
Entry: Sell after confirmed breakdown below the support (Candle close below trendline or retest of the breakout).
💰Take Profit (TP): At the Key Zone – major support area identified ahead.
🛑Stop Loss (SL): Above the pattern structure / recent swing high.
✅Psychological Discipline:
1️⃣Stick to plan – No Revenge Trades.
2️⃣Accept losing trades as part of the strategy.
3️⃣Risk only 1–2% of your account balance per trade.
💬 Support the community: If you found this useful, drop a 👍 like and share your thoughts in the comments!
⚠️ Disclaimer: This analysis is for educational purposes only and does not constitute financial advice. Forex trading involves high risk. Trade only with capital you can afford to lose and always do your own research.

GBP/USD - Fundamental Drive Ahead! (21.10.2025)🧠 Setup Overview:
GBP/USD has broken below its rising trendline after testing the 1.3470 resistance zone multiple times. The pair is under fundamental selling pressure, fueled by risk aversion and renewed U.S. dollar strength.
Fundamental Drivers:
1️⃣ U.S. markets gained as President Trump decided not to impose very high tariffs on Chinese goods, which temporarily boosted sentiment.
2️⃣ However, investors are now digesting U.S. credit risks and US–China trade tensions, both adding safe-haven demand to the USD.
3️⃣ Meanwhile, the UK economy faces uncertainty from softer consumer spending and weak housing data — further limiting GBP’s upside potential.
📉 Technical Plan:
Bias: Bearish below 1.3400
Structure: Trendline breakdown confirmed
Cloud Resistance: Adds confluence to downside momentum
Next Levels to Watch:
🟥 1st Support: 1.3349
🟥 2nd Support: 1.3310
📊 If price closes below 1.3349 on the 30-min chart, further selling pressure may extend toward 1.3310 and possibly deeper if fundamentals align.
#GBPUSD #Forex #TechnicalAnalysis #PriceAction #Ichimoku #TrendlineBreak #FXMarket #BearishSetup #TradingView #KABHI_TA_TRADING
⚠️ Disclaimer:
This analysis is for educational purposes only — not financial advice. Always manage your risk and use proper position sizing before entering any trade.
📣 Support My Work
If you found this analysis useful — LIKE 👍, COMMENT 💬, and FOLLOW 🔔 to stay updated with daily Forex setups!

US Dollar: Looking For Higher Prices This WeekWelcome back to the Weekly Forex Forecast for the week of Oct 20-24th.
In this video, we will analyze the following FX market: USD Dollar
The USD had a bearish week overall, but Friday's bullish close may hint towards the bias for this week. Potentially, we may see some continuation to the upside over the next couple of days.
Look at how price pulled back into the Daily Demand. This is a great place for the retracement to end ... and the new bullish leg to begin.
Wait for confirmations... like the failure of the -FVG. Then buys become valid.
Enjoy!
May profits be upon you.
Leave any questions or comments in the comment section.
I appreciate any feedback from my viewers!
Disclaimer:
I do not provide personal investment advice and I am not a qualified licensed investment advisor.
All information found here, including any ideas, opinions, views, predictions, forecasts, commentaries, suggestions, expressed or implied herein, are for informational, entertainment or educational purposes only and should not be construed as personal investment advice. While the information provided is believed to be accurate, it may include errors or inaccuracies.
I will not and cannot be held liable for any actions you take as a result of anything you read here.
Conduct your own due diligence, or consult a licensed financial advisor or broker before making any and all investment decisions. Any investments, trades, speculations, or decisions made on the basis of any information found on this channel, expressed or implied herein, are committed at your own risk, financial or otherwise.
