dow jones (us30) will %45 drop if...hello guys!
us30 there is in a long term ascending channel for sure...
but let look last recession closer:
what was conditions of last recession :
1- break down last lower low
2- fake out last lower low
3- before starting a downward movement break ma(200)
4- last lower low break ma(200) too
5- after break down drop until %45
On the other hand, what are the current conditions:
1- last lower low break ma(200)
2- price is near of ma(200) so we are waiting for a break down of ma(200)...
so, we get confirmation after ma(200) break down then we can get a lot of short position for indices and us shares:
let's look at us interest rate and United States Inflation Rate charts again!
i think everything is vivide in chart. what is your opinion about us30?
If you agree with my analysis or you are happy, please hit the "like" button and "follow"!
Usequities

Potential Rising Wedge Forming in S&PVery similar price action to May around the end of the month, there is a potential rising wedge forming into the 27th June coinciding with a backside retest of the 2 year uptrend channel that was finally broken back on the 13th June. Keep eyes peeled for indications of selling picking up into that area.

Bear Market is Far from OverCME_MINI:ES1!
In the past six months, the S&P 500 has fallen from an all-time high of 4,818.62 to a fresh 52-week low of 3,636.82, down 1,181.8 points, or -24.5%.
Following a brutal week, the U.S. stock market rose on Tuesday, as investors weighed the Fed rate hikes amid rising fears of a recession. The Dow rose 2.15%. The S&P popped 2.45%, and the Nasdaq climbed 2.51% at market close. Has the stock market correction ended?
Let’s look at a 5-year chart. The previous peak of S&P 500 was 3,383 on February 10, 2020. It hit bottom on March 23 at 2,177, down 35.6%. Since then, the S&P has a great run for nearly two years, up 121%, with very little hiccup along the way. The new high was 40% above the pre-pandemic high.
After recent steep fall, the S&P is still 400 points above the pre-COVID peak, which, in my view, is our first support line. If recession fear materializes into a real one, the post-COVID dip will become the second support. I believe that the bear market is far from over.
My reasoning bogs down into two essential questions:
1. Will Government policies be effective in controlling the runaway inflation?
2. Will U.S. economic growth be sustainable at current high price level?
On March 16, the Fed raised interest rates by 25 basis points (bps). A second hike followed on May 4, for 50 bps. On June 15, a big 75-bps move upped the Fed Fund Rate to 1.50%-1.75%. Meanwhile, U.S. inflation continues to rise. In May, the official Consumer Price Index rose 8.6% year-over-year. The core CPI (all items less food and energy) was also at a record high of 6.0%.
While aggressive Fed tightening could reduce the excess money supply, it could not affect the record gas price, nor the supply chain bottleneck from China.
President Biden will try to convince the Saudis to increase oil production during his visit. However, we need to understand it is the best interest of OPEC to maximize oil revenue. High oil price is good for them as long as it does not cause demand to decline. Besides, if Biden can’t control his own bike, do you really expect him to get OPEC to fall in line behind us?
Removing the Trump era tariff could bring some relief to U.S. consumers. However, the extent of imported goods covered by tariff reductions remains unclear. From policy discussion to actual implementation, it would take months before we see price drops on store shelves.
In a nutshell, my answer is NO for the first question.
As to the second question, even if the Fed succeeds in bringing down the inflation, will the U.S economy sustain its growth momentum?
Take the $5 gas price for instance. For an average family with two cars, the consumption of 100 gallons a month is budgeted at $500, and it is $200 more than when gas was $3/gallon. Record gas price has already resulted in less driving and reduced trips to grocery stores and supermarkets.
A major impact of Fed rate hikes is higher mortgage payments for millions of homeowners. For a family with a $400,000 house and $300,000 mortgage, a 6.5%, 30-year-fixed loan will require $1,900 interest payment per month. This is $380 more than when the mortgage rate was 4.5%.
High energy and mortgage costs trickle down to every corner of American life. Even if inflation is tamed, at current price level, everything is too costly for the economy to function properly. We need to have deflation, starting with energy and housing, to avoid a recession.
With headwinds to the economy and massive overhang over the stock market, I’m not optimistic for the near-term U.S. economic outlook.
A short position in CME E-Mini S&P 500 futures is a way to express this bearish view. The December (ESZ2) contract may be a good one, considering both liquidity factor and time to allow major market-moving events to play out. At 3,788.00, each contract has a notional value of $189,400 ($50 times index value). CME requires an initial margin of $10,500. Futures contract is marked to market daily. For a short position, a decline of 1 index point will result in $50 gain in your account balance because of the $50 multiplier. Likewise, an increase of 1 index point means a $50 reduction in your account.
If you don’t want to deal with the daily profit and loss accounting, consider a Long Put Option on the same E-Mini S&P futures contract. For example, the out-of-the-money 3685-strike (100 points below market) is currently quoted at $9.00. To buy an option requires $450, again because of the contract multiplier of 50.
When is the good time to place the order? The next market rebound. Put premium generally gets cheaper following a price rise in the underlying futures.
Happy Trading.
Disclaimers
*Trade ideas cited above are for illustration only, as an integral part of a case study to demonstrate the fundamental concepts in risk management under the market scenarios being discussed. They shall not be construed as investment recommendations or advice. Nor are they used to promote any specific products, or services.

Incoming months for S&P500A mid-year check of the S&P500 futures ES1! show an uncanny resemblance to the beginning of 2008. This has been reiterated by many already over the recent months, and it appears to continue as outlined by others too.
In the monthly log chart, there is an eerie resemblance that might bring the S&P500 to 2600-2800 levels, if by a similar magnitude to 2008-2009.
Market conditions are different, but even on a longer term monthly chart, you see the uncanny comparison.
Do not know what to make out of this, but on a probability basis, only two major outcomes...
First, is that it would follow similarly, hence 2600-2800 becomes a reality.
Second, it would break the pattern, and this would take something rather extraordinary to trigger it.
Either way, in the coming months, we can be expecting a single or a series of extraordinary events that would put the above two outcome scenarios in play... watch for it!

USEQUITIES potential for a pullback! | 29th March 2022Prices are approaching a pivot. We see the potential for a pullback from our sell entry at 3601.46 which is an area of Fibonacci confluences towards our Take Profit at 3502.79 in line with 23.6% Fibonacci retracement. Divergence is spotted on RSI, further supporting our bearish bias.
Any opinions, news, research, analyses, prices, other information, or links to third-party sites contained on this website are provided on an "as-is" basis, as general market commentary, and do not constitute investment advice. The market commentary has not been prepared in accordance with legal requirements designed to promote the independence of investment research, and it is therefore not subject to any prohibition on dealing ahead of dissemination. Although this commentary is not produced by an independent source, FXCM takes all sufficient steps to eliminate or prevent any conflicts of interest arising out of the production and dissemination of this communication. The employees of FXCM commit to acting in the clients' best interests and represent their views without misleading, deceiving, or otherwise impairing the clients' ability to make informed investment decisions. For more information about the FXCM's internal organizational and administrative arrangements for the prevention of conflicts, please refer to the Firms' Managing Conflicts Policy. Please ensure that you read and understand our Full Disclaimer and Liability provision concerning the foregoing Information, which can be accessed on the website.

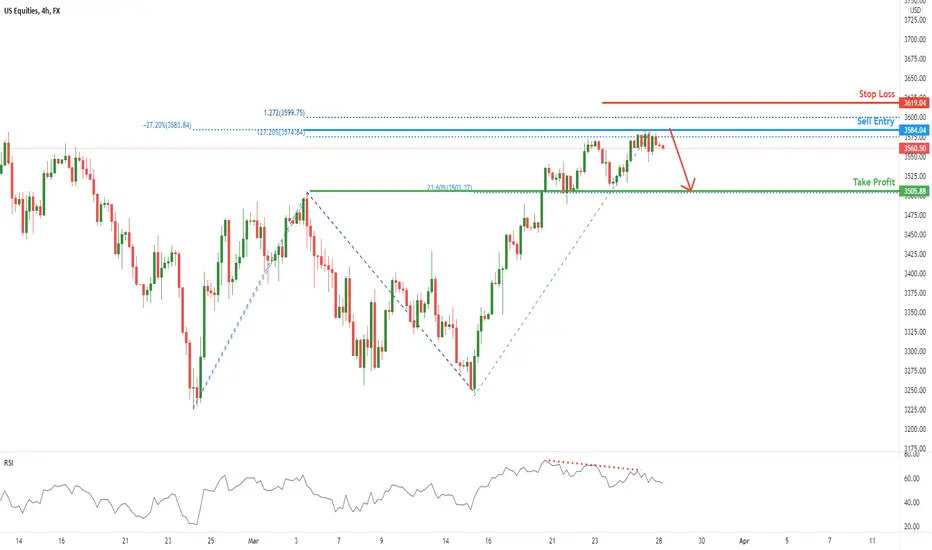
USEQUITIES potential for pullback! 28th March 2022Prices are at a pivot. We see the potential for a short entry at 3584 which is an area of Fibonacci confluences towards our Take Profit at 3505.88 in line with 23.6% Fibonacci retracement. RSI is showing bearish divergence.
Any opinions, news, research, analyses, prices, other information, or links to third-party sites contained on this website are provided on an "as-is" basis, as general market commentary, and do not constitute investment advice. The market commentary has not been prepared in accordance with legal requirements designed to promote the independence of investment research, and it is therefore not subject to any prohibition on dealing ahead of dissemination. Although this commentary is not produced by an independent source, FXCM takes all sufficient steps to eliminate or prevent any conflicts of interest arising out of the production and dissemination of this communication. The employees of FXCM commit to acting in the clients' best interests and represent their views without misleading, deceiving, or otherwise impairing the clients' ability to make informed investment decisions. For more information about the FXCM's internal organizational and administrative arrangements for the prevention of conflicts, please refer to the Firms' Managing Conflicts Policy. Please ensure that you read and understand our Full Disclaimer and Liability provision concerning the foregoing Information, which can be accessed on the website.
USEQUITIES potential for a pullback | 23rd March 2022Prices are experiencing a squeeze at our pivot. We see the potential for a short pullback from our sell entry at 3569.91. We see the potential for a pullback from our sell entry at 3543.36 in line with 23.6% Fibonacci retracement. RSI is at levels where dips previously occurred.
Any opinions, news, research, analyses, prices, other information, or links to third-party sites contained on this website are provided on an "as-is" basis, as general market commentary, and do not constitute investment advice. The market commentary has not been prepared in accordance with legal requirements designed to promote the independence of investment research, and it is therefore not subject to any prohibition on dealing ahead of dissemination. Although this commentary is not produced by an independent source, FXCM takes all sufficient steps to eliminate or prevent any conflicts of interest arising out of the production and dissemination of this communication. The employees of FXCM commit to acting in the clients' best interests and represent their views without misleading, deceiving, or otherwise impairing the clients' ability to make informed investment decisions. For more information about the FXCM's internal organizational and administrative arrangements for the prevention of conflicts, please refer to the Firms' Managing Conflicts Policy. Please ensure that you read and understand our Full Disclaimer and Liability provision concerning the foregoing Information, which can be accessed on the website.

USEQUITIES potential for a pullback | 22th March 2022Prices are consolidating in a potential double top. We see the potential for a dip from our sell entry at 3533.57 in line with 61.8% Fibonacci Projection towards our Take Profit at 23.6% Fibonacci Retracement. RSI is portraying divergence, further supporting our bearish bias.
Any opinions, news, research, analyses, prices, other information, or links to third-party sites contained on this website are provided on an "as-is" basis, as general market commentary, and do not constitute investment advice. The market commentary has not been prepared in accordance with legal requirements designed to promote the independence of investment research, and it is therefore not subject to any prohibition on dealing ahead of dissemination. Although this commentary is not produced by an independent source, FXCM takes all sufficient steps to eliminate or prevent any conflicts of interest arising out of the production and dissemination of this communication. The employees of FXCM commit to acting in the clients' best interests and represent their views without misleading, deceiving, or otherwise impairing the clients' ability to make informed investment decisions. For more information about the FXCM's internal organizational and administrative arrangements for the prevention of conflicts, please refer to the Firms' Managing Conflicts Policy. Please ensure that you read and understand our Full Disclaimer and Liability provision concerning the foregoing Information, which can be accessed on the website.

USEQUITIES potential for pullback! | 21st March 2022Prices have recently broken out of our descending trendline resistance and are on bullish momentum. We see the potential for bearish dip from our sell entry at 3539.23 which is an area of Fibonacci confluences towards our Take Profit at 3468.59 in line with 23.6% Fibonacci retracement.
Any opinions, news, research, analyses, prices, other information, or links to third-party sites contained on this website are provided on an "as-is" basis, as general market commentary, and do not constitute investment advice. The market commentary has not been prepared in accordance with legal requirements designed to promote the independence of investment research, and it is therefore not subject to any prohibition on dealing ahead of dissemination. Although this commentary is not produced by an independent source, FXCM takes all sufficient steps to eliminate or prevent any conflicts of interest arising out of the production and dissemination of this communication. The employees of FXCM commit to acting in the clients' best interests and represent their views without misleading, deceiving, or otherwise impairing the clients' ability to make informed investment decisions. For more information about the FXCM's internal organizational and administrative arrangements for the prevention of conflicts, please refer to the Firms' Managing Conflicts Policy. Please ensure that you read and understand our Full Disclaimer and Liability provision concerning the foregoing Information, which can be accessed on the website.

USEQUITIES on bearish momentum! | 3rd March 2022Prices are on bearish momentum. We see the potential for a dip from our sell entry at 3487.54 in line with 100% Fibonacci extension and 61.8% Fibonacci retracement towards our Take Profit at 3389.08 in line with 38.2% Fibonacci retracement . Our bearish bias is further supported by RSI being on bearish momentum.
Any opinions, news, research, analyses, prices, other information, or links to third-party sites contained on this website are provided on an "as-is" basis, as general market commentary, and do not constitute investment advice. The market commentary has not been prepared in accordance with legal requirements designed to promote the independence of investment research, and it is therefore not subject to any prohibition on dealing ahead of dissemination. Although this commentary is not produced by an independent source, FXCM takes all sufficient steps to eliminate or prevent any conflicts of interest arising out of the production and dissemination of this communication. The employees of FXCM commit to acting in the clients' best interests and represent their views without misleading, deceiving, or otherwise impairing the clients' ability to make informed investment decisions. For more information about the FXCM's internal organizational and administrative arrangements for the prevention of conflicts, please refer to the Firms' Managing Conflicts Policy. Please ensure that you read and understand our Full Disclaimer and Liability provision concerning the foregoing Information, which can be accessed on the website.

USEQUITIES on bearish momentum! | 3rd March 2022Prices are on bearish momentum. We see the potential for a dip from our sell entry at 3487.54 in line with 100% Fibonacci extension and 61.8% Fibonacci retracement towards our Take Profit at 3389.08 in line with 38.2% Fibonacci retracement. Our bearish bias is further supported by RSI being on bearish momentum.
Any opinions, news, research, analyses, prices, other information, or links to third-party sites contained on this website are provided on an "as-is" basis, as general market commentary, and do not constitute investment advice. The market commentary has not been prepared in accordance with legal requirements designed to promote the independence of investment research, and it is therefore not subject to any prohibition on dealing ahead of dissemination. Although this commentary is not produced by an independent source, FXCM takes all sufficient steps to eliminate or prevent any conflicts of interest arising out of the production and dissemination of this communication. The employees of FXCM commit to acting in the clients' best interests and represent their views without misleading, deceiving, or otherwise impairing the clients' ability to make informed investment decisions. For more information about the FXCM's internal organizational and administrative arrangements for the prevention of conflicts, please refer to the Firms' Managing Conflicts Policy. Please ensure that you read and understand our Full Disclaimer and Liability provision concerning the foregoing Information, which can be accessed on the website.

S&P500 OOPS...It appears that the S&P500 (futures, ES1!) decisively broke down a long time support that dates back to May 2020.
It is also below the 55EMA, and MACD with other technicals are downward biased, indicating a lower target than the recent lows.
Possible target of 4280 from now to end Feb.

GOOG D1 - Correction ShortGOOG D1
Really wouldn't mind seeing a deep correction here on Google, massive extensions seen from the lockdown lows in 2020 throughout March.
We saw aggressive bounce backs, and we have highlighted this each time we post out rundown and cover the S&P500. Corrections from swing lows to swing highs would be attractive to load up on longs again, as we approach that $3000 price we have started to slow down, hopefully first signs on a correction.

Bearish DIv on the DJIThe market is extremely overheated, overbought, and is reaching a peak.
US equities have been going up since March '20 and some traders are worried about a looming depression. The concern is valid. The government keeps printing money, spending money, raising the debt ceiling, COVID is STILL spreading, CDC changing guidance, tapering, interest rates, etc! YA-da-ya-da. IT feels like there are so many moving parts - how do you make sense of them?
You just look at the charts and cut out the noise!
After further review, the stock market is going to crash, it is just a matter of when and why. I believe the catalyst will be a news event that causes a massive sell-off, then, a dead cat bounce, followed by risk off event that sends US equities in a multiyear depression. Looking at the yearly chart of the $DJI from 1987-2021. There is massive bearish divergence there. There is even bearish divergence from '87-'21 on the RSI!
EVERYTHING is overbought. COVID accelerated the transition to digitization and increased people's dependence on the internet. People are saving way more now too which is why the velocity of money has decreased... people are buying assets, houses, gold, and bitcoin. People are waking up and realizing that the US government has been debasing our currency since 1970. And they will continue to do so! People want to own assets, people want to save, people want to be protected from inflation. Robinhood helped democratize trading and access to the stock market and retail has played an increasingly important role in the market.
I believe the market is set to crash next summer and that there will be a multiyear depression. Hyperinflation or stagflation seem to be the most likely scenarios as well. Runaway inflation will be the story. Biden's administration will be the scapegoat. Because let's be honest, every president is only concerned about one thing: getting RE-ELECTED. They don't care how much money they have to print, how much money they have to raise or how much debt they have to finance. Every politician, from Reagan, to Bush, to Obama to Biden, has continued to destroy the US currency. It will be no different with next president we "elect". In other words, Biden's administration is scapegoat for all of Washington and every state actor who has a role in fiscal and monetary policy.
The market is overvalued, propped up by fear and a QE, and is facing a whirlwind of negatives to start 2022. The companies that survive this multiyear depression, will come out twice as strong.
HODL. Buy Bitcoin.
Best of Luck,

SoFi Technologies IncSofi Technologies looks like it wants to rally.
If sentiment changes and money flows back in, there could be nice returns on offer here.
What I am seeing is a triple bottom, telling me that the bulls will take control.
Take profits at $22 (50% return)
Stop loss at $12

US Micro-Cap Breaking Out?Here in this position, it is clear that intensive work has gone into supporting the entire global recovery.
Moreover, we could already count the resilience in credit as ideal results from the covid siege. But now I want to focus on the US and small caps in particular are getting to work and the advance is leading to a more palpable exhaustion leg and opening some of the wildest trades for 2022 and beyond.
You can see this is not the same position in China or Hong Kong.
In the short and immediate term, we are witnessing capital rushing to park in US assets as the ONLY alternative. The pressure to park capital in 'safe assets' which are not threatened by the nanny state in the Far-East, Middle-East, Russia and now to a lesser extent Europe while it remains hijacked via Schwab. This more or less exhausts the options that we have and has clearly pinned both the Hang Seng and Shanghai Comp:
Sure the "migration of capital" from East to West is underway but the threat of US losing its hegemony is a multi-decade process.
I will be looking to fade the highs in US Microcaps from October time to ride profit taking into Q1 2022 before we start chapter two. Interested to gage the interest levels for ETFs here, if there is enough we can start to establish some levels, calls, and invalidation zones for IWC together in the comments.

US DOLLAR INDEX WILL BE BEARISHLast week I said that DXY will go bearish due to the fact that it was printing the same structure that was printed before. Because of this identical shapes, I mentioned that DXY will fall, repeating the same move that it made before. Unfortunately, we experienced a fake breakout that touched our SL.
It should not yet be dismissed that this move will not unfold. After the breakout of the monthly high, we saw price closing below the high on Friday. For me, this is a sign that, that was just a fake-out and the coming week we might see price dropping.
Traders, if you are trading this, I do really encourage to go in it softly, with reduced risks.
Do not forget to show support with a LIKE, FOLLOW and Comment if you enjoy my contents.

4 June: US30 bearish play is coming Technicals:
Price is testing the resistance zone, which is also in line with the fibonacci confluence area found. In terms of market structure, prices broke below the market structure and we could see further downside here. Take profit target would be based off the -27% and -61.8% retracement that was taken from the last move.
Fundamentals:
Market risk sentiment leans towards a more risk off session on Friday's as investors await US NFP data due later today. A better than expected reading could see the Dollar edge higher, while putting downward pressure on US equities as investors anticipate a shift in the Fed's dovish stance and tapering of bond purchases ahead of expectations. Recent ADP report recorded the highest number of jobs added in the US in 11 months and record service-sector growth and the dollar strengthens after the Fed announced on Wednesday of plans to begin unwinding corporate bond holdings acquired last year through an emergency lending credit facility gradually to minimise any potential impact on the markets.

Are you prepared for the END OF WAVE 5 in US Equities?If you have not been paying attention, get ready for some real volatility and big rotations/reversions in the markets.
It is time to put on your BIG BOY/GIRL pants because the markets just exited a simple upside trend bias and entered CHAOS with a new downtrend setting up.
If you don't know what to do, then you better start paying attention. This downtrend may last until 2025 or so and could extend a deep correction in the SPX500 to levels near $2200.
Don't play a fool with this new trend. I'm warning you right now - this one could be very violent and wicked.

Spy - possible breakout retestThis is a scenario I don't put too much faith in right now, as the bullish momentum seems completely unabated... but as we all know, markets can be tricky and fast in the face of complacence and leverage... so, in case an "event" (like ark blowing up or something of the likes) could bring spy to retest the early fall breakout 358/353ish making it the BTD opportunity of the year.


SPX DO NOT SHORT YETas long as this "buy the dip" hype continues , this market still can run up for another 15 to 20%.
wait for breakdown & confirmation for bearish confidence.
good luck.

DOWGOLD Ratio - SHORT; Look where it is sitting!What "global recovery"??... Are "they" serious? - Of course not. But it is entertaining, that much is true.
Going long Game Stop makes a great deal more sense than owning US equities - or any other, for that matter.
(At least a case can be made for he former .)
... and here is one (among many!), reasonably reliable Risk On(Off) FX pair ...
... which says that the title chart just hit the wall.
