USOIL Is Bullish! Long!
Please, check our technical outlook for USOIL.
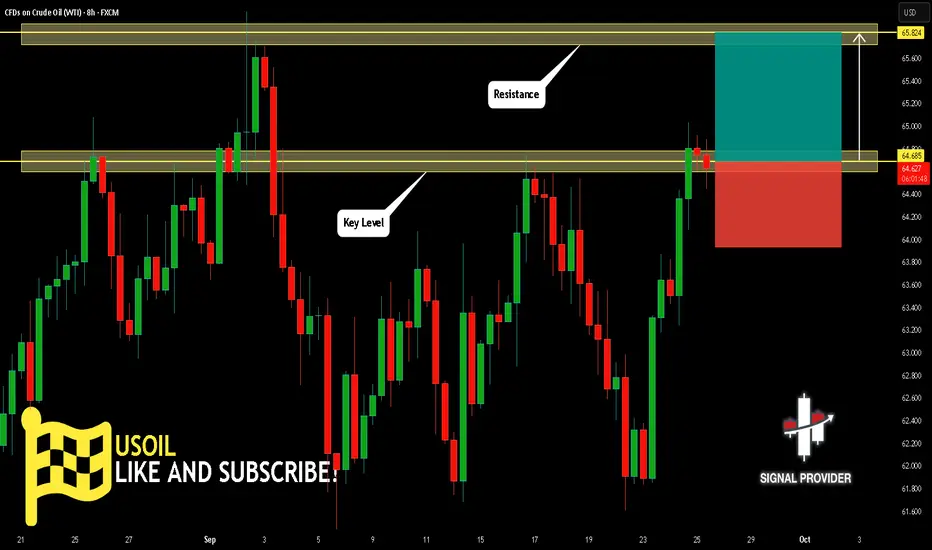
Time Frame: 8h
Current Trend: Bullish
Sentiment: Oversold (based on 7-period RSI)
Forecast: Bullish
The market is trading around a solid horizontal structure 64.685.
The above observations make me that the market will inevitably achieve 65.824 level.
P.S
The term oversold refers to a condition where an asset has traded lower in price and has the potential for a price bounce.
Overbought refers to market scenarios where the instrument is traded considerably higher than its fair value. Overvaluation is caused by market sentiments when there is positive news.
Like and subscribe and comment my ideas if you enjoy them!
Crude Oil WTI
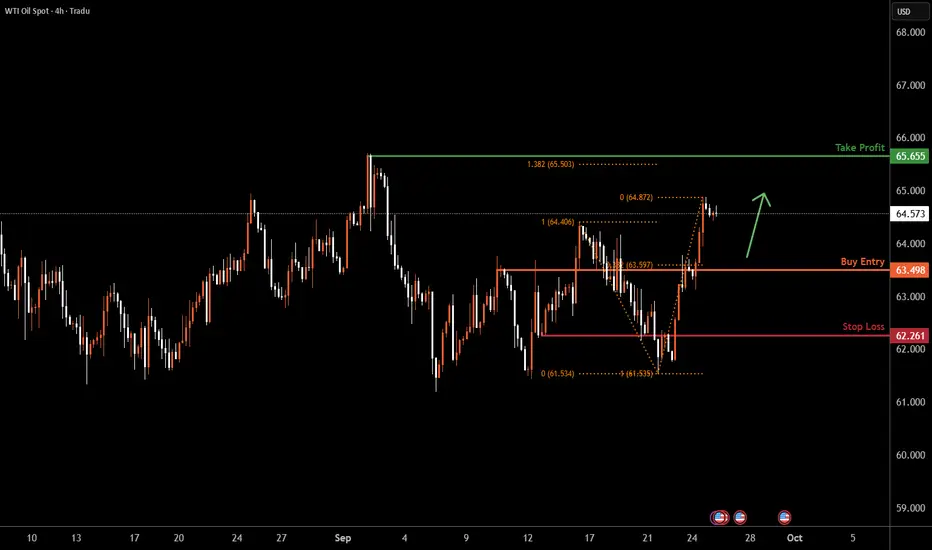
USOIL H4 | Falling towards 50% Fibonacci supportBased on the H4 chart analysis, we could see the price fall to the buy entry which is a pullback support that lines up with the 38.2% Fibonacci retracement and could bounce from this level to the take profit.
Buy entry is at 63.49, which is a pullback support that lines up with the 38.2% Fibonacci retracement.
Stop loss is at 62.26, which is a pullback support.
Take profit is at 65.65, which is a swing high resistance that is slightly above the 138.2% Fibonacci extension.
High Risk Investment Warning
Trading Forex/CFDs on margin carries a high level of risk and may not be suitable for all investors. Leverage can work against you.
Stratos Markets Limited (tradu.com ):
CFDs are complex instruments and come with a high risk of losing money rapidly due to leverage. 65% of retail investor accounts lose money when trading CFDs with this provider. You should consider whether you understand how CFDs work and whether you can afford to take the high risk of losing your money.
Stratos Europe Ltd (tradu.com ):
CFDs are complex instruments and come with a high risk of losing money rapidly due to leverage. 66% of retail investor accounts lose money when trading CFDs with this provider. You should consider whether you understand how CFDs work and whether you can afford to take the high risk of losing your money.
Stratos Global LLC (tradu.com ):
Losses can exceed deposits.
Please be advised that the information presented on TradingView is provided to Tradu (‘Company’, ‘we’) by a third-party provider (‘TFA Global Pte Ltd’). Please be reminded that you are solely responsible for the trading decisions on your account. There is a very high degree of risk involved in trading. Any information and/or content is intended entirely for research, educational and informational purposes only and does not constitute investment or consultation advice or investment strategy. The information is not tailored to the investment needs of any specific person and therefore does not involve a consideration of any of the investment objectives, financial situation or needs of any viewer that may receive it. Kindly also note that past performance is not a reliable indicator of future results. Actual results may differ materially from those anticipated in forward-looking or past performance statements. We assume no liability as to the accuracy or completeness of any of the information and/or content provided herein and the Company cannot be held responsible for any omission, mistake nor for any loss or damage including without limitation to any loss of profit which may arise from reliance on any information supplied by TFA Global Pte Ltd.
The speaker(s) is neither an employee, agent nor representative of Tradu and is therefore acting independently. The opinions given are their own, constitute general market commentary, and do not constitute the opinion or advice of Tradu or any form of personal or investment advice. Tradu neither endorses nor guarantees offerings of third-party speakers, nor is Tradu responsible for the content, veracity or opinions of third-party speakers, presenters or participants.
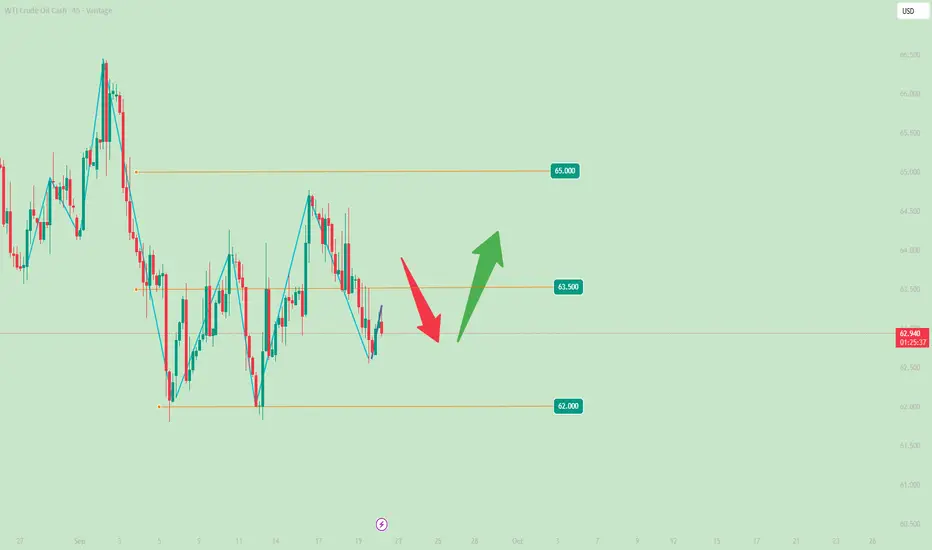
WTI Crude Oil🔹 I’ve marked the key resistance zones.
🔹 If I see a reversal signal at any of these levels, I’ll go short.
🔹 The breakout scenario is always valid too—if a level breaks, I’ll take the trade in the direction of the market.
🚫 No bias towards numbers, levels, or analysis.
✨ The key is to flow with the market, not fight it. If you try to stand against it, the market won’t just take your money—it will crush your confidence too.
🎯 We’re only a small part of a bigger picture. Stay flexible, stay unbiased.

WTI ShortThe alliance, including Russia and Saudi Arabia, agreed to a phased increase in production, which led to an increase in supply on the market.
OPEC+ production increase parameters
April 2025: Increase in production by 137,000 barrels per day
May-July 2025: Monthly increase of 411,000 barrels per day
August 2025: Increase by 548,000 barrels per day
September 2025: Increase by 547,000 barrels per day
October 2025: Planned increase by 137,000 barrels per day
OPEC+ plans to fully restore production cuts in 2023. Initially, a gradual increase in production was planned until September 2026, but due to favorable market conditions, the process was accelerated
US trade policy, which introduced customs duties on goods from many countries, also affects the price of oil
We expect a decline in the American grade of oil to $ 60

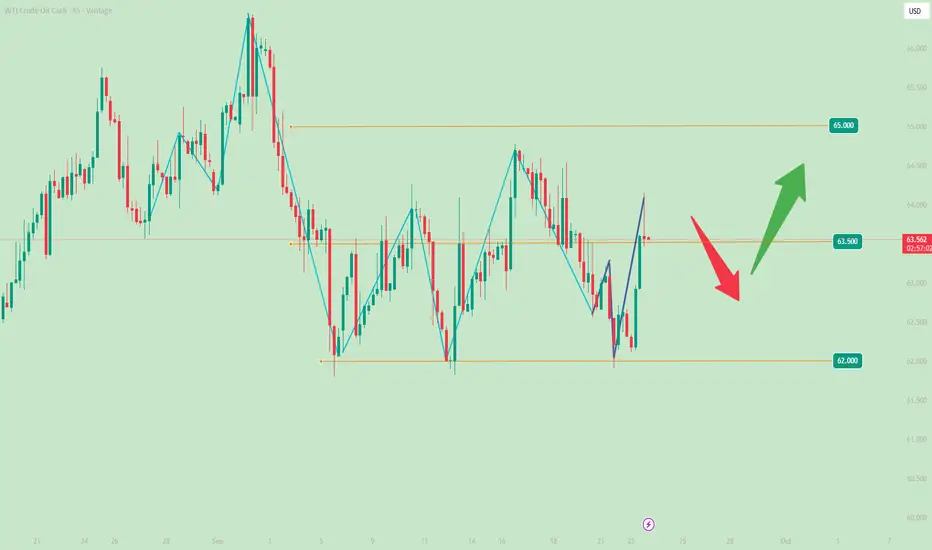
Crude oil:short-term longCrude oil continued to rally during the US session, with a series of bullish candles on the chart. Note that short positions are not viable—focus on taking profits to break even on pullbacks. The wide ranging oscillation on the daily chart remains unchanged. The watershed for the small cycle is at 63.5, and the trend watershed is at 65.
Buy 62.5 - 62.8
TP 64 - 64.5
SL 62
Daily-updated accurate signals are at your disposal. If you run into any problems while trading, these signals serve as a reliable reference—don’t hesitate to use them! I truly hope they bring you significant assistance

CRUDE OIL FREE SIGNAL|SHORT|
✅CRUDE OIL is going up now
But a strong resistance level is ahead at
Thus I am expecting a pullback and we
Will be able to enter a the following short trade:
------------------------
Entry: 86.500
Stop Loss: 86.700
Take Profit: 86.100
------------------------
SHORT🔥
✅Like and subscribe to never miss a new idea!✅

Pre Market Movers and News - BABA SurgingDiscussing some of the news related events today.
What do traders need to watch today?
Looking at SPY, Oil, Baba, NVDA, BE, MU, LAC

Will Tesla's stock price reach $600? Yes!
Hi my dears
I am at your service with Tesla stock analysis. This year and the following years, the stock growth trend will continue.
If you want to make big profits from the market, just follow my analysis.

WTI Crude Oil ReboundsWTI Crude Oil Rebounds
Crude oil is recovering and might rise toward the $64.30 resistance zone.
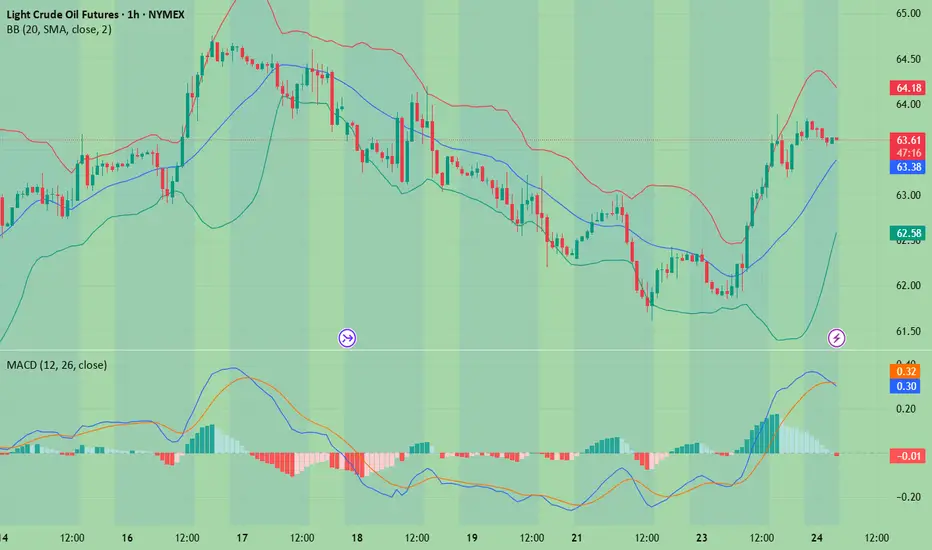
Important Takeaways for WTI Crude Oil Prices Analysis Today
- WTI Crude oil is recovering losses and trading above $62.60.
- There is a major bearish trend line in place with resistance near $63.65 on the hourly chart of XTI/USD.
WTI Crude Oil Price Technical Analysis
On the hourly chart of WTI Crude Oil, the price found support near $61.60 against the US Dollar. The price formed a base and started a recovery wave above $62.60 and the 50-hour simple moving average.
The bulls were able to push the price above the 50% Fib retracement level of the downward move from the $64.32 swing high to the $61.58 swing low. The hourly RSI is above the 60 level, but the price is struggling near $63.65.
Besides, there is a major bearish trend line in place with resistance near $63.65. It coincides with the 76.4% Fib retracement. A close above the trend line resistance might send the price toward the $64.32 high.
The next hurdle could be $65.00. A clear move above $65.00 could send the price toward $66.25. Any more gains might open the doors for a test of $68.00.
Conversely, the price might start a fresh decline from $63.65. Immediate support sits near $62.95. The key breakdown zone on the WTI crude oil chartmight be $62.60 and the 50-hour simple moving average.
If there is a downside break, the price might decline toward $62.60. Any more losses might encourage the bears for a push toward the $61.58 low.
This article represents the opinion of the Companies operating under the FXOpen brand only. It is not to be construed as an offer, solicitation, or recommendation with respect to products and services provided by the Companies operating under the FXOpen brand, nor is it to be considered financial advice.

WTI(20250924)Today's AnalysisMarket Analysis:
Federal Reserve Chairman Powell stated that the policy rate remains somewhat restrictive, but allows the Fed to better respond to potential economic developments; tariffs are expected to have a one-time pass-through effect; and decisions will "never be based on political considerations." Fed spokespersons noted that Powell's comments indicate that he believes interest rates remain tight, potentially opening the door for further rate cuts.
Technical Analysis:
Today's Buy/Sell Levels:
63.01
Support and Resistance Levels:
65.01
64.26
63.77
62.24
61.75
61.01
Trading Strategy:
On a break above 63.77, consider a buy entry, with the first target at 64.26.
On a break below 63.01, consider a sell entry, with the first target at 62.24
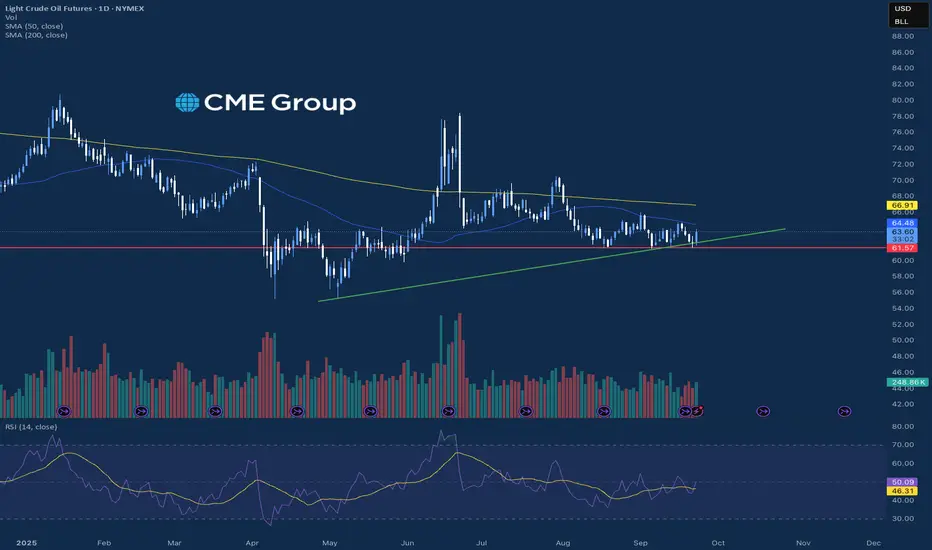
Equities Cooling From All Time HighsEquity Indices are seeing selling pressure into the close today marking the first down day of the week. The selling was led by the Nasdaq which traded down near 0.6% after being the most technically “overbought” of the equity indices on a daily basis. The economic data slate today showed PMI came in slightly worse than expected, and the markets slowly traded lower throughout the session before closing. Traders also heard remarks from Fed Chair Powell where he re-emphasized some of the points from the Fed meeting last week, and also said there is no risk-free path in balancing jobs and inflation.
Outside markets saw strong movements today as well, with the precious metals continuing to move higher, looking at Gold, Silver, and Copper all moving higher and Gold and Silver recording another new all time high price. Energy markets also saw a nice move higher today as Crude Oil and Natural Gas both traded up over 2% on the day. Tomorrow, we will see economic reports on New Home Sales along with Crude Oil Inventories that may add additional volatility into the markets.
If you have futures in your trading portfolio, you can check out on CME Group data plans available that suit your trading needs tradingview.com/cme/
*CME Group futures are not suitable for all investors and involve the risk of loss. Copyright © 2023 CME Group Inc.
**All examples in this report are hypothetical interpretations of situations and are used for explanation purposes only. The views in this report reflect solely those of the author and not necessarily those of CME Group or its affiliated institutions. This report and the information herein should not be considered investment advice or the results of actual market experience.
USOIL TodayThe recent core support level is around 62,today, the price briefly bottomed out at the 62 support level, but immediately bounced back upwards and failed to achieve a genuine downside breakout. if this level is breached, the price may retrace to the 60-61 range. Resistance levels are concentrated in the 65-66 zone. Based on recent technical data, the momentum indicators on the daily timeframe are showing signs of a weak rebound.
WTI key levels in play as oil prices bounceCrude oil is worth close attention. Prices have been consolidating within what appears to be a descending triangle formation — a pattern that typically signals continuation of a downtrend. But today we have seen a nice bounce off the key support area around $62, where prior lows align with the triangle’s base. While intraday wobbles have pierced this level, daily closes have generally respected it, making it the battleground to watch. A clean break beneath $62 would likely open the door for a deeper move towards $60, and potentially $55 if selling momentum gathers pace.
On the topside, the picture is equally clear. The area between $63.60 to 65.00, the grey-shaded resistance region, previously a pivot zone, has been a major resistance area in recent trade. The bearish trendline also intersects in this zone. To turn convincingly bullish on oil, we’d need to see a decisive breakout above that cluster of resistance.
By Fawad Razaqzada, market analyst with FOREX.com

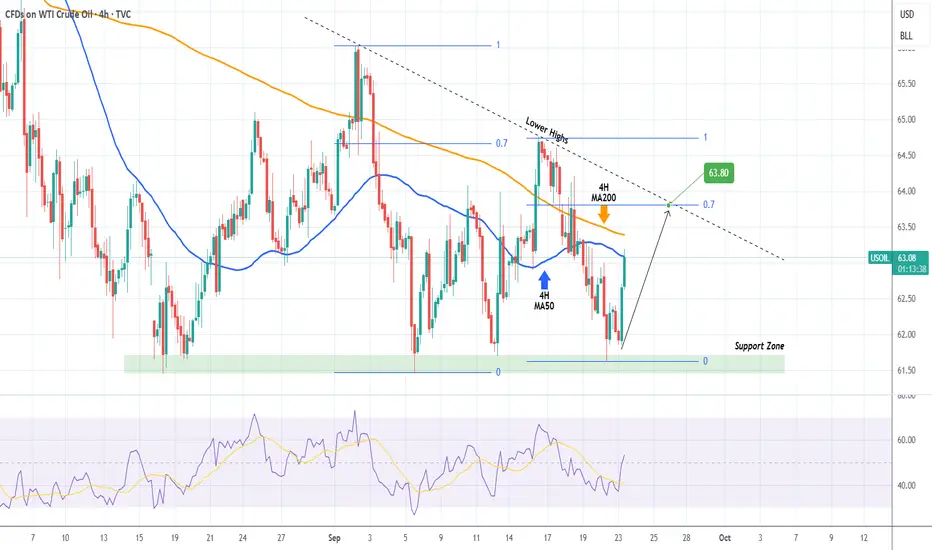
WTI OIL Descending Triangle targeting its top.WTI Oil (USOIL) has been trading within a Descending Triangle and following yesterday's test of its Support Zone, it is rebounding.
This Bullish Leg has already touches the 4H MA50 (blue trend-line) and based on the previous one, it should extend to at least the 0.7 Fibonacci retracement level.
This gives us a 63.80 Target before the pattern's Lower Highs trend-line is tested.
-------------------------------------------------------------------------------
** Please LIKE 👍, FOLLOW ✅, SHARE 🙌 and COMMENT ✍ if you enjoy this idea! Also share your ideas and charts in the comments section below! This is best way to keep it relevant, support us, keep the content here free and allow the idea to reach as many people as possible. **
-------------------------------------------------------------------------------
💸💸💸💸💸💸
👇 👇 👇 👇 👇 👇
Momentum Speaks: Crude Oil Buy OpportunityCrude Oil Momentum Buy Setup
4H & 15M Timeframe View
Crude Oil is respecting the channel lower boundary with reversal from 5460–5490 support zone.
Currently moving in momentum, with Supertrend also confirming buy-on-dip opportunity.
Watch for pullbacks near 5540–5550 support (Supertrend zone) for potential entries.
Thank you!


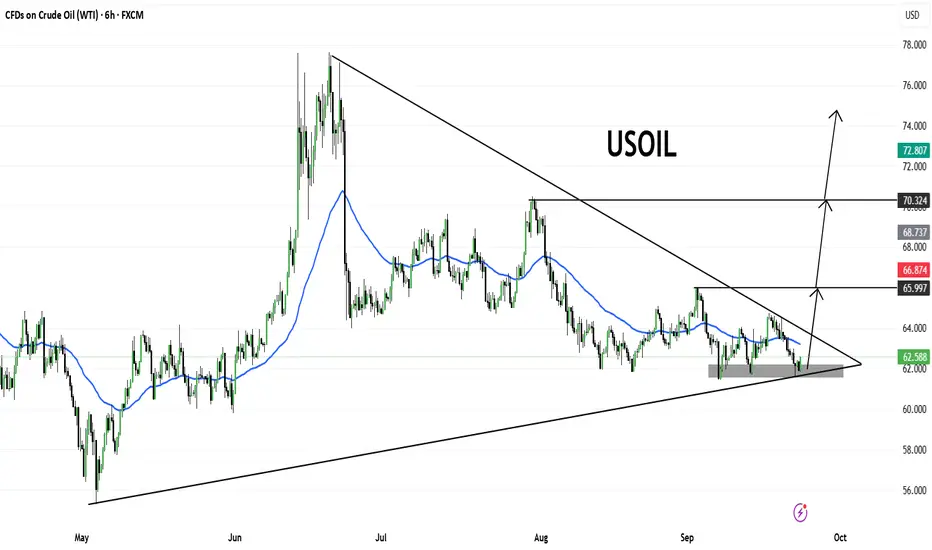
USOILPrice is consolidating inside a large symmetrical triangle pattern, with strong support forming around the $62.00–62.50 zone. A breakout is approaching as price nears the apex.
🔹 Key levels to watch:
Resistance zone: $65.99 – $66.87
Major breakout confirmation: $70.32
Upside target (if breakout sustains): $72.80 – $74.00
🔹 Bias:
As long as $62.00 holds, bulls may attempt a breakout towards the upper resistance trendline. A clean close above $66.87 could trigger momentum toward $70.32 and potentially $72+.
⚠️ However, a failure to hold $62.00 support may invalidate the bullish setup and push price lower.
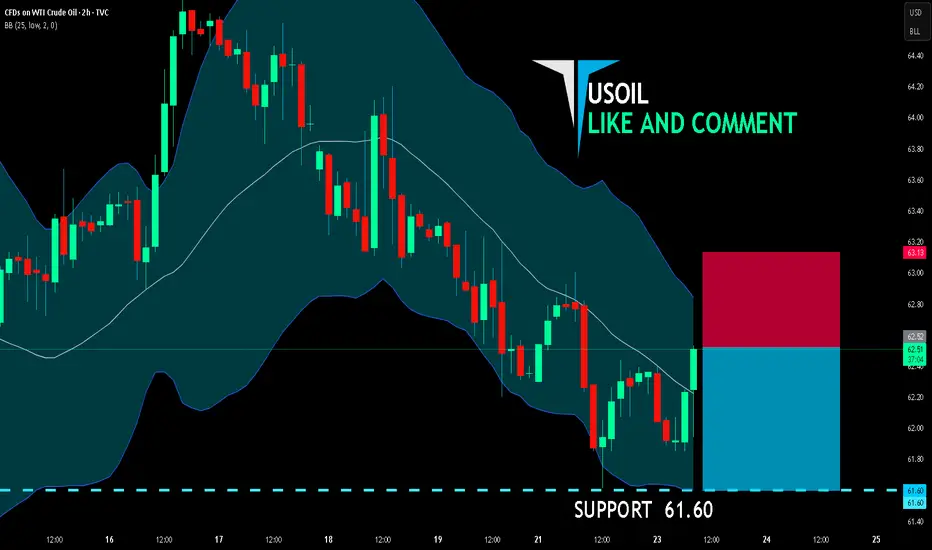
USOIL SHORT FROM RESISTANCE
USOIL SIGNAL
Trade Direction: short
Entry Level: 62.52
Target Level: 61.60
Stop Loss: 63.13
RISK PROFILE
Risk level: medium
Suggested risk: 1%
Timeframe: 2h
Disclosure: I am part of Trade Nation's Influencer program and receive a monthly fee for using their TradingView charts in my analysis.
✅LIKE AND COMMENT MY IDEAS✅
USOIL TodayToday the crude oil yet the key support level of 62 remained unbroken,We still predict that it will maintain an overall upward trend.
Buy 62.25 – 62.45
TP 62.75 - 62.95
SL 62.00
Daily-updated accurate signals are at your disposal. If you run into any problems while trading, these signals serve as a reliable reference—don’t hesitate to use them! I truly hope they bring you significant assistance
CRUDE OIL (WTI): Pullback Trade From Support
WTI Crude Oil looks oversold after a test of a significant
daily horizontal demand zone.
A formation of a bullish imbalance candle on an hourly time frame
indicates a strength of that structure.
With a high probability, the price will pull back to 62.38
❤️Please, support my work with like, thank you!❤️
I am part of Trade Nation's Influencer program and receive a monthly fee for using their TradingView charts in my analysis.

Hellena | Oil (4H): SHORT to support area of 60 (Wave 3).The price is still not reaching the target of 60. I decided to make a new forecast, slightly changing the labeling of waves, or rather their importance.
At this stage, as before, I think that the price will reach the area of the level 60 in the middle wave “3”.
This movement is the development of the big corrective wave “C”. In general, the plan remains the same.
Manage your capital correctly and competently! Only enter trades based on reliable patterns!

WTI(20250922)Today's AnalysisMarket News:
Federal Reserve Board Governor Milan: Expects continued rate cuts in the coming months and will work to convince other policymakers to cut more quickly; Minneapolis Fed President Neel Kashkari: Two more rate cuts this year would be appropriate.
Technical Analysis:
Today's Buy/Sell Levels:
62.58
Support and Resistance Levels:
63.70
63.28
63.01
62.15
61.87
61.45
Trading Strategy:
If the market breaks above 62.58, consider buying, with the first target at 63.01.
If the market breaks below 62.15, consider selling, with the first target at 61.87

CRUDE OIL LONG FROM SUPPORT|
✅CRUDE OIL is going down to retest
A horizontal support around 61.80$
Which makes me locally bullish biased
And I think that we will see a rebound
And a move up from the level
Towards the target above at 62.80$
LONG🚀
✅Like and subscribe to never miss a new idea!✅
