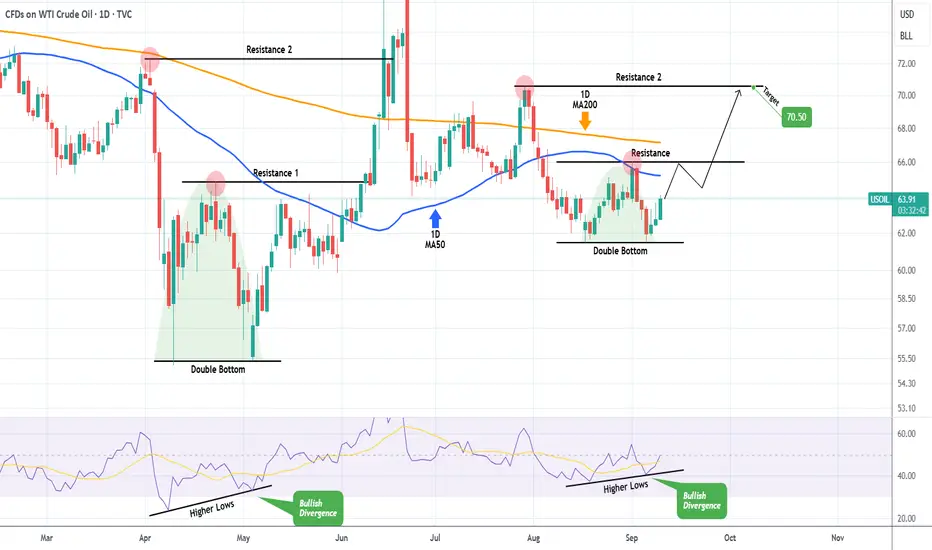
WTI OIL Recent fractal calls for a buy towards $70.50.WTI Oil (USOIL) is on the 3rd straight green 1D candle following a Double Bottom bounce on the 61.50 Support. At the same time the 1D RSI formed Higher Lows, which is a Bullish Divergence.
The same set of conditions emerged on the May 05 bottom rebound, which resulted into initially a 1D MA50 (blue trend-line) test and then a Resistance 2 contact.
As a result, we expect this rise to continue, targeting $70.50.
-------------------------------------------------------------------------------
** Please LIKE 👍, FOLLOW ✅, SHARE 🙌 and COMMENT ✍ if you enjoy this idea! Also share your ideas and charts in the comments section below! This is best way to keep it relevant, support us, keep the content here free and allow the idea to reach as many people as possible. **
-------------------------------------------------------------------------------
💸💸💸💸💸💸
👇 👇 👇 👇 👇 👇
Crude Oil WTI
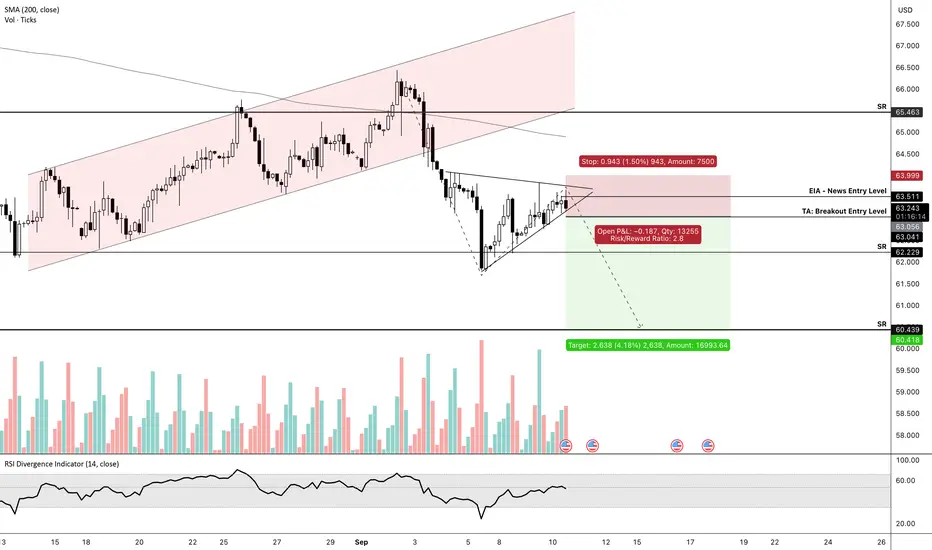
USOIL Trade Setup📢 NFX Trade Alert – Swing Setup
💹 Instrument: FX:USOIL Crude Oil (WTI-USD)
🛒 Trade Type: Swing – Sell at Market
📍 Entry: $63.50
⛔ Stop Loss: $64.00
✅ Target Profit: $60.50
Analysis:
Crude Oil turned bearish after failing to hold above the $64.00 resistance. The latest EIA Crude Oil Inventories report (Sep 10, 2025) showed a +3.939M build versus a forecasted -1.900M draw and a previous +2.415M, signaling weaker demand and oversupply pressures.
This aligns with the current technical setup: lower highs forming and supply pressure weighing on price action. A rejection around $63.50 opens room for continuation to the $60.50 support zone. Risk remains tight with a stop above $64.00, maintaining a favorable risk-to-reward profile.
Oil near $63 as Middle East tensions and tariff risks drive gainOil near $63 as Middle East tensions and tariff risks drive gains
WTI crude traded around $63 August 10, marking a third day of gains as Middle East tensions escalated after Israel struck Hamas leadership in Qatar. The move adds to years of regional operations and heightens supply concerns, supported by OPEC+’s smaller October output hike.
Meanwhile, U.S. President Trump urged the EU to impose 100% tariffs on Chinese and Indian goods to pressure Russia, with Washington ready to match. U.S. crude inventories rose 1.25M barrels, tempering the rally. Global stocks gained and the dollar steadied ahead of key U.S. inflation data, while gold held near record highs.

Market Analysis: WTI Crude Oil StrugglesMarket Analysis: WTI Crude Oil Struggles
Crude oil is showing bearish signs and might decline below $62.25.
Important Takeaways for WTI Crude Oil Price Analysis Today
- Crude oil price failed to clear the $65.60 region and started a fresh decline.
- There is a short-term bullish trend line forming with support at $62.25 on the hourly chart of XTI/USD.
WTI Crude Oil Price Technical Analysis
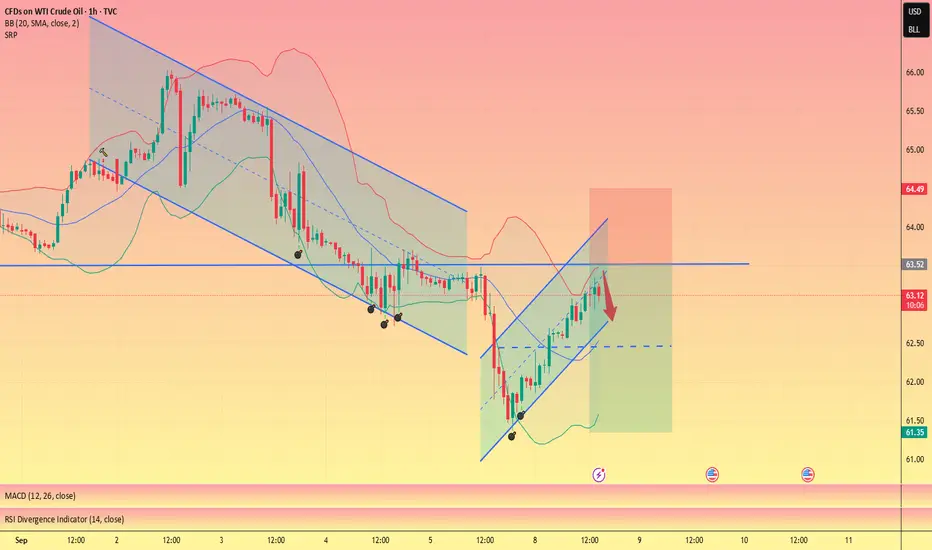
On the hourly chart of WTI Crude Oil, the price struggled to clear $65.60 against the US Dollar. The price started a fresh decline below $64.60.
The bears gained strength and pushed the price below $62.00. Finally, the price tested $61.20 and recently started a recovery wave. There was a move above $62.00, the 50-hour simple moving average, and the 23.6% Fib retracement level of the downward move from the $65.63 swing high to the $61.23 low.
The bears are now active near $63.00. If there is a fresh increase, the price could face a barrier near $63.05. The first major resistance is near the 50% Fib retracement at $63.40. The next stop for the bulls could be near $64.60. Any more gains might send the price toward $65.60.
Conversely, the price might start another decline and test a short-term bullish trend line with support at $62.25 and the 50-hour simple moving average.
The next major support on the WTI crude oil chart is $61.20. If there is a downside break, the price might decline toward $60.50. Any more losses may perhaps open the doors for a move toward $60.00.
This article represents the opinion of the Companies operating under the FXOpen brand only. It is not to be construed as an offer, solicitation, or recommendation with respect to products and services provided by the Companies operating under the FXOpen brand, nor is it to be considered financial advice.

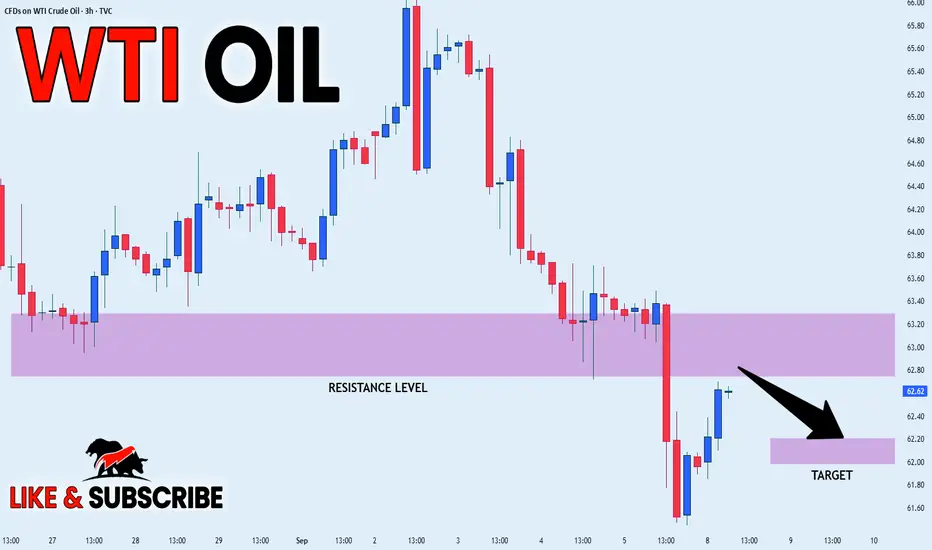
USOIL SELLERS WILL DOMINATE THE MARKET|SHORT
USOIL SIGNAL
Trade Direction: short
Entry Level: 63.28
Target Level: 61.46
Stop Loss: 64.49
RISK PROFILE
Risk level: medium
Suggested risk: 1%
Timeframe: 3h
Disclosure: I am part of Trade Nation's Influencer program and receive a monthly fee for using their TradingView charts in my analysis.
✅LIKE AND COMMENT MY IDEAS✅

Do you think the New Zealand dollar could strengthen?
Hi
Dears
I think we should still see a correction in the currency because the intensity of the previous wave of decline was quite high and we should look for sell orders to be collected.
What do you think?

Crude Oil - Eye twinkle to go long?The Test/Retest was expected, and it was not that clean as it is mostly. Usually I don't want to see price trading back into the fork again.
This time, price managed to jump out of it again and opened above the U-MLH. If it can close outside the fork too, then this would be a good hint for me to load the boat.
The 80% target is the yellow Centerline, or even higher, since the drillers moan about a too low price (Fundamental Fact).
Let's see if we find some petro dollars.

WTI Crude Oil (CL) - Technical Analysis Report - 20250908Analysis Date : September 8, 2025
Current Price : $62.25
Market Session : Pre-Market Analysis
Executive Summary
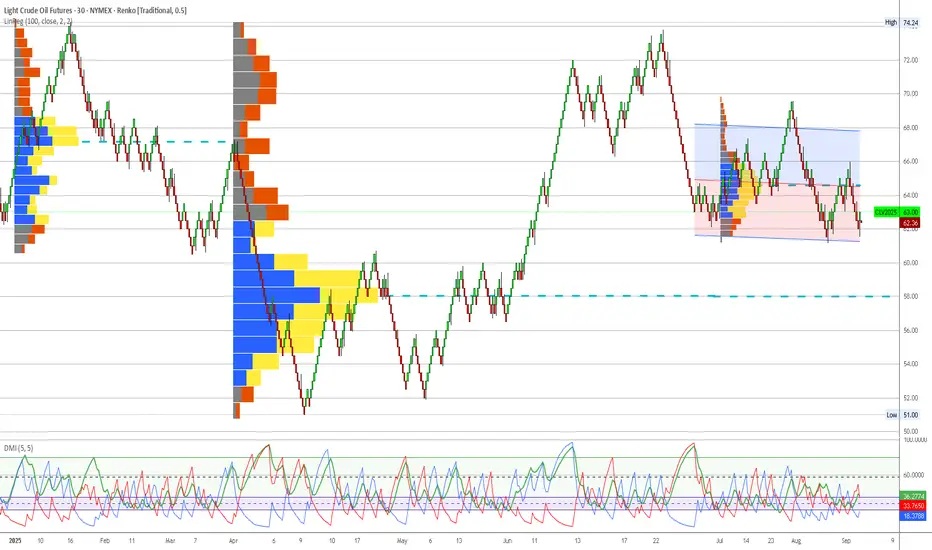
WTI Crude Oil presents a complex trading scenario with strong institutional support at current levels offset by concerning technical deterioration on the execution timeframe. The quarterly volume profile reveals massive smart money accumulation in the $62-64 zone, yet recent DEMA bearish crossover signals potential near-term weakness. This analysis provides a comprehensive framework for navigating this conflicted setup.
Quarterly Volume Profile Analysis
Institutional Positioning Intelligence
The quarterly volume profile (Q3 2025) reveals critical institutional positioning patterns that provide strategic context for all tactical decisions:
Primary Institutional Accumulation Zone: $62.00-$64.50
Massive blue volume concentration representing institutional accumulation
Heaviest volume density occurs at $62.50-$63.50 range
Current price ($62.25) sits at the lower boundary of this critical zone
Volume profile width indicates sustained institutional interest over extended period
Secondary Support Levels:
$60.50-$61.50: Moderate blue volume representing backup institutional support
$58.00-$59.00: Minimal volume suggesting limited institutional interest
Below $58.00: Complete volume void indicating institutional evacuation zone
Resistance Structure Analysis:
$65.00-$66.50: First institutional resistance zone with mixed volume
$68.00-$70.00: Heavy yellow volume indicating institutional distribution
$70.00+: Historical distribution zone from Q2 2025 peak
Price Structure Context
Historical Pattern Recognition:
The current positioning mirrors successful institutional accumulation patterns observed in previous commodity cycles. The width and intensity of the $62-64 blue volume zone suggests this represents a major strategic positioning by institutional participants, similar to the Natural Gas accumulation pattern that preceded its successful reversal.
Critical Structure Points:
Institutional Floor: $62.00 represents the absolute lower boundary of smart money positioning
Volume Point of Control: $63.25 shows peak institutional activity
Breakout Level: $64.50 marks the upper boundary requiring institutional continuation
Void Zone: $58-60 represents dangerous territory with minimal institutional backing
Execution Chart Technical Analysis
Current Technical Configuration
DEMA Analysis - CRITICAL WARNING SIGNAL:
Black Line (Fast DEMA 12): Currently at $62.25
Orange Line (Slow DEMA 20): Currently at $62.50
Configuration: Bearish crossover confirmed (black below orange)
Trend Bias: Technical momentum now bearish despite institutional support
DMI/ADX Assessment:
ADX Level: 40+ indicating strong directional movement
+DI vs -DI: -DI gaining dominance over +DI
Momentum Direction: Confirming the DEMA bearish bias
Trend Strength: High ADX suggests this technical shift has conviction
Stochastic Analysis:
Tactical Stochastic (5,3,3): Oversold territory providing potential bounce signal
Strategic Stochastic (50,3,3): Still showing bearish momentum
Divergence: Mixed signals between timeframes creating uncertainty
Support and Resistance Levels
Immediate Technical Levels:
Current Resistance: $62.75 (DEMA 20 orange line)
Key Resistance: $63.25 (institutional volume POC)
Major Resistance: $64.00 (upper institutional boundary)
Immediate Support: $61.75 (recent swing low)
Critical Support: $61.25 (institutional floor approach)
Emergency Support: $60.50 (secondary institutional zone)
Trading Scenarios and Setup Criteria
Scenario 1: Bullish Reversal Setup
Required Conditions for Long Entry:
DEMA recrossover: Black line must cross back above orange line
DMI confirmation: +DI must regain dominance over -DI
ADX maintenance: Strong directional reading above 25-30
Volume respect: Price must hold above $62.00 institutional floor
Stochastic alignment: Both tactical and strategic stochastics showing bullish divergence
Entry Protocol:
Primary Entry: $62.50-$63.00 upon DEMA bullish recrossover
Secondary Entry: $62.00-$62.25 if institutional floor holds with technical improvement
Position Sizing: 2% account risk maximum given conflicted signals
Stop Loss: Below $61.50 (institutional support violation)
Profit Targets:
Target 1: $65.00 (first institutional resistance) - Take 50% profits
Target 2: $67.00 (major resistance zone) - Take 25% profits
Target 3: $68.50-$70.00 (distribution zone) - Trail remaining 25%
Scenario 2: Bearish Breakdown Setup
Short Entry Conditions:
DEMA bearish continuation: Black line accelerating below orange line
Volume violation: Price breaking below $62.00 institutional floor
DMI confirmation: -DI expanding lead over +DI
ADX persistence: Maintaining strong directional bias
Short Setup Parameters:
Entry Range: $61.50-$61.75 on institutional support breakdown
Stop Loss: Above $62.75 (failed breakdown)
Targets: $60.00, $58.50, $57.00 (volume void zones)
Risk Management: Tight stops given counter-institutional positioning
Scenario 3: Range-Bound Consolidation
Sideways Trading Framework:
Range Definition: $62.00-$64.50 (institutional accumulation zone)
Long Zone: $62.00-$62.50 (lower boundary)
Short Zone: $63.75-$64.50 (upper boundary)
Stop Distance: 0.5-0.75 points ($500-$750 per contract)
Profit Target: Opposite range boundary
Risk Management Protocols
Position Sizing Guidelines
Conservative Approach (Recommended):
Maximum Risk: 1.5% of account (reduced from standard 2% due to technical/institutional conflict)
Contract Calculation: Account Size × 0.015 ÷ (Stop Distance × $10)
Example: $100,000 account with $0.75 stop = 200 contracts maximum
Stop Loss Hierarchy
Tactical Stop: $61.75 (execution chart support)
Strategic Stop: $61.50 (institutional boundary approach)
Emergency Stop: $60.75 (institutional floor violation)
Time-Based Risk Controls
Monitoring Requirements:
Daily: DEMA relationship and institutional level respect
4-Hour: DMI momentum shifts and ADX strength
Hourly: Stochastic divergence patterns
Exit Timeline: 10 trading days maximum if no clear resolution
Market Context and External Factors
Fundamental Considerations
Supply/Demand Dynamics:
OPEC+ production decisions impacting supply outlook
US Strategic Petroleum Reserve policies
China demand recovery prospects
Refinery maintenance season effects (September-October)
Geopolitical Factors:
Middle East tension levels affecting risk premiums
US-Iran relations impacting supply disruption concerns
Russia-Ukraine conflict ongoing effects on global energy flows
Seasonal Patterns
September-October Considerations:
End of summer driving season typically bearish for demand
Hurricane season potential for supply disruptions
Heating oil demand preparation potentially supportive
Refinery turnaround season creating temporary supply tightness
Monitoring Checklist and Alert Levels
Daily Monitoring Requirements
DEMA Status: Track black vs orange line relationship
Institutional Respect: Confirm price behavior at $62.00 floor
Volume Analysis: Monitor any changes in accumulation patterns
External Events: EIA inventory reports, Fed policy statements
Correlation Analysis: Monitor relationship with dollar strength and equity markets
Critical Alert Levels
Bullish Alerts:
DEMA bullish recrossover above $62.50
Strong bounce from $62.00 institutional floor
+DI reclaiming dominance over -DI
Break above $64.50 with volume confirmation
Bearish Alerts:
Break below $62.00 institutional floor
DEMA gap expansion (black line diverging from orange)
Volume breakdown below secondary support at $60.50
ADX above 50 with strong -DI dominance
Conclusion and Strategic Outlook
WTI Crude Oil presents a classic conflict between institutional positioning and technical momentum. The quarterly volume profile provides unambiguous evidence of major institutional accumulation at current levels, yet execution chart technical deterioration cannot be ignored. This scenario requires heightened vigilance and reduced position sizing until technical and institutional signals realign. The institutional floor at $62.00 represents the critical decision point - respect of this level with technical improvement offers exceptional risk/reward opportunities, while violation signals potential deeper correction despite smart money positioning.
Strategic Recommendation: Defensive positioning with readiness to capitalize on either directional resolution. Prioritize capital preservation while maintaining alert status for high-probability setups upon signal alignment.
Next Review: Daily assessment of DEMA configuration and institutional level respect
Document Status: Active monitoring required - conflicted signals demanding careful attention
Important Disclaimer
Risk Warning and Educational Purpose Statement
This analysis is provided for educational and informational purposes only and does not constitute financial advice, investment recommendations, or trading signals. All trading and investment decisions are solely the responsibility of the individual trader or investor.
Key Risk Considerations:
Futures trading involves substantial risk of loss and is not suitable for all investors
Past performance does not guarantee future results
Market conditions can change rapidly, invalidating any analysis
Leverage can amplify both profits and losses significantly
Individual financial circumstances and risk tolerance vary greatly
Professional Guidance: Before making any trading decisions, consult with qualified financial advisors, conduct your own research, and ensure you fully understand the risks involved. Only trade with capital you can afford to lose.
Methodology Limitations: Volume profile analysis and technical indicators are tools for market assessment but are not infallible predictors of future price movement. Market dynamics include numerous variables that cannot be fully captured in any single analytical framework.
The views and analysis presented represent one interpretation of market data and should be considered alongside other forms of analysis and individual judgment.
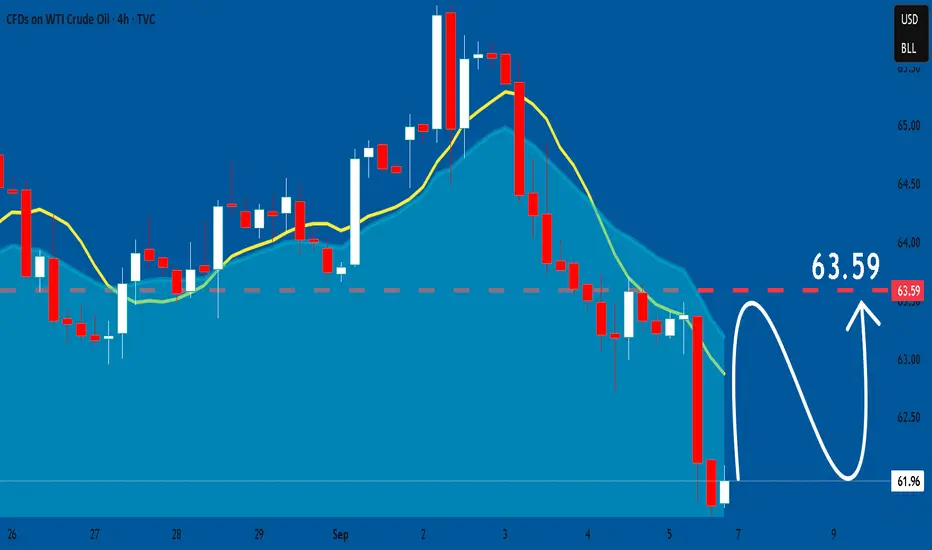
USOIL latest trend analysis and operation layout#USOIL
Crude oil continued to rebound in the European session, but the short-term 4H moving average was still pressing downward, and it was obvious that the short-selling momentum had not completely subsided. The overall trading rhythm is mainly based on rebound shorting. The short-term upper resistance level is 63.5-64.5. If it fails to break through effectively, crude oil will usher in a retracement, with the target looking at 62.5-61.5
🚀 SELL 63.5-64.5
🚀 TP 62.5-61.5
USOIL LOCAL SHORT|
✅CRUDE OIL is going up to retest
A horizontal resistance of 63.00$
And as OIL is in the downtrend
I am locally bearish biased
So I think that we will see a pullback
And a move down from the level
Towards the target below at 62.20$
SHORT🔥
✅Like and subscribe to never miss a new idea!✅
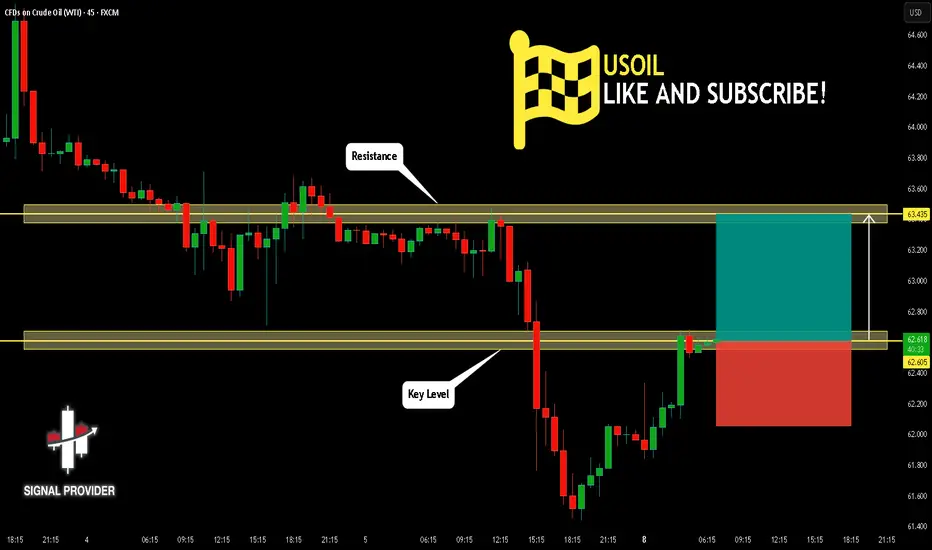
USOIL Is Going Up! Long!
Take a look at our analysis for USOIL.
Time Frame: 45m
Current Trend: Bullish
Sentiment: Oversold (based on 7-period RSI)
Forecast: Bullish
The market is approaching a key horizontal level 62.605.
Considering the today's price action, probabilities will be high to see a movement to 63.435.
P.S
Overbought describes a period of time where there has been a significant and consistent upward move in price over a period of time without much pullback.
Disclosure: I am part of Trade Nation's Influencer program and receive a monthly fee for using their TradingView charts in my analysis.
Like and subscribe and comment my ideas if you enjoy them!
USOIL H4 | Bullish reversal setup formingUSOIL is reacting off the buy entry which is a swing low support and could potentially rise from this level to the upside.
Buy entry is at 61.66, which is a swing low support that aligns with the 138.2% Fibonacci extension.
Stop loss is at 60.88, which is a pullback support that aligns with the 161.8% Fibonaci extension.
Take profit is at 63.43, whichis a pullback resistance that aligns with the 50% Fibonacci retracement.
High Risk Investment Warning
Trading Forex/CFDs on margin carries a high level of risk and may not be suitable for all investors. Leverage can work against you.
Stratos Markets Limited (tradu.com ):
CFDs are complex instruments and come with a high risk of losing money rapidly due to leverage. 65% of retail investor accounts lose money when trading CFDs with this provider. You should consider whether you understand how CFDs work and whether you can afford to take the high risk of losing your money.
Stratos Europe Ltd (tradu.com ):
CFDs are complex instruments and come with a high risk of losing money rapidly due to leverage. 66% of retail investor accounts lose money when trading CFDs with this provider. You should consider whether you understand how CFDs work and whether you can afford to take the high risk of losing your money.
Stratos Global LLC (tradu.com ):
Losses can exceed deposits.
Please be advised that the information presented on TradingView is provided to Tradu (‘Company’, ‘we’) by a third-party provider (‘TFA Global Pte Ltd’). Please be reminded that you are solely responsible for the trading decisions on your account. There is a very high degree of risk involved in trading. Any information and/or content is intended entirely for research, educational and informational purposes only and does not constitute investment or consultation advice or investment strategy. The information is not tailored to the investment needs of any specific person and therefore does not involve a consideration of any of the investment objectives, financial situation or needs of any viewer that may receive it. Kindly also note that past performance is not a reliable indicator of future results. Actual results may differ materially from those anticipated in forward-looking or past performance statements. We assume no liability as to the accuracy or completeness of any of the information and/or content provided herein and the Company cannot be held responsible for any omission, mistake nor for any loss or damage including without limitation to any loss of profit which may arise from reliance on any information supplied by TFA Global Pte Ltd.
The speaker(s) is neither an employee, agent nor representative of Tradu and is therefore acting independently. The opinions given are their own, constitute general market commentary, and do not constitute the opinion or advice of Tradu or any form of personal or investment advice. Tradu neither endorses nor guarantees offerings of third-party speakers, nor is Tradu responsible for the content, veracity or opinions of third-party speakers, presenters or participants.

BRIEFING Week #36 : Oil Prices Diverge from RealityHere's your weekly update ! Brought to you each weekend with years of track-record history..
Don't forget to hit the like/follow button if you feel like this post deserves it ;)
That's the best way to support me and help pushing this content to other users.
Kindly,
Phil

USOIL: Bullish Forecast & Outlook
Balance of buyers and sellers on the USOIL pair, that is best felt when all the timeframes are analyzed properly is shifting in favor of the buyers, therefore is it only natural that we go long on the pair.
Disclosure: I am part of Trade Nation's Influencer program and receive a monthly fee for using their TradingView charts in my analysis.
❤️ Please, support our work with like & comment! ❤️
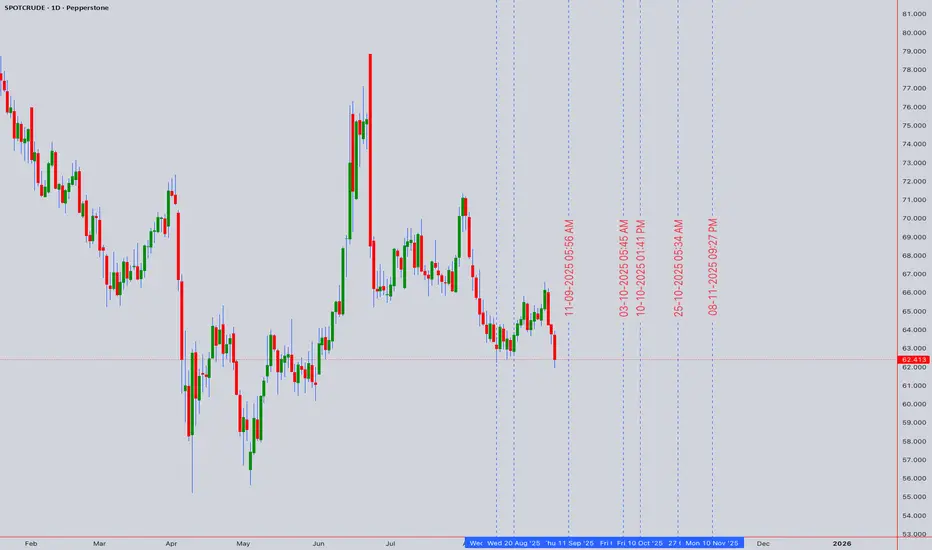
USOIL (WTI) Gann & Harmonic Pattern Points to Major Move!🛢️ 🛢️ USOIL (WTI CRUDE) Points to Major Move! ⚡ 📊
💹 Comprehensive Price Action Strategy | September 2025 Edition 🎯
📈 MARKET SNAPSHOT
Asset: USOIL (SPOTCRUDE/WTI CASH)
Current Closing Price: $64.413
Date: September 6, 2025
Market Status: 🔴 Critical Support Zone Testing
🎯 EXECUTIVE SUMMARY
WTI Crude Oil is currently trading at $64.413, positioned at a crucial technical juncture. Our multi-timeframe analysis reveals a bearish-to-neutral bias with potential for a significant reversal if key support levels hold. The convergence of multiple technical indicators suggests heightened volatility ahead, presenting both risk and opportunity for astute traders.
📊 COMPREHENSIVE TECHNICAL ANALYSIS
🕯️ Candlestick Pattern Analysis
The recent price action has formed a Bullish Hammer pattern at the $64.00 psychological support level, suggesting potential exhaustion of selling pressure. This formation, combined with increasing volume, indicates possible accumulation phase initiation.
Key Patterns Identified:
- ✅ Bullish Hammer at support
- ⚠️ Evening Star formation on 4H chart
- 📍 Doji cluster indicating indecision
🌊 Elliott Wave Analysis
Current wave count suggests we're completing Wave 5 of a larger corrective structure:
Primary Count: Completing Wave C of ABC correction
Alternative Count: Wave 4 consolidation before final Wave 5 push
Target Zones:
- Bullish: $72.50-$74.00 (Wave 5 extension)
- Bearish: $58.00-$60.00 (Wave C completion)
📐 Harmonic Patterns
A Bullish Bat Pattern is forming on the daily timeframe:
- X: $78.45 (Recent High)
- A: $61.20 (Recent Low)
- B: $71.85 (0.618 Retracement)
- C: $64.41 (Current Price)
- D: $59.80-$60.50 (Projected - 0.886 XA)
Trading Implication: Watch for reversal signals near $60.00 for high-probability long entries.
🔄 Wyckoff Analysis
Current market structure suggests:
Phase: Potential Spring Test within Trading Range
Volume Analysis: Declining volume on recent decline = Lack of selling pressure
Smart Money Behavior: Accumulation signals emerging
Projected Move: Re-accumulation before markup phase
📊 W.D. Gann Analysis
Gann Square of 9 Calculations:
- Current Price: $64.413 sits on 225° angle
- Next Resistance: $68.00 (270° angle)
- Critical Support: $61.00 (180° angle)
Gann Time Cycles:
- September 15, 2025: Major time pivot ⏰
- September 22, 2025: Secondary cycle completion
Gann Fan Analysis:
- Price respecting 2x1 angle from July low
- Break above 1x1 angle at $66.50 signals trend change
☁️ Ichimoku Cloud Analysis
Current Position: Price below cloud - Bearish bias
Tenkan-sen: $65.80 (Immediate resistance)
Kijun-sen: $67.25 (Major resistance)
Cloud Support: $62.00-$63.50
Chikou Span: Bearish, below price 26 periods ago
📉 KEY TECHNICAL INDICATORS
📊 RSI (14-Period)
Current Reading: 42.5
Status: Approaching oversold territory
Divergence: Bullish divergence forming on 4H chart
Signal: Potential reversal zone approaching
📈 Bollinger Bands
Upper Band: $68.20
Middle Band (20 SMA): $65.85
Lower Band: $63.50
Current Position: Testing lower band
Volatility: Bands contracting - Breakout imminent
💹 VWAP Analysis
Daily VWAP: $64.85
Weekly Anchored VWAP: $66.20
Monthly VWAP: $67.50
Volume Profile POC: $65.00 (High volume node)
📊 Moving Averages Confluence
20 EMA: $65.85 ⬇️
50 SMA: $67.20 ⬇️
100 EMA: $69.50 ⬇️
200 SMA: $71.00 ⬇️
Status: Death cross on daily (50/200) - Bearish medium-term
🎯 TRADING STRATEGY
⚡ INTRADAY TRADING (5M-1H)
LONG SETUP 🟢
Entry Zone: $63.80-$64.20
Stop Loss: $63.40 (-1%)
Target 1: $64.80 (+1.5%)
Target 2: $65.40 (+2.5%)
Target 3: $66.00 (+3.5%)
Risk/Reward: 1:3.5
SHORT SETUP 🔴
Entry Zone: $65.60-$65.90
Stop Loss: $66.30 (-1%)
Target 1: $65.00 (-1.5%)
Target 2: $64.40 (-2.5%)
Target 3: $63.80 (-3.5%)
Risk/Reward: 1:3.5
📈 SWING TRADING (4H-DAILY)
BULLISH SCENARIO 🚀
Entry: $64.00-$64.50 (Current levels)
Stop Loss: $61.50 (-4%)
Target 1: $68.00 (+5.5%)
Target 2: $72.00 (+11.8%)
Target 3: $75.50 (+17.2%)
Position Size: 2% portfolio risk
BEARISH SCENARIO 📉
Entry: $65.80-$66.20 (Resistance retest)
Stop Loss: $67.50 (+2%)
Target 1: $62.00 (-6%)
Target 2: $59.50 (-10%)
Target 3: $57.00 (-14%)
Position Size: 1.5% portfolio risk
🗓️ WEEKLY FORECAST
Monday-Tuesday (Sept 9-10) 📅
- Expected Range: $63.50-$65.80
- Bias: Neutral with bullish undertone
- Key Level: Watch $64.00 support hold
Wednesday-Thursday (Sept 11-12) 📅
- Expected Range: $64.00-$67.00
- Bias: Potential breakout day
- Catalyst: EIA Inventory Data
Friday (Sept 13) 📅
- Expected Range: $65.00-$68.50
- Bias: Trend continuation
- Note: Options expiry volatility
🌍 MARKET CONTEXT & FUNDAMENTALS
Geopolitical Factors 🌐
- ⚠️ Middle East tensions supporting price floor
- 🇨🇳 China demand concerns capping upside
- 🇺🇸 SPR refill discussions providing support
Supply/Demand Dynamics ⚖️
- OPEC+ production cuts extended
- US shale production moderating
- Global inventory draws accelerating
Economic Indicators 📊
- Dollar Index weakening (Bullish for Oil)
- Global growth concerns (Bearish pressure)
- Inflation expectations rising (Supportive)
⚠️ RISK MANAGEMENT
Position Sizing Guidelines 💰
Intraday: Max 1-2% account risk per trade
Swing: Max 3-5% account risk per position
Correlation Risk: Monitor energy sector exposure
Stop Loss Strategies 🛡️
1. ATR-Based: 1.5x ATR from entry
2. Structure-Based: Below/above key S/R levels
3. Time-Based: Exit if no movement in 2-3 candles
Risk Factors ⚠️
- 🔴 Break below $61.50 invalidates bullish thesis
- 🔴 Unexpected OPEC+ policy changes
- 🔴 Rapid Dollar strengthening
- 🟢 Surprise inventory draws
- 🟢 Geopolitical escalation
🎯 KEY LEVELS TO WATCH
SUPPORT LEVELS 🟢
S1: $63.50 (Immediate)
S2: $61.50 (Critical)
S3: $59.00 (Major)
S4: $57.00 (Yearly Low)
RESISTANCE LEVELS 🔴
R1: $65.80 (Immediate)
R2: $67.25 (Daily 50MA)
R3: $69.50 (Daily 100MA)
R4: $72.00 (Major)
💡 PRO TRADING TIPS
1. 🎯 Best Entry Times: London/NY overlap (8-11 AM EST)
2. 📊 Volume Confirmation: Look for >20% above average
3. 🔄 Correlation Trades: Monitor USD/CAD inverse relationship
4. ⏰ Avoid Trading: 30 mins before/after EIA releases
5. 📈 Scale Strategy: Add to winners, not losers
🔮 MONTH-END PRICE TARGETS
September 2025 Projections:
Bullish Target: $72.00-$74.00 🎯
Base Case: $66.00-$68.00 📊
Bearish Target: $58.00-$60.00 📉
Probability Assessment:
- Bullish Scenario: 35% 📈
- Base Case: 45% ➡️
- Bearish Scenario: 20% 📉
📌 CONCLUSION & ACTION PLAN
USOIL presents a compelling risk/reward opportunity at current levels. The confluence of technical support at $64.00, combined with oversold conditions and potential harmonic pattern completion, suggests a tactical long position with tight risk management is warranted.
Recommended Strategy:
1. Primary: Accumulate long positions $63.50-$64.50
2. Alternative: Wait for breakout above $66.00 for momentum trades
3. Hedge: Consider put options if below $61.50
📝 TRADING CHECKLIST
Before entering any position:
- ✅ Confirm volume supports move
- ✅ Check RSI for divergences
- ✅ Verify multiple timeframe alignment
- ✅ Set stop loss before entry
- ✅ Calculate position size
- ✅ Review correlation with DXY
- ✅ Check economic calendar
- ✅ Assess market sentiment
🏷️ *Last Updated: September 6, 2025, 12:54 AM UTC+4*
🔔 Follow for daily updates and real-time trading signals!
For individuals seeking to enhance their trading abilities based on the analyses provided, I recommend exploring the mentoring program offered by Shunya Trade. (Website: shunya dot trade)
I would appreciate your feedback on this analysis, as it will serve as a valuable resource for future endeavors.
Sincerely,
Shunya.Trade
Website: shunya dot trade
⚠️Disclaimer: This post is intended solely for educational purposes and does not constitute investment advice, financial advice, or trading recommendations. The views expressed herein are derived from technical analysis and are shared for informational purposes only. The stock market inherently carries risks, including the potential for capital loss. Therefore, readers are strongly advised to exercise prudent judgment before making any investment decisions. We assume no liability for any actions taken based on this content. For personalized guidance, it is recommended to consult a certified financial advisor.
CRUDE OIL Support Ahead! Buy!
Hello,Traders!
CRUDE OIL keeps falling
In a downtrend which seems
To indicate that the market
Has its doubts about the
Economy, however, a strong
Horizontal support is ahead
Around 60.00$ and after the
Retest we will be expecting
A local bullish rebound
Sell!
Comment and subscribe to help us grow!
Check out other forecasts below too!
Disclosure: I am part of Trade Nation's Influencer program and receive a monthly fee for using their TradingView charts in my analysis.

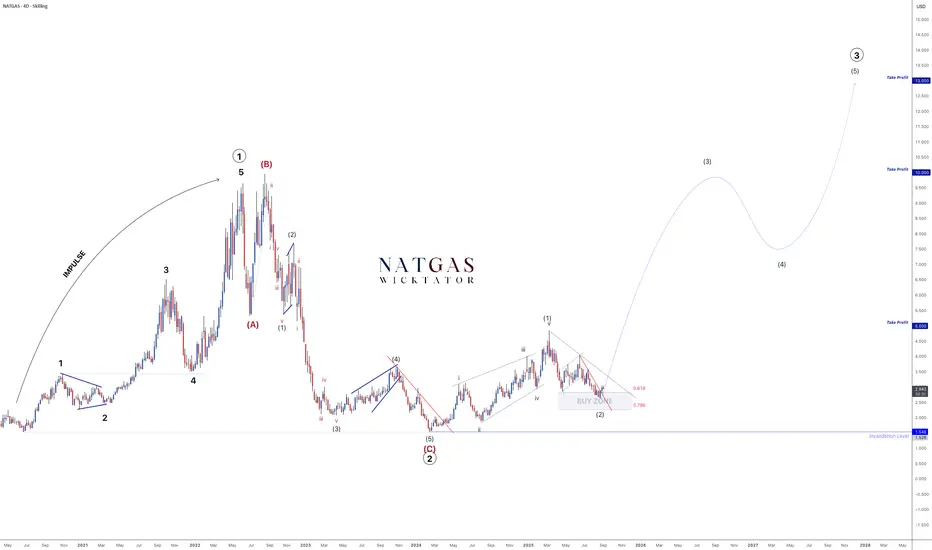
NATGAS – Wave 3 Impulse Confirmed. Multi-Year Rally Started!Our roadmap has played out with precision.
Wave 2 correction is complete, price tapped the buy zone, and the entry is now active.
We’re in the early stages of Wave 3 - historically the strongest and longest Elliott Wave.
🎯 Targets remain:
TP1: 5
TP2: 10
TP3: 13
The impulse has begun - now it’s about riding the wave.
Plan the trade. Trade the plan.

USOIL Will Explode! BUY!
My dear subscribers,
USOIL looks like it will make a good move, and here are the details:
The market is trading on 61.96 pivot level.
Bias - Bullish
Technical Indicators: Both Super Trend & Pivot HL indicate a highly probable Bullish continuation.
Target - 63.08
About Used Indicators:
The average true range (ATR) plays an important role in 'Supertrend' as the indicator uses ATR to calculate its value. The ATR indicator signals the degree of price volatility.
Disclosure: I am part of Trade Nation's Influencer program and receive a monthly fee for using their TradingView charts in my analysis.
———————————
WISH YOU ALL LUCK

USOIL: Bears Are Winning! Short!
My dear friends,
Today we will analyse USOIL together☺️
The in-trend continuation seems likely as the current long-term trend appears to be strong, and price is holding below a key level of 61.933 So a bearish continuation seems plausible, targeting the next low. We should enter on confirmation, and place a stop-loss beyond the recent swing level.
❤️Sending you lots of Love and Hugs❤️

USOIL Will Go Lower From Resistance! Sell!
Here is our detailed technical review for USOIL.
Time Frame: 12h
Current Trend: Bearish
Sentiment: Overbought (based on 7-period RSI)
Forecast: Bearish
The market is testing a major horizontal structure 61.941.
Taking into consideration the structure & trend analysis, I believe that the market will reach 58.529 level soon.
P.S
The term oversold refers to a condition where an asset has traded lower in price and has the potential for a price bounce.
Overbought refers to market scenarios where the instrument is traded considerably higher than its fair value. Overvaluation is caused by market sentiments when there is positive news.
Disclosure: I am part of Trade Nation's Influencer program and receive a monthly fee for using their TradingView charts in my analysis.
Like and subscribe and comment my ideas if you enjoy them!

WTI Oil Shorting Opportunity | Technical + Macro Confirm📌 WTI CRUDE OIL | Money-Making Thief Plan 🛢️ (Swing/Day Trade)
🗡️ Thief Strategy Plan (Bearish Bias)
Plan: Bearish setup confirmed — sellers in control after MA rejection of bulls 📉
Entry (Layered Style):
63.000 🔪
62.500 🔪
62.000 🔪
61.500 🔪
(You may increase or adjust layers based on your own plan)
Stop Loss (Thief SL): @64.000 ❌
⚠️ Adjust SL according to your risk & strategy
Target (Thief TP): Key resistance zone + overbought trap @4.6700 🎯
Note: Dear Ladies & Gentlemen (Thief OG’s) — I don’t recommend locking only my TP. Take your profits wisely & manage risk responsibly. 💰
❓ Why This Plan?
Moving average rejection confirms sellers’ dominance ⚔️
Technical indicators showing strong sell bias 📉
Layered entry strategy helps in catching moves efficiently 🎯
Oversupply risk + weak demand = bearish fuel 🔥
Retail & institutions both leaning short-side heavy 🐻
🔍 Market Analysis (Technical + Fundamental + Macro + Sentiment)
📊 Real-Time Price Action - Sep 05
Daily Change: -1.03%
Monthly Change: -2.84%
Yearly Change: -8.44%
😊 Retail & Institutional Sentiment
Retail Traders: 35% 🐂 | 55% 🐻 | 10% 😐
Institutional Traders: 30% 🐂 | 60% 🐻 | 10% 😐
🌡️ Fear & Greed Index
Current: 25/100 — Fear 😟
Mood: Cautious, driven by oversupply fears + weak demand
⚒️ Fundamental Score: 40/100 (Bearish)
U.S. crude inventories unexpectedly +2.42M vs. -2.19M expected 📈
OPEC+ considering production increase 🌍
Weak China demand signals 📉
🌐 Macro Score: 35/100 (Bearish)
Fed rate cut expectations (25bp likely in September) 💸
Global slowdown fears 🌎 (Europe + Asia weak data)
Geopolitical risks (Russia-Ukraine) limited impact 🚨
🏁 Overall Market Outlook: Bearish (Short Bias) 🐻
Declining prices + rising inventories + OPEC+ supply hike risk
Technicals = Strong Sell (daily/weekly)
Sentiment favors sellers across the board
🔮 Key Takeaway
WTI/USOIL remains heavy under supply pressure + demand weakness.
Market sentiment is fearful, with both retail & institutions leaning short.
⚡ Keep eyes on U.S. jobs data + OPEC+ decisions for any trend shifts.
📌RELATED PAIRS TO WATCH
BRENT CRUDE ( TVC:UKOIL ): $66.42 (-1.8% daily)
NATURAL GAS ( FX:NGAS ): $2.84 (-0.7% daily)
ENERGY ETFS: XLE, USO, UCO
OANDA:CADJPY : Oil-correlated currency pair
ENERGY STOCKS: NYSE:XOM , NYSE:CVX , NYSE:COP , NYSE:SLB
✨ “If you find value in my analysis, a 👍 and 🚀 boost is much appreciated — it helps me share more setups with the community!”
#USOIL #WTI #CrudeOil #ThiefTrader #EnergyMarkets #Commodities #OPEC #SwingTrade #DayTrade #OilAnalysis

U.S. Natural Gas holds near 4-week highU.S. Natural Gas holds near 4-week high as storage builds match forecasts
U.S. natural gas stayed near a four-week high Thursday after EIA data showed inventories rose by 55 Bcf to 3,272 Bcf for the week ending Aug. 29, in line with expectations. Stocks remain 2.2% below last year but 5.6% above the five-year average, signaling ample supply despite record LNG exports and strong demand.
Higher production, with dry gas output at 107.1 Bcf/day, continues to pressure prices, while weather forecasts calling for warmer temperatures in mid-September may support short-term demand. LNG flows hit 15 Bcf/day, near record highs, as U.S. exports remain strong amid European and Asian demand.
