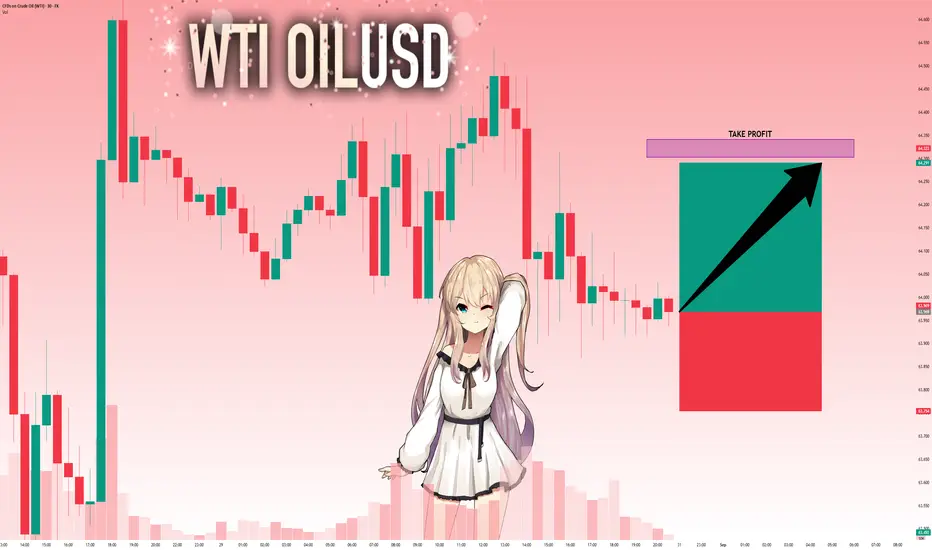
USOIL BULLISH BIAS RIGHT NOW| LONG
USOIL SIGNAL
Trade Direction: long
Entry Level: 63.13
Target Level: 65.08
Stop Loss: 61.82
RISK PROFILE
Risk level: medium
Suggested risk: 1%
Timeframe: 9h
Disclosure: I am part of Trade Nation's Influencer program and receive a monthly fee for using their TradingView charts in my analysis.
✅LIKE AND COMMENT MY IDEAS✅
Crude Oil WTI

Crude oil - Potential UPThe break of breakeven must be give a push UP of price until next resistence area

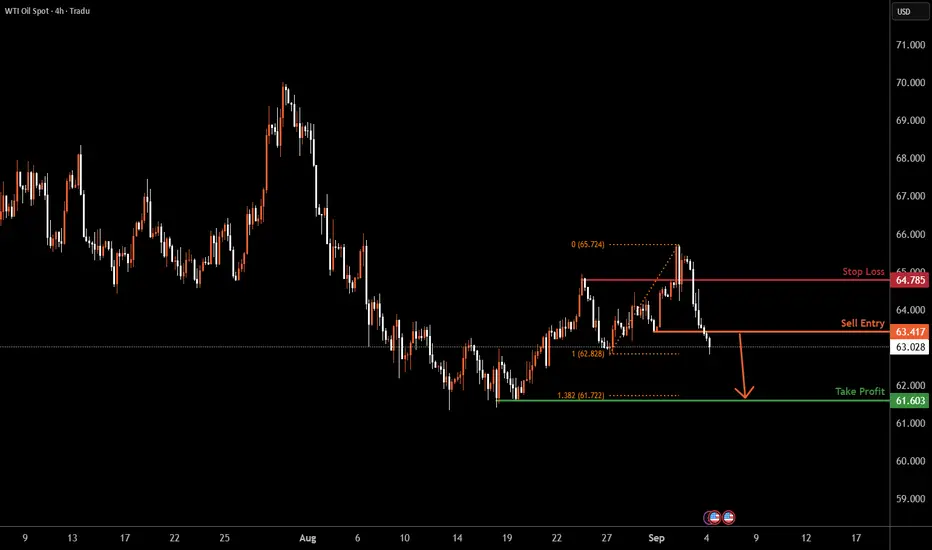
USOIL H4 | Potential bearish dropBased on the H4 chart analysis, we can see that the price has reacted off the sell entry, which is a pullback resistance and could drop from this level to the downside.
Sell entry is at 63.41, which is a pullback resistance.
Stop loss is at 64.78, which is a pullback resistance.
Take profit is at 61.60, which is a swing low support that lines up with the 138.2% Fibonacci extension.
High Risk Investment Warning
Trading Forex/CFDs on margin carries a high level of risk and may not be suitable for all investors. Leverage can work against you.
Stratos Markets Limited (tradu.com ):
CFDs are complex instruments and come with a high risk of losing money rapidly due to leverage. 65% of retail investor accounts lose money when trading CFDs with this provider. You should consider whether you understand how CFDs work and whether you can afford to take the high risk of losing your money.
Stratos Europe Ltd (tradu.com ):
CFDs are complex instruments and come with a high risk of losing money rapidly due to leverage. 66% of retail investor accounts lose money when trading CFDs with this provider. You should consider whether you understand how CFDs work and whether you can afford to take the high risk of losing your money.
Stratos Global LLC (tradu.com ):
Losses can exceed deposits.
Please be advised that the information presented on TradingView is provided to Tradu (‘Company’, ‘we’) by a third-party provider (‘TFA Global Pte Ltd’). Please be reminded that you are solely responsible for the trading decisions on your account. There is a very high degree of risk involved in trading. Any information and/or content is intended entirely for research, educational and informational purposes only and does not constitute investment or consultation advice or investment strategy. The information is not tailored to the investment needs of any specific person and therefore does not involve a consideration of any of the investment objectives, financial situation or needs of any viewer that may receive it. Kindly also note that past performance is not a reliable indicator of future results. Actual results may differ materially from those anticipated in forward-looking or past performance statements. We assume no liability as to the accuracy or completeness of any of the information and/or content provided herein and the Company cannot be held responsible for any omission, mistake nor for any loss or damage including without limitation to any loss of profit which may arise from reliance on any information supplied by TFA Global Pte Ltd.
The speaker(s) is neither an employee, agent nor representative of Tradu and is therefore acting independently. The opinions given are their own, constitute general market commentary, and do not constitute the opinion or advice of Tradu or any form of personal or investment advice. Tradu neither endorses nor guarantees offerings of third-party speakers, nor is Tradu responsible for the content, veracity or opinions of third-party speakers, presenters or participants.
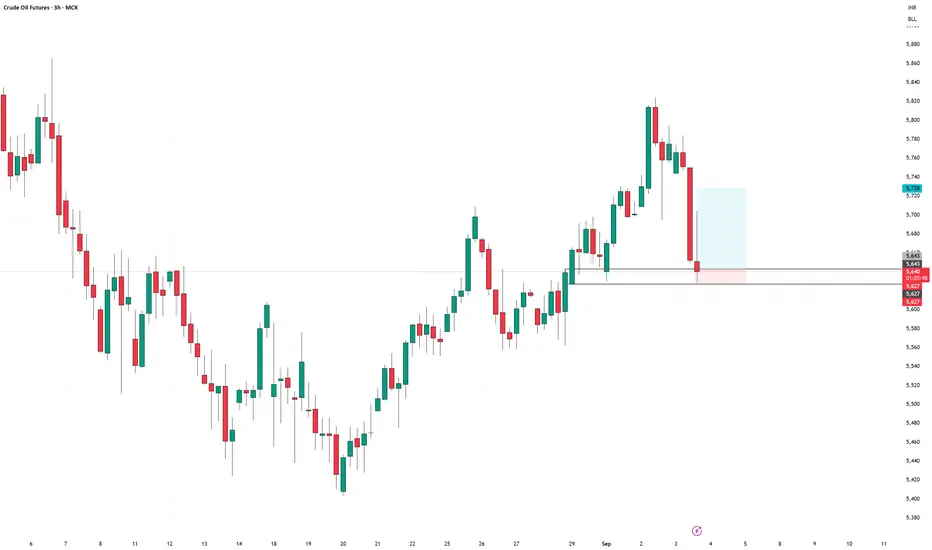
CRUDEOIL September Futures long setupCRUDEOIL September Futures long setup
Entry - 5643
Stop Loss - 5627
Target - 5728
Risk Reward - 1:5.3
WTI: weekly seller targets reached, monthly targets still lowerHi traders and investors!
This analysis is based on the Initiative Analysis concept (IA).
The sellers have reached the targets mentioned in the previous review (65.628 and 64.378).
What to expect next.
Daily timeframe
On the daily timeframe (D1) for WTI, we see a manipulation of the 65.771 level, which may indicate that the market is moving toward the monthly targets I mentioned earlier — 61.818 and 58.504.
Hourly timeframe
On the hourly timeframe (H1), this manipulation appeared as a false breakout of the upper boundary of a sideways range. The range boundaries are clearly defined: the upper boundary at 65.771 and the lower boundary at 63.580.
Wishing you profitable trades!

BUY USOILBeen a while since I last shared a trade to take, but today as you can see, the market grabbed the LQ to give us an entry point to take for a long trade.
Follow for more!

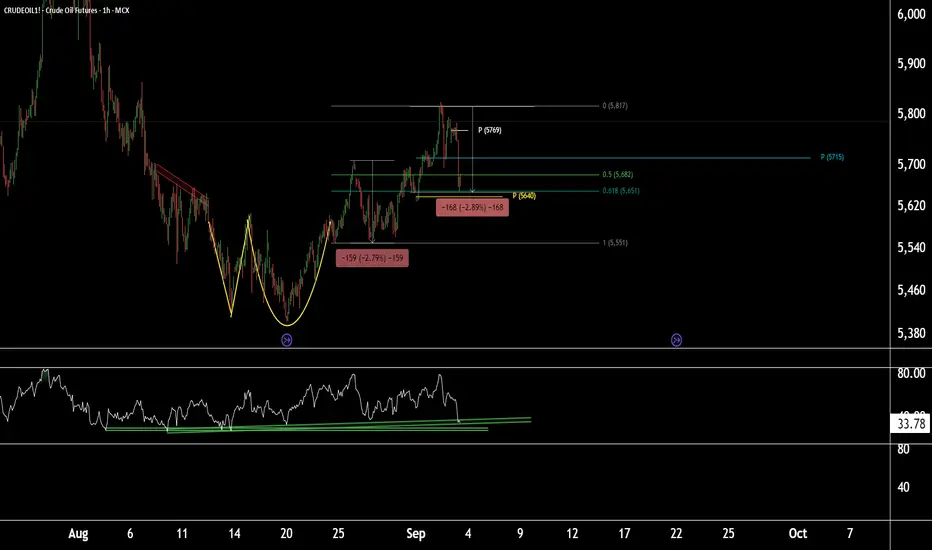
Price action + RSI support = fresh buy opportunity in CrudeOil1!CrudeOil1! (1-Hour Timeframe) Technical Outlook
CrudeOil1! is currently sustaining at the Fibonacci Golden Ratio level of 0.618, with the weekly pivot placed near 5640. Based on Fibonacci projections and price action, this 5640 zone appears to be a crucial area, as it aligns with a 2.8% retracement completion.
On the 1-hour timeframe, the RSI is showing a decline but may take support near the current levels, adding further weight to this support zone.
All technical indicators together suggest that the 5640–5650 zone could act as a strong support in the short term. If this support holds, we may see upside targets at 5715 and 5750, with the potential for CrudeOil1! to make a new high if the bullish momentum continues.
Thank you.
WTI OIL Short-term Channel Up 4H MA50 buy opportunity.Last week (August 26, see chart below) we caught the absolute low with our WTI Oil (USOIL) buy signal, hitting our $66.30 Target shortly after:
This time we have another buy signal on the short-term as the Channel Up that emerged has pulled-back all the way to its 4H MA50 (blue trend-line).
The last 3 times it did so, it was a buy opportunity. Assuming this is another Higher Low bottom, the new Bullish Leg that is about to be initiated, should aim for the 1.382 Fibonacci extension, similar to what the previous two did.
This gives us a $66.75 Target for the short-term.
-------------------------------------------------------------------------------
** Please LIKE 👍, FOLLOW ✅, SHARE 🙌 and COMMENT ✍ if you enjoy this idea! Also share your ideas and charts in the comments section below! This is best way to keep it relevant, support us, keep the content here free and allow the idea to reach as many people as possible. **
-------------------------------------------------------------------------------
💸💸💸💸💸💸
👇 👇 👇 👇 👇 👇

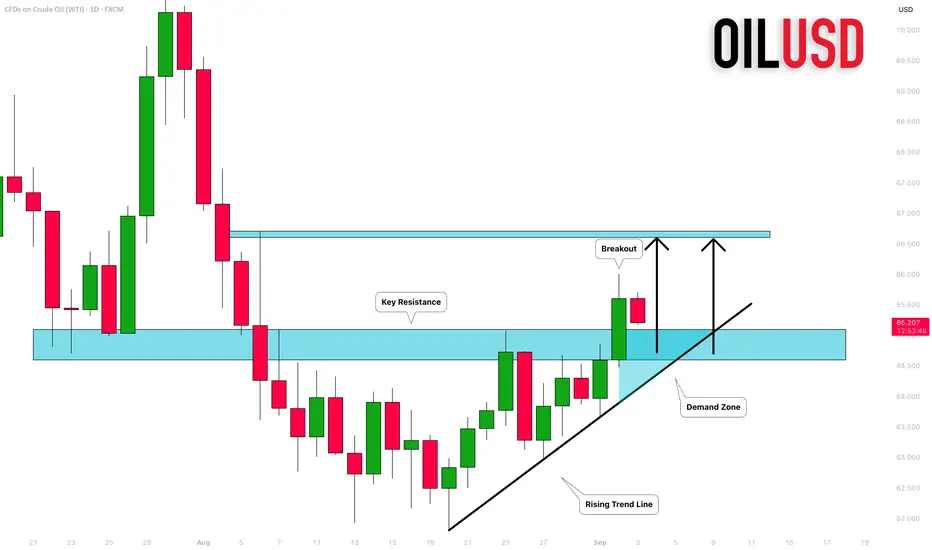
CRUDE OIL (WTI): Important Breakout!
With a strong bullish rally, WTI Crude Oil violated a significant
daily resistance cluster yesterday.
The broken structure and a rising trend line compose an important
demand zone now.
I will expect a bullish continuation from that.
Next resistance - 66.6
❤️Please, support my work with like, thank you!❤️
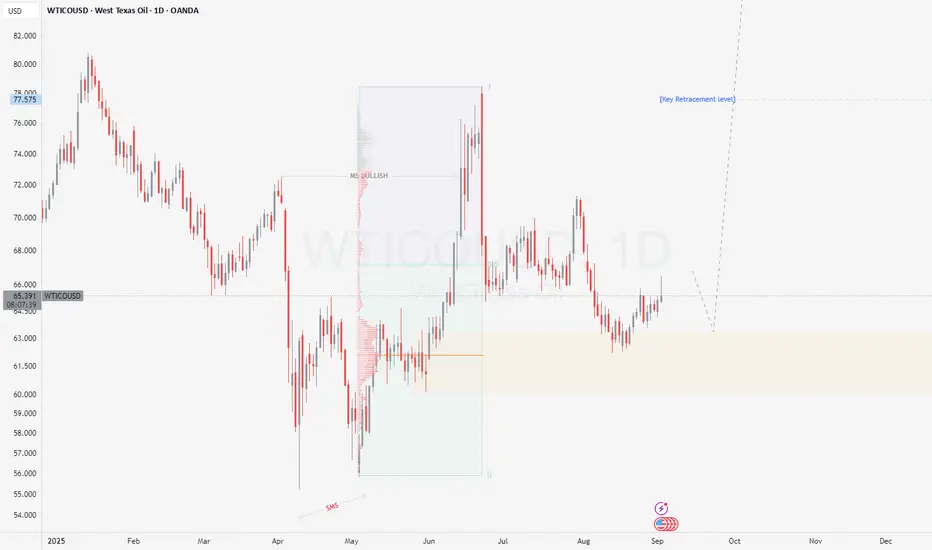
Is usoil still bullish?
Hi my dears
How are you?
Usoil seems to have the potential to move higher. I think it has the potential to reach $65.80 in the coming weeks if and only if the conditions in the picture are met.
What do you think?
Check out my analysis.

WTI - Moscow's Discounts Keep Russian Oil Flowing to IndiaIndian refineries are still incentivized to buy Russian Urals oil, says Commerzbank Research's Carsten Fritsch. President Trump inflicted stiff tariffs on New Delhi--including a 25% levy for its purchases of Russian oil--but Indian Prime Minister Narendra Modi appears unwilling to bow to U.S. pressure. Meanwhile, the Kremlin cut the price of its oil in order to keep Indian customers. "This oil is being offered at a discount of $3-$4 per barrel compared to Brent for cargoes loaded at the end of September and in October," Fritsch says, citing unnamed sources. "By comparison, Indian refineries recently had to pay a premium of $3 over Brent for U.S. oil."
WTI Surges Above 65$ ResistanceCrude oil is currently supported by a combination of energy sanctions, geopolitical tensions, and rate cut expectations — with price action eyeing the $70 barrier as long as it holds above $65.20.
WTI maintained its rebound above the 61.80–62.00 support zone — aligning with the neckline of the previous inverted head and shoulders formation — and has broken above the 65 resistance level, signaling a potential continuation of bullish momentum. Daily RSI has also moved above the neutral 50 level, further confirming upside momentum.
• A clean hold above 65.20 may extend the rally toward 68.00, 69.40, and 70.40 — the next major resistance levels.
• On the downside, 62.00 and 61.80 remain key support levels. A break below them could expose oil to deeper losses toward 59.40 and 57.90.

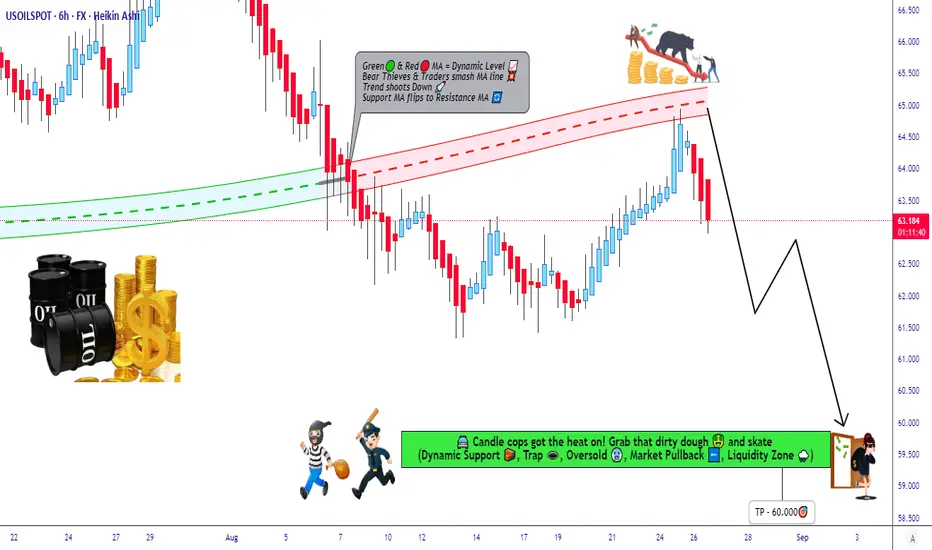
USOil Bear Trap Set: Ready For The Downside Raid?🛢️ WTI Oil Bearish Heist Plan 💣 | Thief Trader Layers Activated 🔐
💥 Welcome to the vault raid, Thief OG’s! 💥
We’re targeting US Oil Spot / WTI (XTIUSD) — and this time, the plan is pure Bearish robbery.
🚨 The Robbery Setup:
This isn’t just a sell — it’s a layered ambush. We place traps, let bulls walk in, and then we rob clean.
📌 Thief Entry Plan (Limit Layers):
Sell Limit @63.000
Sell Limit @63.500
Sell Limit @64.000
Sell Limit @64.500
👉 You can stack more layers if the vault door keeps opening.
🛑 Thief Stop Loss:
SL locked @65.500 🔒
⚠️ Adjust your SL like a true Thief — according to your risk + number of layers.
🎯 Escape Plan (Target):
🚔 Police barricade spotted around 59.000.
📌 Official Heist Exit: 60.000 — grab the loot before the cops arrive.
🧠 Thief Strategy Logic:
Multi-layer sell ambush 🏴☠️
Bearish pressure from supply + demand shifts 📊
Technical rejection zones aligning with macro weakness 📉
⚠️ Risk Management Note:
Thieves don’t rush!
👉 Place alerts before the raid.
👉 Don’t dump blind orders — wait for price to approach layers.
👉 Manage your position like a stealth operation, not a casino gamble.
💬 Thief Community Code:
Smash ❤️ & Boost if you’re with the robbery crew.
Drop your charts + sniper entries below.
We rob together. We win together. 🏆
🔔 Stay locked in — more heist plans dropping soon.
💰 Rob Smart. Trade Sharp. Exit Clean.
USOIL BEARS WILL DOMINATE THE MARKET|SHORT
USOIL SIGNAL
Trade Direction: short
Entry Level: 65.90
Target Level: 59.95
Stop Loss: 69.84
RISK PROFILE
Risk level: medium
Suggested risk: 1%
Timeframe: 1D
Disclosure: I am part of Trade Nation's Influencer program and receive a monthly fee for using their TradingView charts in my analysis.
✅LIKE AND COMMENT MY IDEAS✅

USOIL (WTI Crude) – Buy & Sell Trade Scenarios🔵 Bullish Scenario (Buy Call)
Entry Zone: Break and sustained close above 65.20 – 65.50 (current 4H resistance).
Reasoning:
Price has retested the 64.90 resistance cluster multiple times, suggesting absorption of supply.
Volume shows declining sell pressure near resistance – a sign of potential breakout.
A breakout with strong volume confirms buyers stepping in.
Target 1: 66.75 (measured move into next liquidity pool).
Target 2 (extended): 68.20 – 68.50 (previous structural pivot).
Stop Loss: Below 64.20 (false breakout protection).
R:R Potential: ~1:2.5 to 1:3
🔴 Bearish Scenario (Sell Call)
Entry Zone: Rejection at 65.00 – 65.50 resistance with bearish confirmation candle.
Reasoning:
This zone has acted as a strong supply area since mid-August.
Multiple wicks rejecting the level + increasing sell volume hint at distribution.
If price fails to close above resistance, sellers regain control.
Target 1: 63.00 – 63.20 (mid-support range).
Target 2 (extended): 62.00 – 61.90 (major support zone).
Stop Loss: Above 65.70 (wick protection).
R:R Potential: ~1:2 to 1:3
⚖️ Key Technical Takeaway
64.90 – 65.50 = Pivot zone (battle between bulls and bears).
Breakout + volume = bullish continuation to 66.75+.
Rejection + heavy volume = bearish rotation back to 62.95.

USOIL Will Go Lower! Sell!
Take a look at our analysis for USOIL.
Time Frame: 6h
Current Trend: Bearish
Sentiment: Overbought (based on 7-period RSI)
Forecast: Bearish
The market is approaching a key horizontal level 64.627.
Considering the today's price action, probabilities will be high to see a movement to 63.428.
P.S
Please, note that an oversold/overbought condition can last for a long time, and therefore being oversold/overbought doesn't mean a price rally will come soon, or at all.
Disclosure: I am part of Trade Nation's Influencer program and receive a monthly fee for using their TradingView charts in my analysis.
Like and subscribe and comment my ideas if you enjoy them!
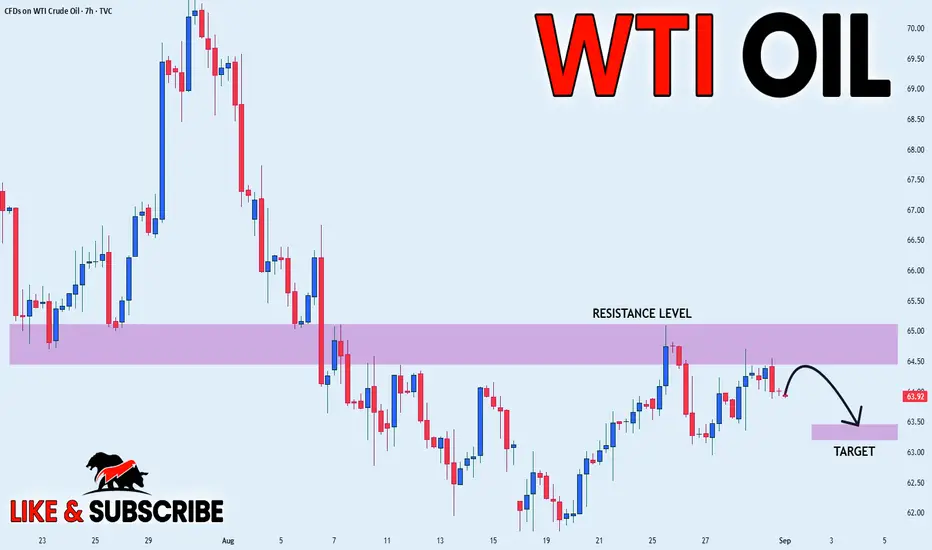
CRUDE OIL WILL FALL|SHORT|
✅CRUDE OIL price went up
Sharply but a strong resistance
Level was hit at 65.00$
Thus, as a pullback is
Already happening
And a move down towards
The target of 63.50$shall follow
SHORT🔥
✅Like and subscribe to never miss a new idea!✅
SpotCrude Short Setup - 4h💎MJTrading
📸 Viewing Tip:
🛠️ Some layout elements may shift depending on your screen size.
🔗 View the fixed high-resolution chart here:
🛢️ PEPPERSTONE:SPOTCRUDE Short Setup – Third Tap of Falling Wedge Resistance
Pattern: Falling wedge
Context: Price is testing wedge resistance for the third time, with rejection signs
Bias: Bearish
🟢 Entry Point: 64.5
This aligns with upper boundary of the Falling Wedge (After Rejection).
❌ Stop Loss (SL): 65.5
🎯 Take Profit (TP) Levels
✅ TP1 (RR1) → 63.5
📈 TP2 → 62.5
💰 TP3 → 61.5
🧠 Trade Logic
Price is testing wedge resistance for the third time, with rejection signs
⚠️ Risk Management
Risk:Reward ratio ranges from 1:1 to 1:3, depending on TP level.
Psychology Always Matters:

BRIEFING Week #35 : Monthly forecast for Q4Here's your weekly update ! Brought to you each weekend with years of track-record history..
Don't forget to hit the like/follow button if you feel like this post deserves it ;)
That's the best way to support me and help pushing this content to other users.
Kindly,
Phil

USOIL BEARS WILL DOMINATE THE MARKET|SHORT
USOIL SIGNAL
Trade Direction: short
Entry Level: 64.00
Target Level: 62.79
Stop Loss: 64.80
RISK PROFILE
Risk level: medium
Suggested risk: 1%
Timeframe: 4h
Disclosure: I am part of Trade Nation's Influencer program and receive a monthly fee for using their TradingView charts in my analysis.
✅LIKE AND COMMENT MY IDEAS✅

USOIL: Target Is Up! Long!
My dear friends,
Today we will analyse USOIL together☺️
The in-trend continuation seems likely as the current long-term trend appears to be strong, and price is holding above a key level of 63.969 So a bullish continuation seems plausible, targeting the next high. We should enter on confirmation, and place a stop-loss beyond the recent swing level.
❤️Sending you lots of Love and Hugs❤️
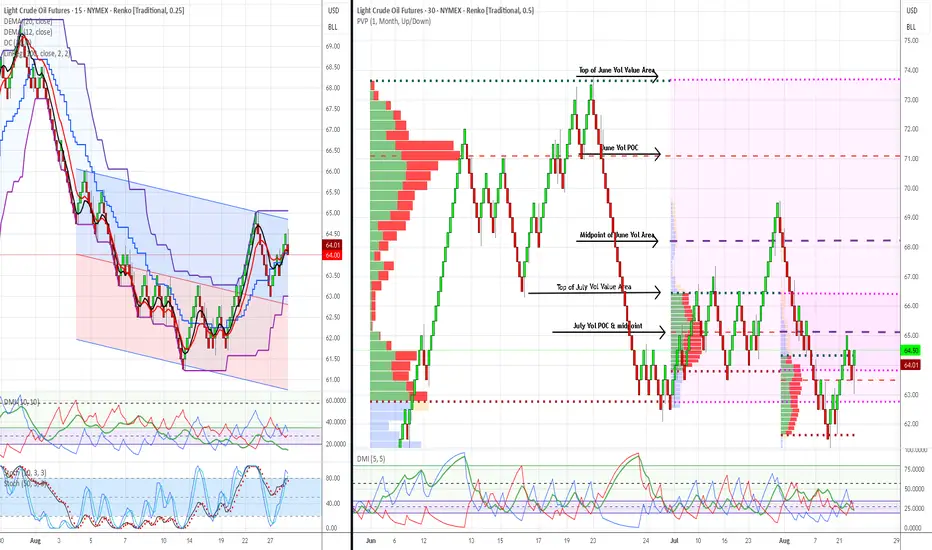
WTI Crude Oil Trading Analysis: 02-September-2025Week Ahead Plan: September 2-6, 2025
Analysis Period : August 26-30, 2025 Review | September 2-6, 2025 Outlook
Market : WTI Crude Oil Futures (CL1!)
Methodology : Dual Renko Chart System ($0.25/15min + $0.50/30min)
Current Price : $64.00 (August 30, 2025)
________________________________________
Strategic Outlook & Market Setup
Primary Scenario (70% Probability): Pullback First, Then Recovery
What to Expect : Market opens lower Tuesday ($63.00-63.50 range) due to bearish signal on short-term chart. This creates a buying opportunity if support holds.
Trading Plan:
Tuesday Opening : Expect gap down - don't panic, this was anticipated
Buy Zone : Look for entries between $62.00-63.50 (strong institutional support)
Confirmation Needed : Wait for short-term trend to flip bullish again before buying
Target : Still aiming for $66.50 but may take extra 3-5 days to get there
Secondary Scenario (25% Probability): Sideways Consolidation
What to Expect : Market trades in $63.50-64.50 range for several days while technical signals realign.
Trading Plan:
Strategy: Be patient - don't force trades in choppy conditions
Wait For: Clear breakout above $64.50 with volume
Risk: Could waste 1-2 weeks in sideways action
Low Probability Scenario (5% Probability): Immediate Continuation Up
What to Expect : Market gaps up above $64.25 and keeps rising.
Trading Plan:
Verify: Make sure both short-term and long-term signals turn bullish
Caution: Be skeptical without strong volume confirmation
Action: Can buy but use smaller position sizes until confirmed
________________________________________
Market Risk Factors & Monitoring
Critical Support Level : $62.00
Why Important: Massive institutional buying occurred here - if it breaks, the bullish case is dead
Action If Broken: Exit all long positions immediately, wait for new setup
Probability of Break: Low (15%) but must be respected
Key Events This Week :
Tuesday: ISM Services data (economic health indicator)
Wednesday: Weekly oil inventory report (could cause volatility)
Friday: Jobs report (affects overall market sentiment)
Warning Signs to Watch:
Technical: Short-term trend staying bearish for more than 3 days
Volume: Declining volume on any bounce attempts
Support: Any trading below $62.50 for extended periods
Time: No progress toward $66.50 target within 10 total trading days
Positive Signs to Look For :
Technical: Short-term trend flipping back to bullish (key confirmation)
Volume: Above-average volume on any recovery moves
Support: Strong buying interest at $62-63 zone
Momentum: Clean breakout above $64.50 with follow-through
________________________________________
Forward-Looking Adjustments
Modified Risk Management :
Position Size: Use 50% of normal position size until both timeframes align bullish
Stop Loss: Tighter stops at $62.75 (just below support zone)
Entry Patience: Don't chase - wait for pullback to support levels
Profit Taking: Be more aggressive taking profits at first target ($66.50)
Revised Entry Strategy:
Before Buying, Confirm ALL Three:
Price: Trading at or near $62-63 support zone
Technical: Short-term trend signal flips back to bullish
Volume: Above-average buying interest visible
Timeline Expectations :
Days 1-3: Expect pullback/consolidation phase
Days 4-5: Look for bullish confirmation signals
Days 6-10: Resume advance toward $66.50 target if signals align
Beyond Day 10: If no progress, reassess entire strategy
Success Metrics:
Minimum Goal: Protect capital during pullback phase
Primary Target: $66.50 within 2 weeks (revised from 1 week)
Risk Limit: Maximum 2% account loss if support fails
Time Limit: Exit strategy if no directional progress within 10 days total
Simplified Decision Framework :
Green Light to Buy: Price near $62-63 + Short-term trend bullish + Good volume Yellow Light (Wait): Mixed signals, choppy price action, low volume
Red Light (Exit): Price below $62, bearish trend continuing, time limit exceeded
________________________________________
Bottom Line : The bigger picture remains bullish, but short-term signals suggest a pullback first. Use any weakness to $62-63 as a buying opportunity, but only with proper confirmation. Be patient - the setup is still valid but timing may be delayed by a few days.
________________________________________
Document Classification : Trading Analysis
Next Update : September 6, 2025 (Weekly Review)
Risk Level : Moderate (controlled institutional setup)
This analysis represents continued validation of a systematic, institutional-grade trading methodology with demonstrated predictive accuracy and risk control capabilities. This is a view that represents possible scenarios but ultimate responsibility is with each individual trader.
Risk Disclaimer: Past performance does not guarantee future results. All trading involves risk of loss.
USOIL Massive Long! BUY!
My dear subscribers,
This is my opinion on the USOIL next move:
The instrument tests an important psychological level 64.00
Bias - Bullish
Technical Indicators: Supper Trend gives a precise Bullish signal, while Pivot Point HL predicts price changes and potential reversals in the market.
Target - 64.22
My Stop Loss - 63.89
About Used Indicators:
On the subsequent day, trading above the pivot point is thought to indicate ongoing bullish sentiment, while trading below the pivot point indicates bearish sentiment.
Disclosure: I am part of Trade Nation's Influencer program and receive a monthly fee for using their TradingView charts in my analysis.
———————————
WISH YOU ALL LUCK
