BRIEFING Week #34 : The Rotation may have BegunHere's your weekly update ! Brought to you each weekend with years of track-record history..
Don't forget to hit the like/follow button if you feel like this post deserves it ;)
That's the best way to support me and help pushing this content to other users.
Kindly,
Phil
Crude Oil WTI

WTI Crude Oil · M15 · 24-Aug — “Buy the Dip into EMA/Donchian”🟢 Bias: Intraday long after spike, buy the dip into Donchian + EMA support.
Entry: $62.90 – $63.20
Stop-Loss: $61.95
Targets: TP1 $63.80 · TP2 $64.70 · TP3 $66.00
RRR (from $63.10): Risk $1.15 → TP3 +$2.90 = ~1:2.5 ✅
Why this works:
Confluence: Donchian support ($62.91) + 200 EMA M15 ≈ $62.38 (white).
Structure: Higher highs/lows since Aug-20; volume expands on pushes, compresses on pullbacks.
HTF context: H4 pressing toward 200 EMA ≈ $64.7–$65.0 (key pivot).
Execution: Look for a bullish rejection/engulfing inside the box + 8/21 EMA hold (orange/blue) above the 200 EMA (white).
Risk: ≤ 1%. Move SL→BE after TP1.
Trade Confidence: ⭐⭐⭐⭐ (High if retest holds and 8/21 maintain bullish structure)
🔒 Want more? The Prime version below adds: alternate short plan at $64.7–$65.0, management ladder, HL tight-stop variant (~4R), and a full execution checklist. Follow on Skool, link in profile!
⚠️ Trading involves risk. Manage exposure and trade responsibly.
💬 Thoughts on this setup?

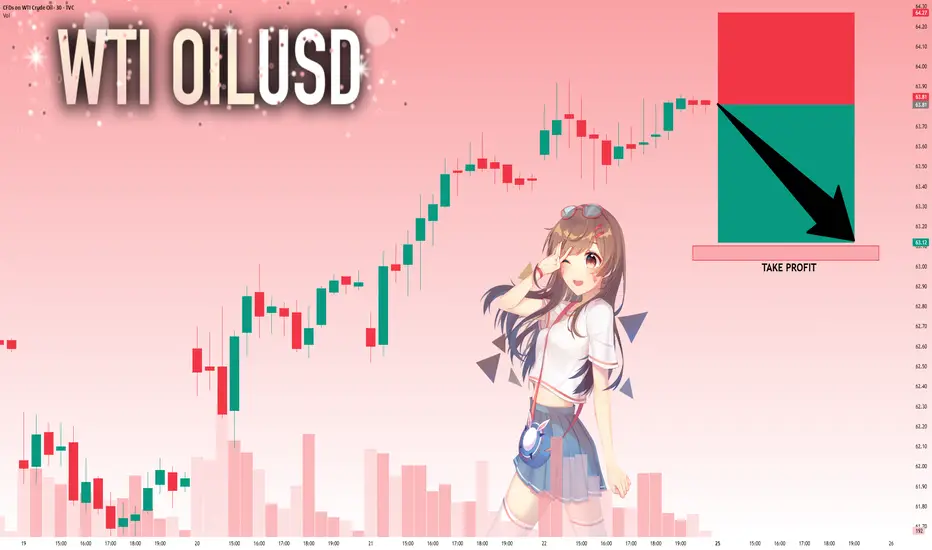
USOIL SENDS CLEAR BEARISH SIGNALS|SHORT
USOIL SIGNAL
Trade Direction: short
Entry Level: 63.73
Target Level: 61.24
Stop Loss: 65.36
RISK PROFILE
Risk level: medium
Suggested risk: 1%
Timeframe: 8h
Disclosure: I am part of Trade Nation's Influencer program and receive a monthly fee for using their TradingView charts in my analysis.
✅LIKE AND COMMENT MY IDEAS✅

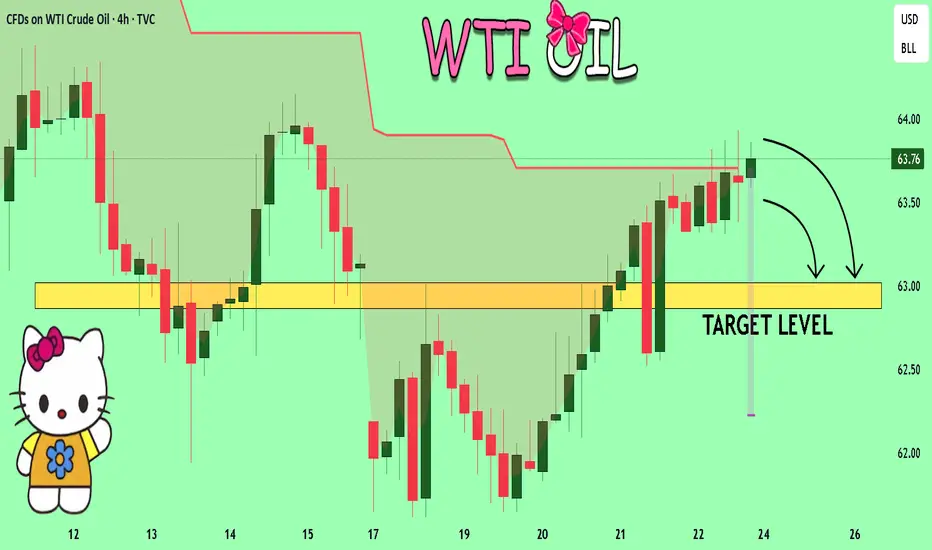
USOIL Set To Fall! SELL!
My dear subscribers,
This is my opinion on the USOIL next move:
The instrument tests an important psychological level 63.76
Bias - Bearish
Technical Indicators: Supper Trend gives a precise Bearish signal, while Pivot Point HL predicts price changes and potential reversals in the market.
Target - 63.02
About Used Indicators:
On the subsequent day, trading above the pivot point is thought to indicate ongoing bullish sentiment, while trading below the pivot point indicates bearish sentiment.
Disclosure: I am part of Trade Nation's Influencer program and receive a monthly fee for using their TradingView charts in my analysis.
———————————
WISH YOU ALL LUCK
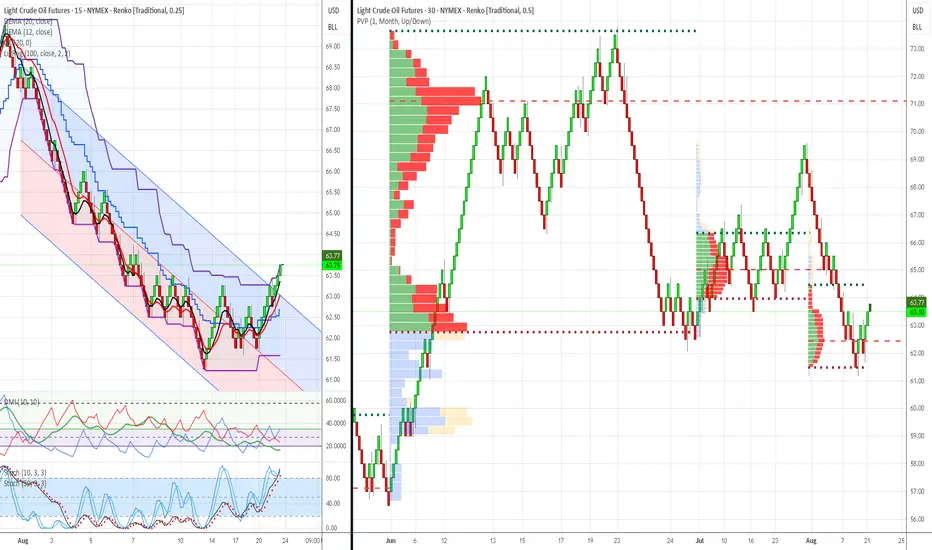
WTI Crude Oil Trading Analysis: June-August 2025 - 25-AugustWTI Crude Oil Trading Analysis: June-August 2025 Review & Week of August 25th Recommendations
Analysis Date : August 23, 2025
Market : WTI Crude Oil Futures (CL1!)
Methodology : Dual Renko Chart System ($0.25/15min + $0.50/30min)
Volume Profile : 3-Month Monthly Analysis (June-August 2025)
Executive Summary
Market Regime: Oil has completed a major corrective phase from $72 highs to $61 lows, establishing a clear bottoming pattern with strong institutional accumulation. Current setup presents high-probability bullish swing opportunity with excellent risk/reward characteristics.
Current Status : Bullish reversal confirmed with multiple technical confluences at critical support zone. Recommended positioning for upside targets with systematic risk management protocols.
3-Month Market Structure Analysis (June-August 2025)
Phase 1: Distribution & Breakdown (June-July)
Price Action: $72 → $61 (-15% decline)
June Peak: Heavy red volume distribution at $71-72 level indicated institutional selling
July Decline: Clean Renko downtrend with sustained selling pressure
Volume Profile: Minimal volume during decline, suggesting limited buying interest until $63-64 zone
Phase 2: Accumulation & Reversal Setup (Late July-August)
Price Action: $61 → $63.50 (+4% recovery)
Institutional Buying: Massive green volume accumulation at $63-65 level
Support Establishment: $62-63 zone showing strong buying interest
Technical Reversal: DEMA crossover confirmed bullish momentum shift
Volume Profile Key Levels (3-Month Analysis)
Major Support Zones :
$62-63: Primary institutional accumulation (heaviest green volume)
$60-61: Secondary support with moderate green volume
$58-59: Ultimate support level (limited historical volume)
Resistance Zones:
$66-67: First institutional resistance (mixed volume)
$69-70: Major distribution zone (heavy red volume from June)
$71-72: Ultimate resistance (peak selling pressure)
Current Technical Analysis (August 23, 2025)
Dual Chart Assessment
$0.50 Chart (Structure Analysis):
Trend: Clear bottoming pattern completed at $61 low
Current Position: Testing above major institutional accumulation zone
Volume Confirmation: Trading within heaviest 3-month green volume cluster
Structure: Higher lows pattern emerging since $61 bottom
$0.25 Chart (Execution Analysis):
DEMA Status: Bullish crossover confirmed (Black above Red at $63.00)
DMI/ADX: +DI gaining momentum, ADX rising through 25 level
Donchian Position: Price above basis, testing toward upper band
Recent Action: 3 consecutive green bricks confirming upward momentum
Technical Confluences Supporting Bull Case
Volume Profile: Massive institutional support at current levels
DEMA Crossover: Clear trend reversal signal confirmed
Momentum: DMI showing bullish shift with strengthening ADX
Structure: Higher low pattern vs. $61 bottom
Risk/Reward: Excellent positioning near major support zone
Market Context & Macro Considerations
Current Oil Market Dynamics
Supply: OPEC+ spare capacity at 5.9 million b/d (bearish)
Demand: China slowdown offset by US resilience (neutral)
Inventories: Below 5-year average (bullish)
Refining: Margins supporting crude demand (bullish)
Federal Reserve Impact
Policy Stance: Potential September rate cut (bullish for commodities)
Dollar Weakness: Could support oil prices
Inflation Expectations: Rising energy costs could influence policy
Seasonal Factors
Driving Season: Peak summer demand ending (bearish)
Hurricane Season: Atlantic activity potential (bullish)
Refinery Maintenance: September turnaround season (mixed)
Conclusion & Strategic Outlook
Near-Term Assessment (1-2 weeks): The current setup represents a high-probability swing trading opportunity with exceptional risk/reward characteristics. The combination of institutional volume support, technical reversal signals, and favorable market structure creates optimal conditions for bullish positioning.
Medium-Term Outlook (1-3 months): Successful navigation through the $66-68 resistance zone could establish a broader recovery toward $70-72 levels. However, macroeconomic headwinds and seasonal factors require careful position management and profit-taking discipline.
Risk Assessment: While the setup is compelling, traders must respect the institutional accumulation levels as ultimate support. Any violation of the $62 zone would invalidate the bullish thesis and require immediate position liquidation.
Strategic Advantage: The dual Renko chart system provides both structural clarity and tactical precision, enabling confident position sizing and systematic risk management. The monthly volume profile offers institutional-level insight typically unavailable to retail traders.
Document Classification: Trading Analysis & Recommendations
Risk Disclaimer: Past performance does not guarantee future results. All trading involves risk of loss.
CRUDE OIL Pullback Ahead! Sell!
Hello,Traders!
CRUDE OIL is etching closer
And closer towards the
Horizontal resistance of 64.60$
So as we are bearish biased
We will be expecting a local
Pullback on Monday
After the retest
Sell!
Comment and subscribe to help us grow!
Check out other forecasts below too!
Disclosure: I am part of Trade Nation's Influencer program and receive a monthly fee for using their TradingView charts in my analysis.

USOIL: Swing Trading & Technical Analysis
The recent price action on the USOIL pair was keeping me on the fence, however, my bias is slowly but surely changing into the bearish one and I think we will see the price go down.
Disclosure: I am part of Trade Nation's Influencer program and receive a monthly fee for using their TradingView charts in my analysis.
❤️ Please, support our work with like & comment! ❤️
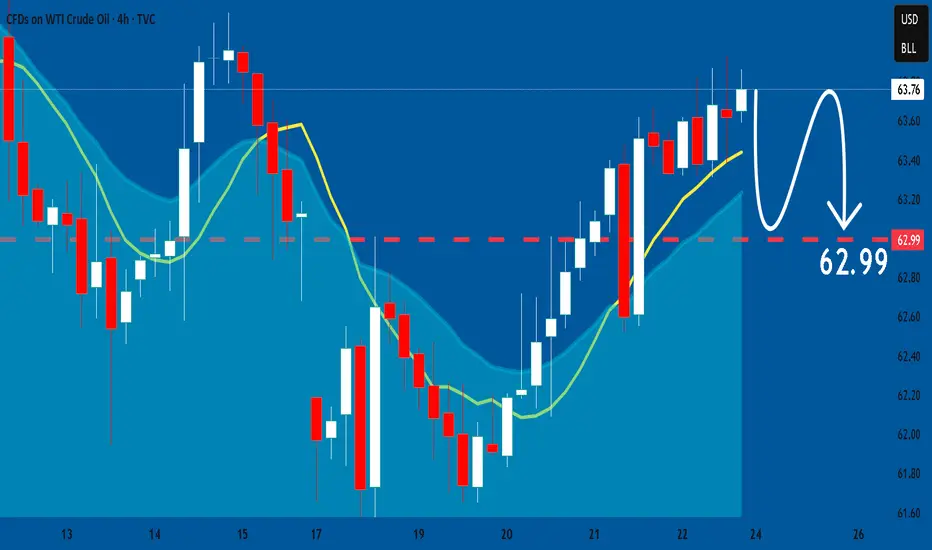
USOIL: Strong Bearish Sentiment! Short!
My dear friends,
Today we will analyse USOIL together☺️
The recent price action suggests a shift in mid-term momentum. A break below the current local range around 63.81 will confirm the new direction downwards with the target being the next key level of 63.10 and a reconvened placement of a stop-loss beyond the range.
❤️Sending you lots of Love and Hugs❤️
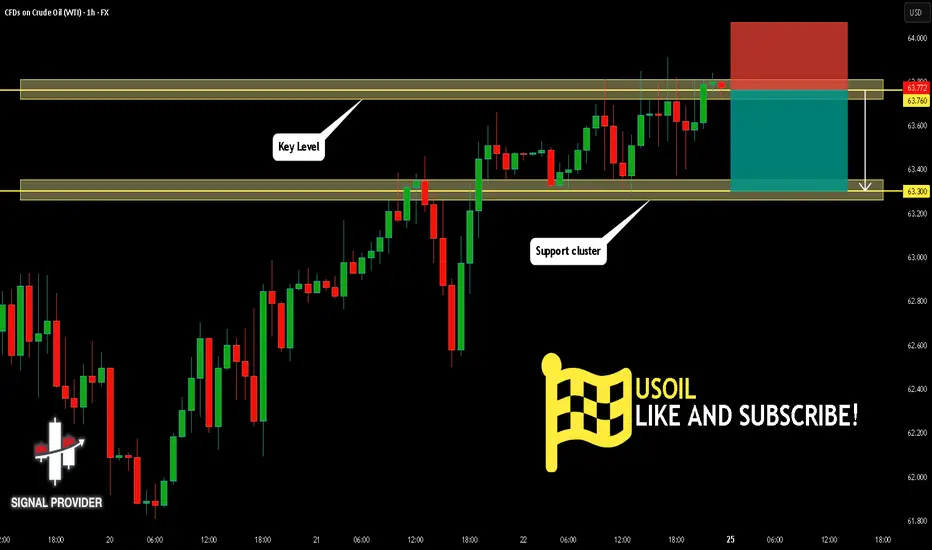
USOIL Is Going Down! Sell!
Please, check our technical outlook for USOIL.
Time Frame: 1h
Current Trend: Bearish
Sentiment: Overbought (based on 7-period RSI)
Forecast: Bearish
The market is approaching a significant resistance area 63.760.
Due to the fact that we see a positive bearish reaction from the underlined area, I strongly believe that sellers will manage to push the price all the way down to 63.300 level.
P.S
Overbought describes a period of time where there has been a significant and consistent upward move in price over a period of time without much pullback.
Disclosure: I am part of Trade Nation's Influencer program and receive a monthly fee for using their TradingView charts in my analysis.
Like and subscribe and comment my ideas if you enjoy them!
CRUDE OIL SHORT FROM RESISTANCE|
✅CRUDE OIL is going up now
But a strong resistance level is ahead at 64.50$
Thus I am expecting a pullback
And a move down towards the target of 63.33$
SHORT🔥
✅Like and subscribe to never miss a new idea!✅


Hellena | Oil (4H): SHORT to support area of 60 (Wave "3").Wave “C” continues to develop in a five-wave movement. Right now, I think wave “1” has just ended and we will see a small correction to the 66,280 area (wave ‘2’), after which I expect wave “3” to develop, which should go further than the 60 support level, but this is a fairly strong psychological level at which it would be good to take profits.
Manage your capital correctly and competently! Only enter trades based on reliable patterns!

USOIL - intradayPrice has been hovering under ~63 I was hoping we get a break in the Asian session but as always it's chop city.
Now price breaking below VWAP is what I am watching, no confirmation yet but volume efficiency is suggesting bears are slightly in control right now.
NFA
USOIL - 1HMarket hovering around ~63 which validates my earlier post.
Now considering if bulls can keep the momentum going, next target is ~64-64.2 right into resistance.
Earlier price rejected at 62.6-7 area few times only to fill the FVG below and break above 62.7 shows bulls weren't playing around.
Now I am skeptical since we have our friend Jerry speaking tomorrow to ruin our lives, I am betting bulls will keep the momentum going till Jerry speaks.
If he's dovish we make a break above 64, if he's hawkish we will see bearish momentum continuing till 60 IMO.
NFA

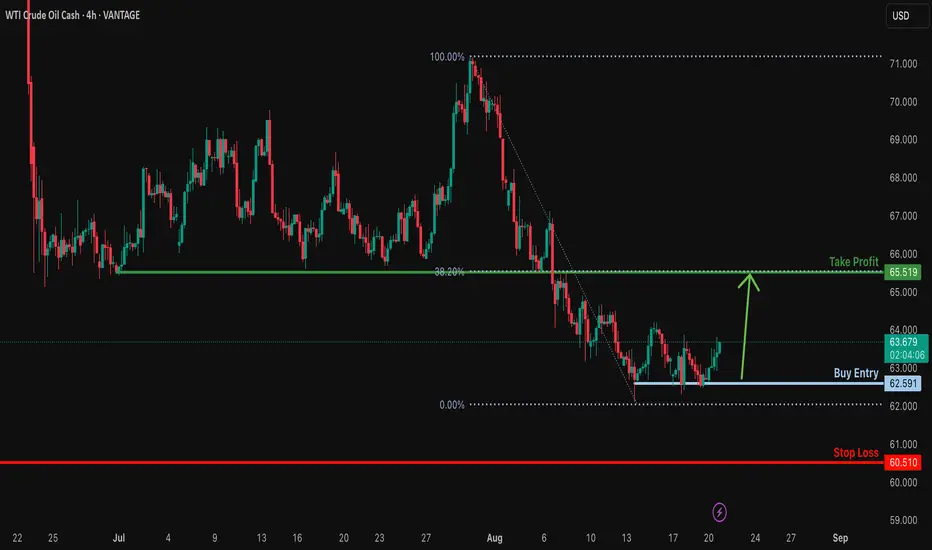
Bullish reversal off pullback support?USO/USD has bounced off the support level, which is a pullback support, and could potentially rise from this level to our take profit.
Entry: 62.59
Why we like it:
There is a pullback support level.
Stop loss: 60.51
Why we lik eit:
There is a multi swing low support.
Take profit: 65.51
Why we like it:
There is a pullback resistance level that lines up witht he 38.2% Fibonacci retracement.
Enjoying your TradingView experience? Review us!
Please be advised that the information presented on TradingView is provided to Vantage (‘Vantage Global Limited’, ‘we’) by a third-party provider (‘Everest Fortune Group’). Please be reminded that you are solely responsible for the trading decisions on your account. There is a very high degree of risk involved in trading. Any information and/or content is intended entirely for research, educational and informational purposes only and does not constitute investment or consultation advice or investment strategy. The information is not tailored to the investment needs of any specific person and therefore does not involve a consideration of any of the investment objectives, financial situation or needs of any viewer that may receive it. Kindly also note that past performance is not a reliable indicator of future results. Actual results may differ materially from those anticipated in forward-looking or past performance statements. We assume no liability as to the accuracy or completeness of any of the information and/or content provided herein and the Company cannot be held responsible for any omission, mistake nor for any loss or damage including without limitation to any loss of profit which may arise from reliance on any information supplied by Everest Fortune Group.
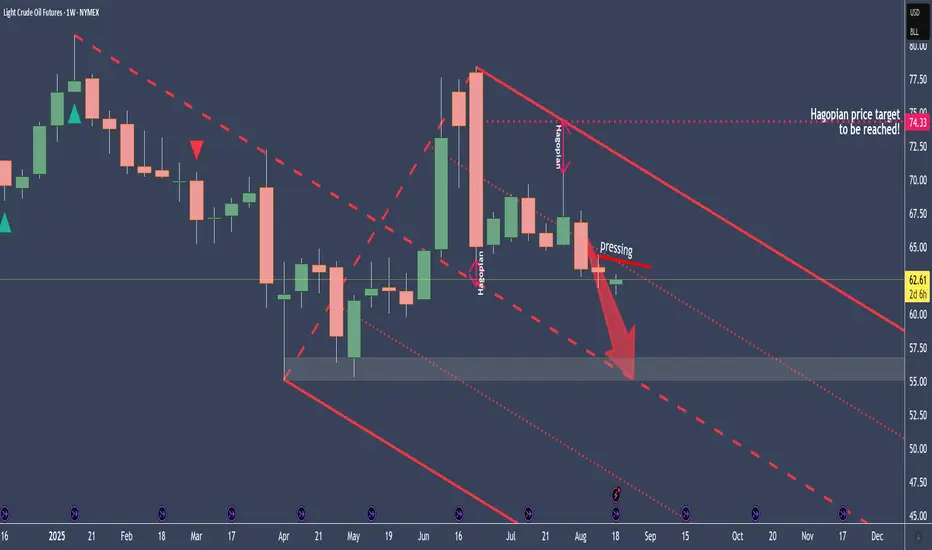
Crude Oil - Why I see it at $56 in the coming weeksCrude is trading below the centerline.
The pressing shows that the “election whales” don’t want higher prices at the moment.
Why?
No idea, and it doesn’t matter either.
All I’m interested in is where I can find a good entry to short crude. For example, a pullback to the pressure line, with a money management stop, or behind one of the weekly candles. It’s all a question of how much risk you’re allowed to take according to risk management.
Let’s see if we get an entry to join the sleigh ride down to the centerline.
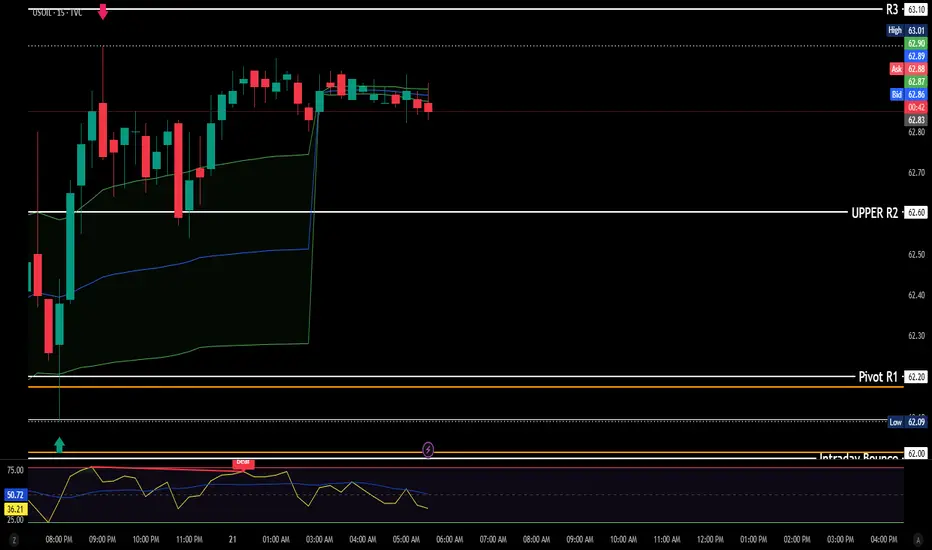
USOIL - lookoutMultiple rejections at R2 on 1H as marked, however price bounced back from the R1 pivot.
It seems traders are trying to hold price in anticipation of the EIA data tomorrow.
Personally I feel R3 will be hit, but I would trade cautiously, if you're like me and missed the move. Wait for confirmations, don't just jump in.
NFA

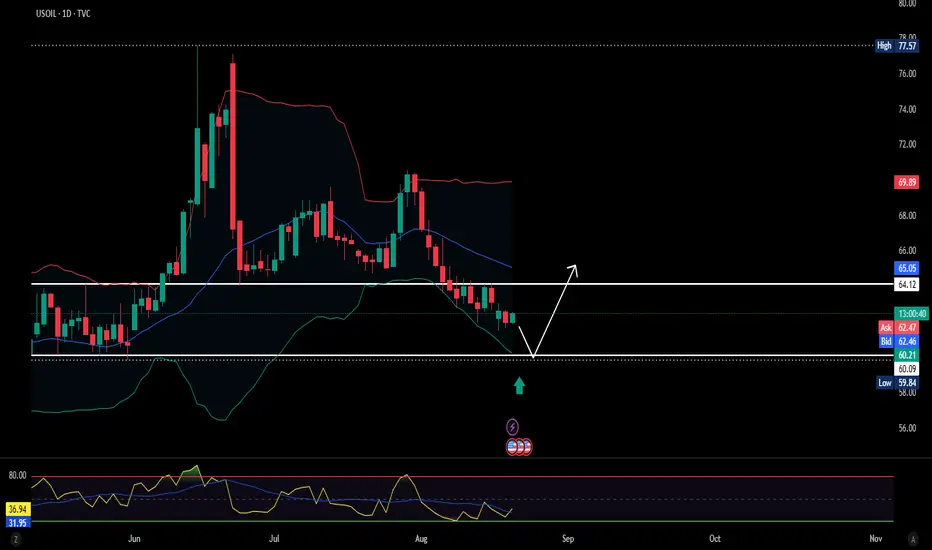
WTI OIL Buy signal if the 4H MA50 breaks.WTI Oil (USOIL) appears to have found short-term Support since the August 13 Low, turning sideways, with its 4H RSI however on Higher Lows, thus displaying a Bullish Divergence.
This is similar to the June 24 - July 02 Bullish Divergence, which once it broke above the 4H MA50 (blue trend-line), it topped a little over the 0.382 Fibonacci retracement level.
As a result, we will be waiting for the 4H MA50 bullish break-out signal to target $65.60 (Fib 0.382).
-------------------------------------------------------------------------------
** Please LIKE 👍, FOLLOW ✅, SHARE 🙌 and COMMENT ✍ if you enjoy this idea! Also share your ideas and charts in the comments section below! This is best way to keep it relevant, support us, keep the content here free and allow the idea to reach as many people as possible. **
-------------------------------------------------------------------------------
Disclosure: I am part of Trade Nation's Influencer program and receive a monthly fee for using their TradingView charts in my analysis.
💸💸💸💸💸💸
👇 👇 👇 👇 👇 👇

Crude Oil Warning $66.40 Flip Signals $63.86 TargetWTI rolled over after failing near $68.66096 (top red dashed line). The breakdown through $66.40002 turned that level into resistance 🚧. After a sharp selloff, price is now hovering around the $65.54 area (thin entry line labeled 65.54232), just beneath the minor pivot band at 65.54 / 65.52 / 65.21 (green dashed cluster labeled 65.54232 • 65.52347 • 65.20824). The structure is lower-high → lower-low, which keeps momentum bearish while price holds below $66.40. If sellers keep control, the next magnet is the confluence support around $63.86661 (first lower green dashed line), with extension into $63.51000–$63.46746 if momentum accelerates.
You can also see repeated “S” tags on the push down from the high and into the mid-range, while the “B” tags cluster only at pullback lows—classic distribution behavior. Any spikes toward $66.07 (label 66.07275) and especially $66.40 should attract supply unless bulls reclaim and hold above that zone.
Trade setup 🎯 (from the chart):
• Entry: $65.54232 (≈ $65.54)
• Stop-loss: $66.07275 (≈ $66.07), conservative SL above $66.40002 if you prefer more room
• Targets: $63.86661 first take-profit; stretch targets $63.51000 → $63.46746
This offers a solid bearish R:R while price stays capped beneath $66.40. As it moves your way, book small profits 💰 at each objective, trail stops 🔒 (e.g., to $65.52 once under $65.21), and size the position to your own risk tolerance—WTI can spike on headlines.
Invalidation: A sustained reclaim and hold above $66.40 would neutralize the immediate bearish bias and open room back toward $68.66. Until then, the path of least resistance remains down 📉.

SELL USOILOur trade for today is on OIL as usual, in which we're going short after that the market grabbed the liquidity and gave us a clean entry to take.
Follow for more!

USOIL - Swing IdeaSo I am just speculating, price is kind of rangebound for now but hear me out.
The Asskonhole tomorrow with the lizard people may or may not provide the fuel for the price to revisit ~60 area and we could see a nice bounce.
I mean I don't see why we can't revisit ~64-65 earlier but we would need some sort of war news or supply shock.
this is purely speculation and NFA
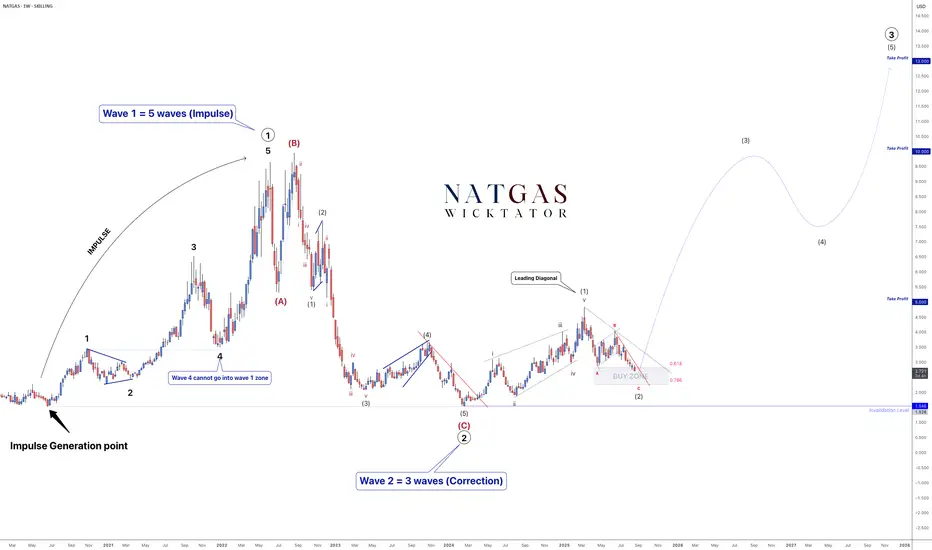
NATGAS - Catch The Impulse!As Wave Traders, our job is to spot corrections and catch the impulse, because that’s where the biggest moves happen.
On NATGAS, we completed Wave 1 with a leading diagonal, and are now finishing Wave 2 (an ABC correction). Once corrections are done, the next phase is Wave 3 - historically the longest and strongest wave in Elliott Wave Theory.
We've almost completed wave 2 and looking for a breakout for wave 3, which is the longest wave.
Trade Idea:
- Watch for break of the red trendline to indicate the start of wave 3
- enter with stops below breakout or below invalidation
- Targets: 5, 10, 13
NATGAS 12H Chart:
We'll be looking to enter on break of the red trendline with stops below breakout.
This setup is a textbook example of how Elliott Wave helps us prepare - not chase - the market.
Goodluck and as always, trade safe!
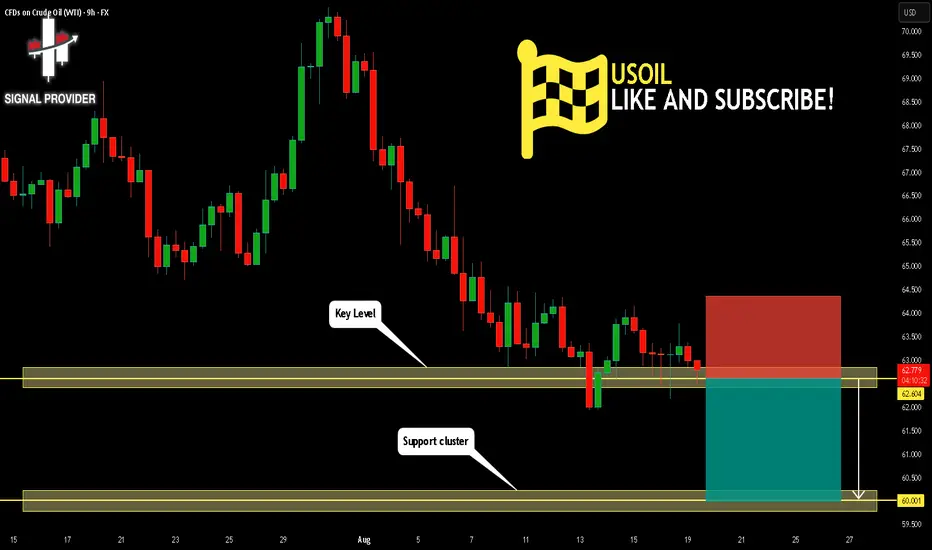
USOIL Will Move Lower! Sell!
Please, check our technical outlook for USOIL.
Time Frame: 9h
Current Trend: Bearish
Sentiment: Overbought (based on 7-period RSI)
Forecast: Bearish
The market is trading around a solid horizontal structure 62.604.
The above observations make me that the market will inevitably achieve 60.001 level.
P.S
We determine oversold/overbought condition with RSI indicator.
When it drops below 30 - the market is considered to be oversold.
When it bounces above 70 - the market is considered to be overbought.
Disclosure: I am part of Trade Nation's Influencer program and receive a monthly fee for using their TradingView charts in my analysis.
Like and subscribe and comment my ideas if you enjoy them!