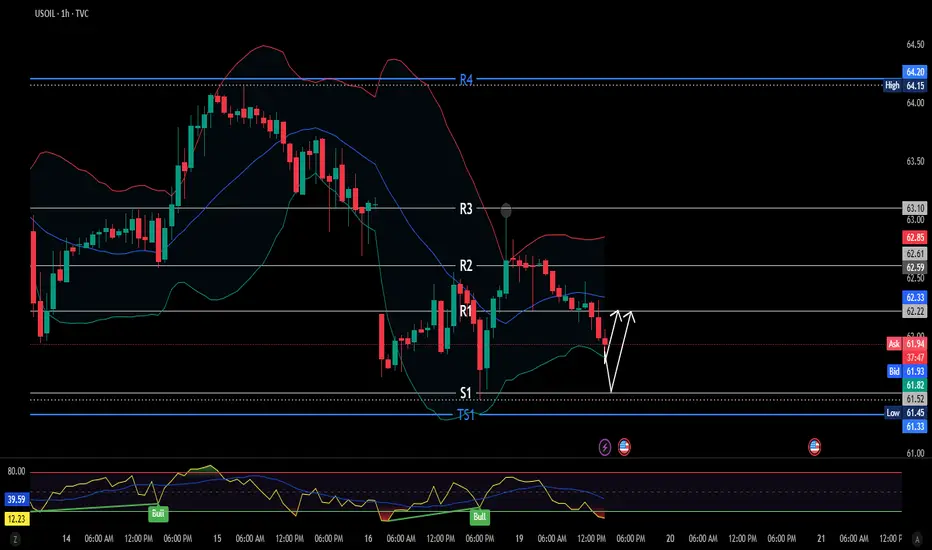
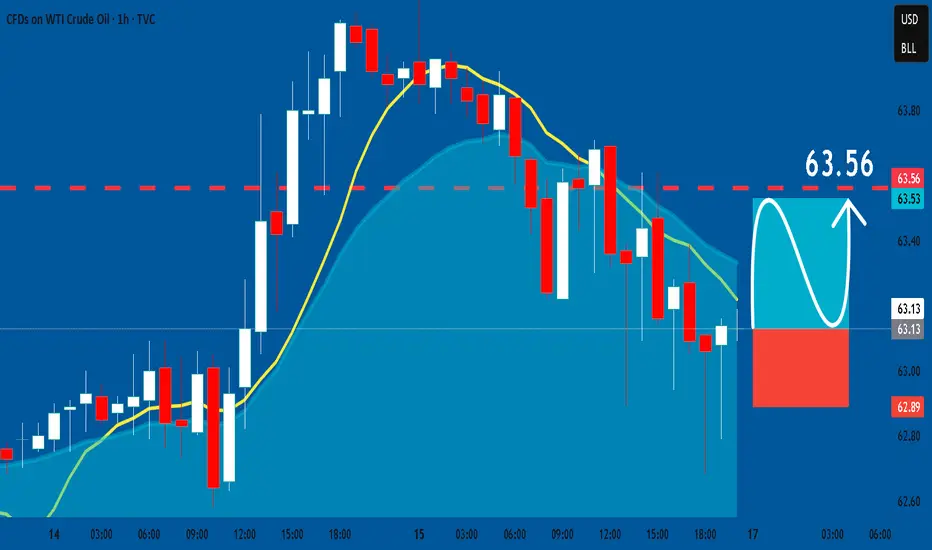
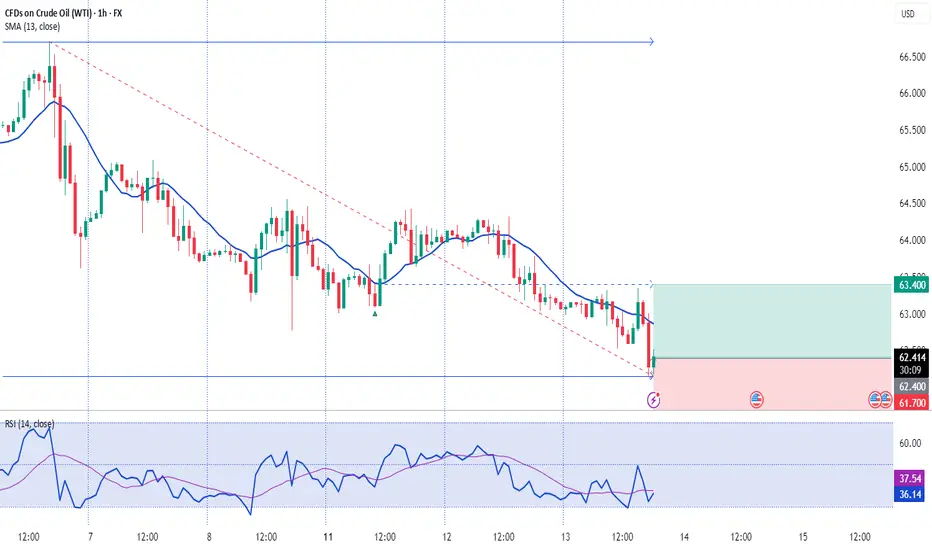
USOIL price reactionFVG on 15 min filled, now price could react here and we get a bounce to R1, 1H lower BB is essentially the bottom of the 15min FVG.
If price doesn't hold the 61.8-62 area, price could retrace to S1.
RSI on oversold 1H, 15 min
Crude Oil WTI
Oil Prices Drop on Russia-Ukraine Talks HopeOil prices decline in anticipation of potential negotiations between Russia and Ukraine
U.S. President Donald Trump announced plans to facilitate a meeting between Ukrainian President Volodymyr Zelenskiy and Russian President Vladimir Putin, following his Monday summit with Zelenskiy and European leaders. Zelenskiy called the talks with Trump “very productive,” highlighting discussions on U.S. security assurances for Ukraine. A resolution to the Russia-Ukraine conflict could lift sanctions on Russian energy exports, freeing up crude oil trade. Oil prices have dropped around 10% this month due to trade tensions and increased OPEC+ production.
Technically the price consolidates below the intermediate 6,300.00, forming the bearish pennant. Price is getting ready to decline. Here, the first target will be the major level of 6,000.00.


TP REACHED2h ago, I posted to sell on USOIL, the price has reached our target 15min ago.
A good trade for the beginning of the week!
Follow for more!

USOIL BULLS ARE STRONG HERE|LONG
USOIL SIGNAL
Trade Direction: long
Entry Level: 62.42
Target Level: 68.54
Stop Loss: 58.34
RISK PROFILE
Risk level: medium
Suggested risk: 1%
Timeframe: 1D
Disclosure: I am part of Trade Nation's Influencer program and receive a monthly fee for using their TradingView charts in my analysis.
✅LIKE AND COMMENT MY IDEAS✅

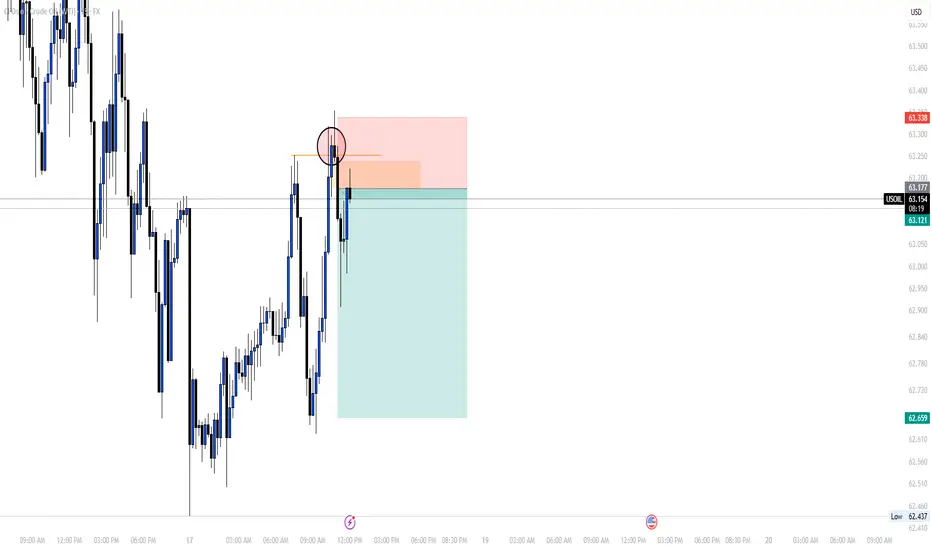
SELL USOILHere we are again with a new trade on USOIL, in which u=you can sell following the same levels as mine.
We sold after that the price did grab the liquidity and gave us a FVG to enter based on.
Follow for more!
WTI Holds 62 Support Ahead of Washington TalksFriday’s meeting in Alaska set the stage for a potential shift in U.S.–Russia relations. Putin’s terms, discussed privately, are expected to be presented today in Washington during talks between Trump, Zelensky, and EU allies toward a possible ceasefire.
WTI’s latest drop is currently holding at the 0.618 Fibonacci retracement of the May–June uptrend, and precisely at the neckline of the inverted head and shoulders pattern around the $62 level. The Fibonacci retracement was applied from the $55 low to the $77.80 close, filtering out breakout noise beyond the upper border of the 3-year down trending channel.
• If 62 breaks, downside risks may accelerate toward the mid-zone of the channel, with key levels in sight at 61.40, 59.40, and 55.20, respectively.
• If 62.60 holds, and WTI reclaims ground above 65, we could see a recovery toward the upper edge with next resistance levels at 68.00, 70.00, 71.40, and 72.70.
Written by Razan Hilal, CMT

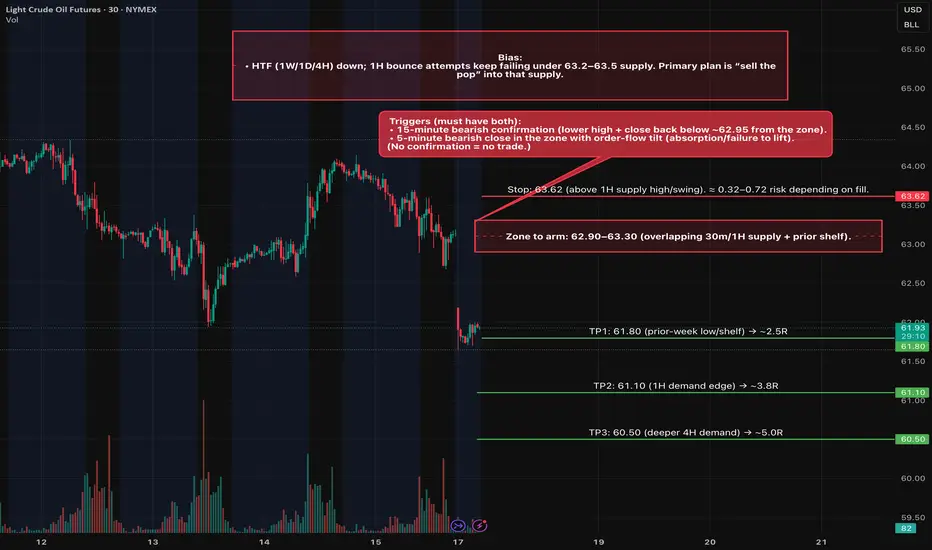
CL (Oil Futures) Short Trade Idea 08/17Setup
• Type: Rejection of 4H/1H supply → continuation lower.
• Zone to arm: 62.90–63.30 (overlapping 30m/1H supply + prior shelf).
• Triggers (must have both):
• 15-minute bearish confirmation (lower high + close back below ~62.95 from the zone).
• 5-minute bearish close in the zone with order-flow tilt (absorption/failure to lift).
(No confirmation = no trade.)
Entry & Risk
• Entry: MOS on the confirming 5m close within 62.90–63.30.
• Stop: 63.62 (above 1H supply high/swing). ≈ 0.32–0.72 risk depending on fill.
• Size: Calibrate so full-stop loss = ≤ 1R of your plan.
Targets (R:R from 63.10 mid-entry, 0.52 stop)
• TP1: 61.80 (prior-week low/shelf) → ~2.5R
• TP2: 61.10 (1H demand edge) → ~3.8R
• TP3: 60.50 (deeper 4H demand) → ~5.0R
Management
• Scale 1/2 at TP1; trail above last 5m swing after a fresh LL or hold for TP2.
• If price tags 63.30–63.50 and closes 15m above 63.50, invalidate the short idea until structure resets.
• Avoid fresh risk within ~10–15 min of EIA Wed 10:30 ET; re-arm after the first post-release 15m bar closes.
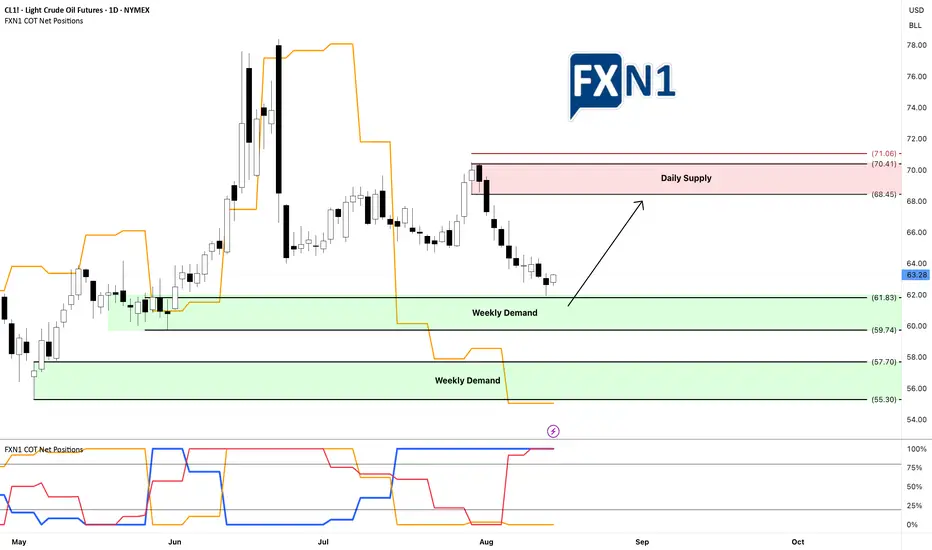
Oil Market Insights: Demand Zones and Future FundamentalsYesterday, CL1! oil tested and rebounded from my weekly demand zone without triggering my entry, resulting in a missed opportunity for several points. This suggests to me that there is buying interest at this level, regardless of the fact that non-commercial traders are short. I am now looking for a retest of this area—if I'm fortunate—to enter a long position. I am also awaiting the new COT data tomorrow to assess any potential shifts in fundamentals. Additionally, I am considering the presence of a stronger demand zone below, which appears even more promising. We'll see how it unfolds.
✅ Please share your thoughts about CL1! in the comments section below and HIT LIKE if you appreciate my analysis. Don't forget to FOLLOW ME; you will help us a lot with this small contribution.
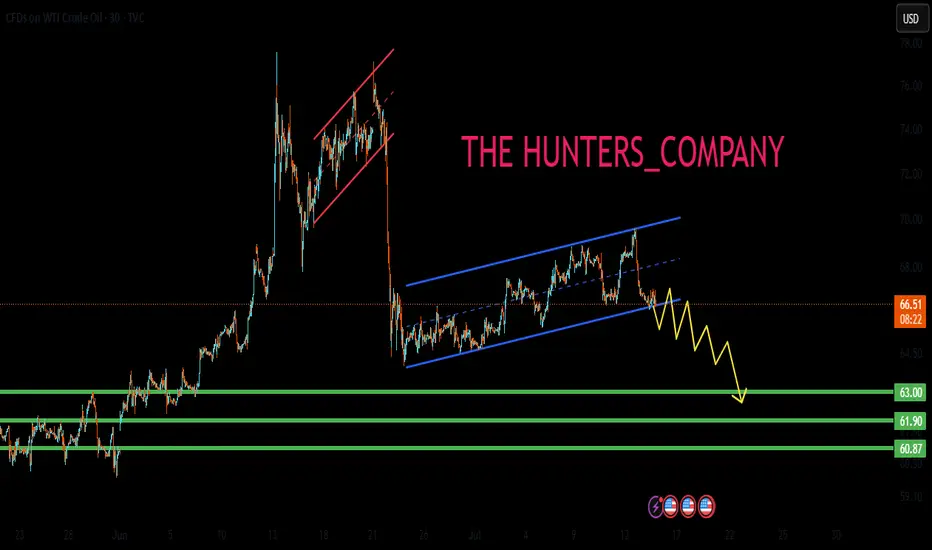
USOIL H2 BEARISH CHANNEL BREAKOUT Usoil H2 Bearsih Channel Breakout
Price From Break The Channel : 63.0
We Are Looking For A Bullish Moment At Entry 63.0 / 60.0
Targeting Area Buy Side Liquidity Area 70.0
Manage Your Trade Properly And Follow Us For More Trades

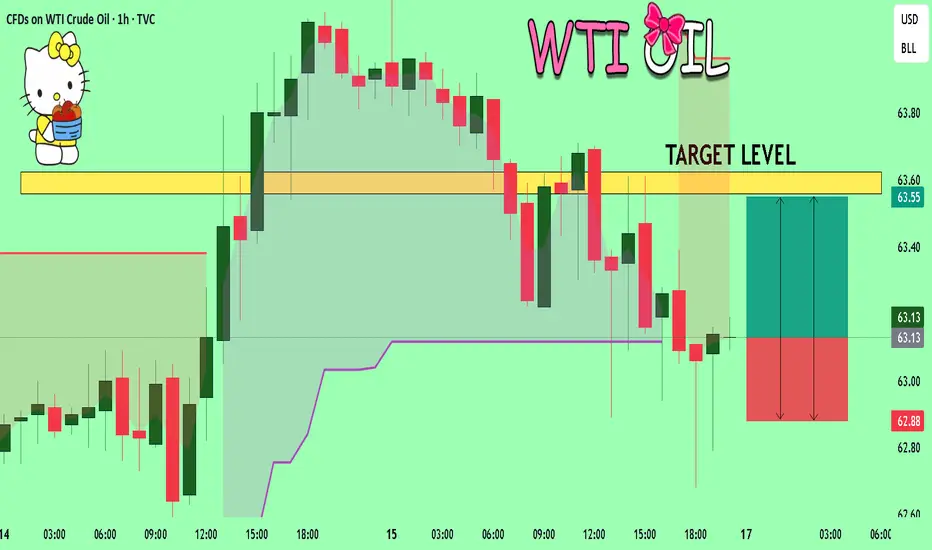
USOIL: Long Signal Explained
USOIL
- Classic bullish formation
- Our team expects growth
SUGGESTED TRADE:
Swing Trade
Buy USOIL
Entry Level - 63.13
Sl - 62.89
Tp - 63.56
Our Risk - 1%
Start protection of your profits from lower levels
Disclosure: I am part of Trade Nation's Influencer program and receive a monthly fee for using their TradingView charts in my analysis.
❤️ Please, support our work with like & comment! ❤️
USOIL: Move Up Expected! Long!
My dear friends,
Today we will analyse USOIL together☺️
The market is at an inflection zone and price has now reached an area around 63.130 where previous reversals or breakouts have occurred.And a price reaction that we are seeing on multiple timeframes here could signal the next move up so we can enter on confirmation, and target the next key level of 63.501.Stop-loss is recommended beyond the inflection zone.
❤️Sending you lots of Love and Hugs❤️
USOIL Will Explode! BUY!
My dear friends,
USOIL looks like it will make a good move, and here are the details:
The market is trading on 63.13 pivot level.
Bias - Bullish
Technical Indicators: Supper Trend generates a clear long signal while Pivot Point HL is currently determining the overall Bullish trend of the market.
Goal - 63.56
Recommended Stop Loss - 62.88
About Used Indicators:
Pivot points are a great way to identify areas of support and resistance, but they work best when combined with other kinds of technical analysis
Disclosure: I am part of Trade Nation's Influencer program and receive a monthly fee for using their TradingView charts in my analysis.
———————————
WISH YOU ALL LUCK
BRIEFING Week #33 : Status Quo... for nowHere's your weekly update ! Brought to you each weekend with years of track-record history..
Don't forget to hit the like/follow button if you feel like this post deserves it ;)
That's the best way to support me and help pushing this content to other users.
Kindly,
Phil

US OIL SELL...Hello friends🙌
🔊As you can see, this chart works well in forming a channel, and now that
we have witnessed a price drop, the price has reached the bottom of the channel, and given the previous heavy drop, the channel shows that the power is currently in the hands of sellers and it is likely that the specified targets will move.
🔥Follow us for more signals🔥
Trade safely with us
USOIL BULLISH BIAS RIGHT NOW| LONG
USOIL SIGNAL
Trade Direction: long
Entry Level: 63.09
Target Level: 68.58
Stop Loss: 59.42
RISK PROFILE
Risk level: medium
Suggested risk: 1%
Timeframe: 1D
Disclosure: I am part of Trade Nation's Influencer program and receive a monthly fee for using their TradingView charts in my analysis.
✅LIKE AND COMMENT MY IDEAS✅

USOIL H4 | Bearish reversal off pullback resistanceBased on the H4 chart analysis, we could see the price rise to the sell entry, which is pullback resistance that is slightly above the 23.6% Fibonacci retracement and could drop from this level to the take profit.
Sell entry is at 63.82, which is a pullback resistance that is slightly above the 23.6% Fibonacci retracement.
Stop loss is at 66.33, which is a pullback resistance that is slightly below the 61.8% Fibonacci retracement.
Take profit is at 60.05, which is a multi swing low support.
High Risk Investment Warning
Trading Forex/CFDs on margin carries a high level of risk and may not be suitable for all investors. Leverage can work against you.
Stratos Markets Limited (tradu.com ):
CFDs are complex instruments and come with a high risk of losing money rapidly due to leverage. 65% of retail investor accounts lose money when trading CFDs with this provider. You should consider whether you understand how CFDs work and whether you can afford to take the high risk of losing your money.
Stratos Europe Ltd (tradu.com ):
CFDs are complex instruments and come with a high risk of losing money rapidly due to leverage. 66% of retail investor accounts lose money when trading CFDs with this provider. You should consider whether you understand how CFDs work and whether you can afford to take the high risk of losing your money.
Stratos Global LLC (tradu.com ):
Losses can exceed deposits.
Please be advised that the information presented on TradingView is provided to Tradu (‘Company’, ‘we’) by a third-party provider (‘TFA Global Pte Ltd’). Please be reminded that you are solely responsible for the trading decisions on your account. There is a very high degree of risk involved in trading. Any information and/or content is intended entirely for research, educational and informational purposes only and does not constitute investment or consultation advice or investment strategy. The information is not tailored to the investment needs of any specific person and therefore does not involve a consideration of any of the investment objectives, financial situation or needs of any viewer that may receive it. Kindly also note that past performance is not a reliable indicator of future results. Actual results may differ materially from those anticipated in forward-looking or past performance statements. We assume no liability as to the accuracy or completeness of any of the information and/or content provided herein and the Company cannot be held responsible for any omission, mistake nor for any loss or damage including without limitation to any loss of profit which may arise from reliance on any information supplied by TFA Global Pte Ltd.
The speaker(s) is neither an employee, agent nor representative of Tradu and is therefore acting independently. The opinions given are their own, constitute general market commentary, and do not constitute the opinion or advice of Tradu or any form of personal or investment advice. Tradu neither endorses nor guarantees offerings of third-party speakers, nor is Tradu responsible for the content, veracity or opinions of third-party speakers, presenters or participants.

CRUDE OIL Short From Resistance! Sell!
Hello,Traders!
CRUDE OIL is making a
Pullback and will soon hit
A horizontal resistance
Of 64.50$ and as we are
Bearish biased and we will
Be expecting a local
Bearish pullback
Sell!
Comment and subscribe to help us grow!
Check out other forecasts below too!
Disclosure: I am part of Trade Nation's Influencer program and receive a monthly fee for using their TradingView charts in my analysis.

Crude Levels (Non-Updated but still reactive)Just wanted to share my crude levels. Drew alot of these months ago and haven't adjusted alot of them...especially the boxes but general areas identified still seem to be reactive.
Will update these eventually, but not sure this will be a living chart once published.
~The Villain
Crude Levels (Non-Updated but still reactive)Just wanted to share my crude levels. Drew alot of these months ago and haven't adjusted alot of them...especially the boxes but general areas identified still seem to be reactive.
~The Villain
Heading into 38.2% Fibonacci resistance?USO/USD is rising towards the resistance level which is a pullback resistance that lines up with the 38.2% Fibonacci retracement and could drop from this levl ot our take profit.
Entry: 65.51
Why we like it:
There is a pullback resistance that lines up with the 38.25 Fibonacci retracement.
Stop loss: 67.41
Why we like it:
There is a pullback resistance that aligns with the 61.8% Fibonacci retracement.
Take profit: 62.69
Why we like it:
There is a pullback support.
Enjoying your TradingView experience? Review us!
Please be advised that the information presented on TradingView is provided to Vantage (‘Vantage Global Limited’, ‘we’) by a third-party provider (‘Everest Fortune Group’). Please be reminded that you are solely responsible for the trading decisions on your account. There is a very high degree of risk involved in trading. Any information and/or content is intended entirely for research, educational and informational purposes only and does not constitute investment or consultation advice or investment strategy. The information is not tailored to the investment needs of any specific person and therefore does not involve a consideration of any of the investment objectives, financial situation or needs of any viewer that may receive it. Kindly also note that past performance is not a reliable indicator of future results. Actual results may differ materially from those anticipated in forward-looking or past performance statements. We assume no liability as to the accuracy or completeness of any of the information and/or content provided herein and the Company cannot be held responsible for any omission, mistake nor for any loss or damage including without limitation to any loss of profit which may arise from reliance on any information supplied by Everest Fortune Group.
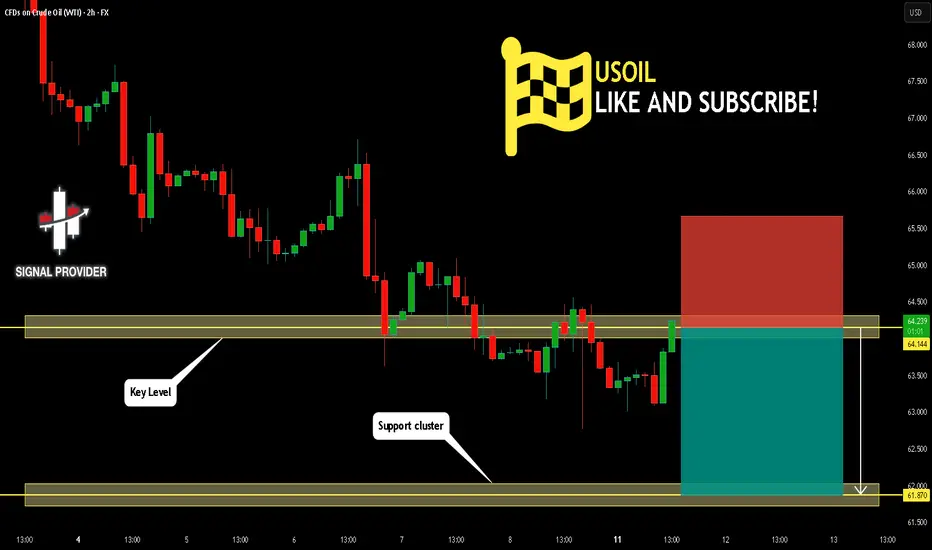
USOIL Is Going Down! Sell!
Take a look at our analysis for USOIL.
Time Frame: 2h
Current Trend: Bearish
Sentiment: Overbought (based on 7-period RSI)
Forecast: Bearish
The price is testing a key resistance 64.144.
Taking into consideration the current market trend & overbought RSI, chances will be high to see a bearish movement to the downside at least to 61.870 level.
P.S
Overbought describes a period of time where there has been a significant and consistent upward move in price over a period of time without much pullback.
Disclosure: I am part of Trade Nation's Influencer program and receive a monthly fee for using their TradingView charts in my analysis.
Like and subscribe and comment my ideas if you enjoy them!