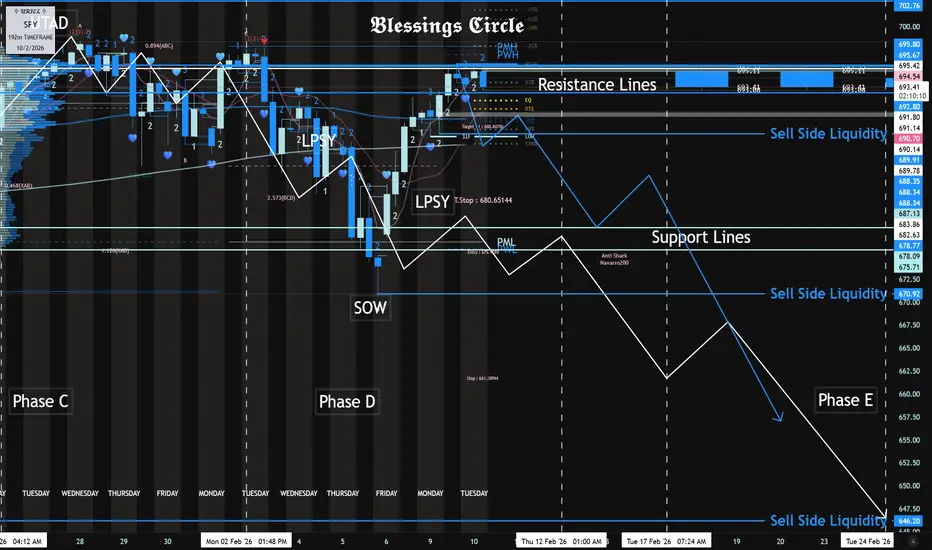
SPY Distribution Schematic Sub 650 by EOMAs Long As 695.80 - 695.67 Resistance Is Respected Today.
The Sells Targets Are As Follows:
SPY Sub 650 by Late Feb.
SPY Sub 600 by End of March.
Part Two:
UVXY
SPY Distribution Schematic Sub 650 by EOMSPY Sub 650 by Late Feb.
SPY Sub 600 by End of March.
AMEX:SPY CBOE:UVXY

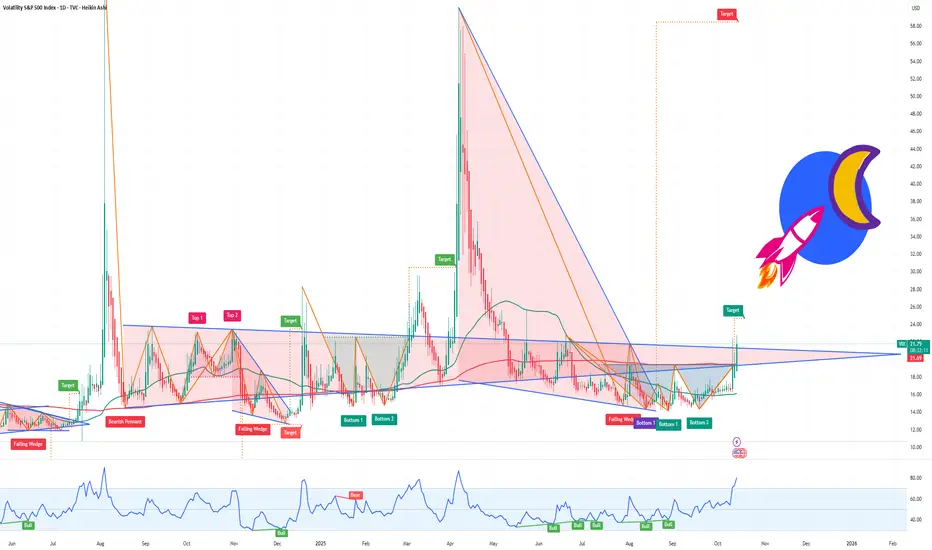
VIX short-term TASince the beginning of February the VIX has started an uptrend again, you should be cautious of market volatility in the upcoming days.

Vol shock incoming?Looks like we're getting very close to a vol reaction. I think that it's likely that we see one more move down before we can see volatility react.
I'd be looking to start accumulate calls/spot down in the $23-31 region as I think that we're getting very close to a large move in volatility.
Marked off levels to the upside. Let's see how high we go.

UVXY short-term TAUVXY is trying to reverse and getting ready for the push higher, currently there's a positive accumulation on hourly frame and daily frame is starting to accumulate as well, daily frame remains in the bearish area yet but it's improving and may break out soon. Keep an eye on VIX.

VIX The Calm Before the Next Wave of Volatility! Recession RisksAfter last week’s sharp selloff across equities and crypto, followed by a swift recovery on Monday, many traders are once again lulled into a sense of comfort. But beneath the surface, volatility is quietly building — and the VIX is starting to tell the story.
From Panic to Complacency — Too Fast
Friday’s market crash revealed how fragile sentiment still is. We saw broad-based liquidations, risk-off flows, and a short spike in volatility as traders scrambled for protection. Then, as if nothing happened, Monday brought a sharp rebound — driven by short-covering, dip-buying algos, and a belief that the correction was “overdone.”
Geopolitical Flashpoints: U.S.-China Tensions
The ongoing conflict between the U.S. and China over critical metals exports has intensified. China controls a large portion of rare earth metals, essential for electronics, batteries, and defense technology. Recent U.S. threats to impose sanctions or tariffs on key exports, coupled with potential Chinese retaliatory measures, have created uncertainty for supply chains.
Markets hate uncertainty. Every news cycle mentioning trade escalation acts like a volatility catalyst, as investors hedge against unexpected economic shocks. This alone can drive the VIX higher, even if the S&P 500 has short-term rallies.
Trump Tariff Threats and Market Psychology
Adding fuel to the fire, former President Trump has repeatedly hinted at renewed tariff measures. While the headlines may seem political theater, history shows that even the anticipation of tariffs can disrupt equities and spark short-term volatility spikes.
Friday’s selloff can be partially attributed to traders pricing in these geopolitical and policy risks, which are not reflected in earnings reports or fundamentals — making hedging through VIX-linked products increasingly attractive.
Earnings and Economic Signals
Beyond geopolitics, the earnings season will likely reveal weak spots across sectors. Companies exposed to global supply chains, tech hardware, and industrials may report margins under pressure. This combination — disappointing earnings and global trade uncertainty — often precedes volatility expansions.
Historical patterns show that VIX rises ahead of earnings dispersion and macro shocks, as investors scramble for protection against downside surprises.
Potential upside target: 25+ if earnings disappoint and SPX breaks below $6000
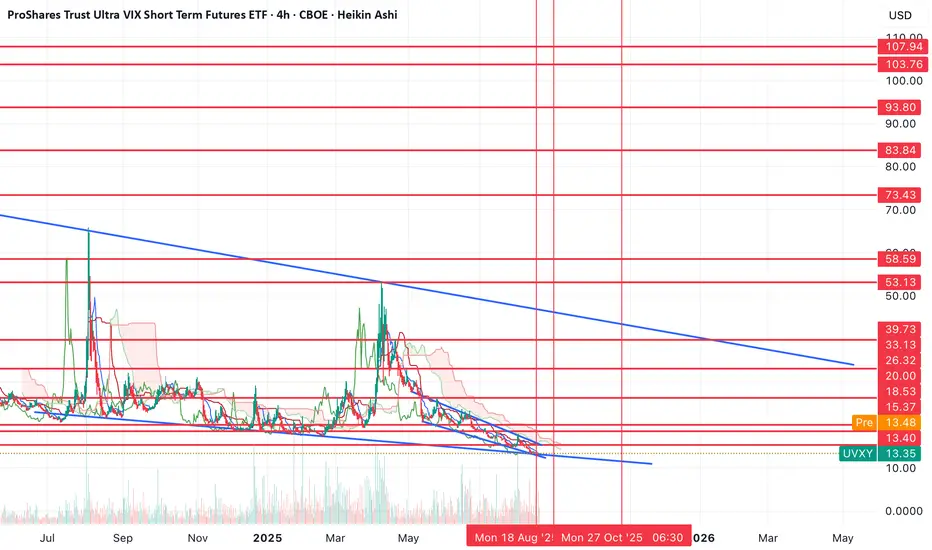
$UVXY has its first bullish close in months. More upside coming?In this blog space we look at the TVC:VIX and the ETF which mirrors TVC:VIX is $UVXY. This ETF has been below all the SMA. It was below 20-, 50-, 100- and 200-Day moving until 09 Oct 2025. On Friday CBOE:UVXY closed above the 20 Day SMA and almost touching 50-Day SMA on a daily chart. It could happen that the CBOE:UVXY prints more green candles and goes to the 200-Day SMA which is at 20. Once it above 20 or 200-Day SMA we could see more weakness in SP:SPX and $QQQ. But if it fails to break above 100-Day which is @ 15, then we might reverse our thesis and prepare for the Santa clause rally.
Verdict: Watch $UVXY. If it touches 20 then more downside for SP:SPX and $NAS100. If it fails below 100-Day SMA, then we will have Santa Claus rally.

A sharp surge in UVXY coming to $12-15? Then buy the dip?I think it's finally time to make some money from a vol trade. It won't be a massive move or anything, but it'll be enough to scare people.
If we look at the chart, you can see price has broken out of the falling wedge that formed after the April fall in the markets.
We're now consolidating under the trend line and I think once price breaks $10.82, we're going to see a massive surge higher because vol has been compressed for so long.
Now I do think this is the start of a larger move as vol will finally become unpinned, however, I think you'll want to buy the dip after this initial surge in vol.
I think it's likely that UVXY makes a move from $12-$14.80. I've marked off higher resistances incase it's a bigger move than I expect, but my base case is that we see a very fast move up to the box and then you'll want to get out of the vol trade and buy equities for the final move higher.
If this plays out, I think the next move in equities will be a blow off top that sends many mega caps surging 20-50% and some smaller caps over 100%.
Essentially, you won't want to stay short or long vol after this trade.
Let's see if this plays out. I think it is most likely to happen tomorrow, Thursday or early next week, but I've marked off key dates incase my timing is wrong.

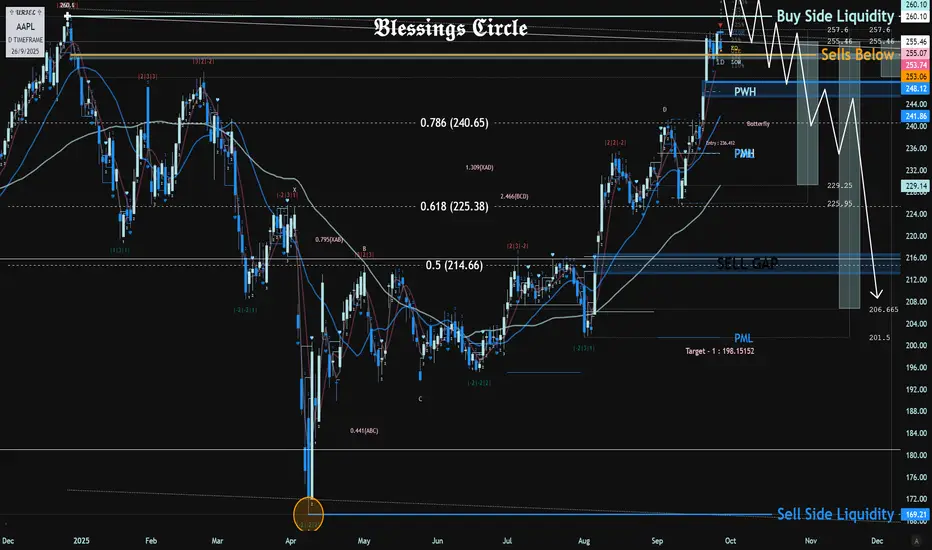
Hope The Apple Doesn't Rot The Fall of The Big Apple
Watching For AAPL to Potentially Trade into 260.10 This Week.
If 260.10 Does Trade I Will Be Looking To Short & Actively Scale into Sells Up Until 265.
If AAPL Were To Squeeze Above 265, The Sells Thesis Would Be Null.
First Sells Target Would Be Into The Sell Gap @ 248-245.
Second Sells Target Would Be The Second Sell Gap @ 216-212.
Third Sells Target Would Be The April Wick Low @ 169.21.
We Can Fall Potentially Fall As Low As 100 or Maybe Even Lower, but Majority If Not 100% of My Sells Positions Will Be Scaled Out Into The Above Sells Targets.
Good Luck To All Traders Going Into The Month Of October & Start of Q4.
With NFP on Friday to Finish off The Week Make Sure To DE Risk If Long.
Finally time for UVXY again?As you can see from the chart, we've been in a downtrend channel since mid-May.
Price seems to be bottoming here. If price can break out above the channel (around the $16), we can see the start of a larger move.
The first hurdle to break will be breaking above the $46 level. If UVXY can do that, then I think it potentially has a clear path to the higher resistances on the chart.
I've long thought we were going to get a move up to the $80-100 level.
The last spike didn't fully materialize, which makes me think that if we see the move break out above the levels from April and last August, that we might finally get the massive moves to the top of the range.
Let's see if it plays out.
$UVXY target still +$100, different path to get thereWe've seen an incredibly large rally in stocks, which has taken UVXY lower than I expected, but as long as we bounce at support here, the idea is still valid.
The support on the chart is retesting the move that we broke out from end of March. There was a lack of balance on the chart as we saw a 130% move over a 5 day period. So we're going back to retest that region.
I think once we retest the region we broke out from, we'll base for a few days and then start the last leg higher. I think this is going to be the biggest move yet and this move will get us to break the lows in SPY. I'm looking for $437-441 to mark the low in the market with an extreme low at $400.
I think VIX will see new highs and UVXY will go to $100+ with the resistance targets on the chart.
Not sure what the catalyst will end up being for this one, but all of the positive news around tariffs seem to be priced in after today.
Most of my UVXY options are stacked from 6/6-6/20 as I think we'll see this move play out by then.
Let's see what happens.

$VIX target $88-103TVC:VIX looks to be bottoming here and I think the next move higher is going to be the big one I've been waiting for.
We did well last month catching that move into April 7th via UVXY calls. I started buying calls again April 24th for 5/30 - 6/20 and have continued buying as VIX has declined.
Now the chart is finally looking like it's bottoming and I'm getting short signals on a lot of the charts -- therefore my conviction is growing that we're close to a reversal here.
I think this move will be a move that happens once every 10+ years and the gains have the potential to be massive if it happens.
Let's see if it plays out.

$UVXY to $100+Unfortunately many of my charts were removed by a moderator for having private indicators on them (which I didn't realize was a thing), so I have to repost them.
If we look at the chart, we broke out of a bull flag and are now testing a very strong support level.
You can see we've bounced off of that level multiple times. I think we bounce off of this level again and continue higher from here.
I have no clue what the cause for this move will be, but it looks like we're set for a large move up to the $98-106 resistances with possibility for an extended move up to the top resistances.
Let's see how it plays out over the coming weeks. Key dates and levels on the chart.

$VIX spike to $80-100 incomingI think there's a large spike coming in VIX despite most people turning bullish on the market and bearish on the VIX.
Price has maintained elevated levels for the past few months, all of the RSIs are in extreme bullish territory and the move looks very similar to the spike that we got on August 5th.
Have no clue what will cause it, whether it's the fed meeting, gov't shutdown or some other outside factor, but the chart is looking like we should see a spike next week up to the $80-103 level.
Let's see how it plays out.

VIX 10% UP ?In most cases in history, the VIX index doesn't leave GAPS behind & tends to close them.
Will it happen again this time? Potentially 10% up. UVIX (2X Long VIX Futures ETF)
Only an idea and not a recommendation for trading

$UVXY: the next move, to $50?I've been watching the CBOE:UVXY for months now trying to anticipate the next large move. Throughout September and October I was anticipating a larger move to play out, but we ended up just trading in a range. Luckily got a few profitable moves in the chop and got out at the high right before the election.
Then I thought there would be a larger drop. I entered in the low FWB:20S earlier this week and sold my spot position today on the move higher.
Now what I'm anticipating from here is a decline in vol early in the week and a rally in the market. On Tuesday or Wednesday, I'd be looking to go long volatility again as I think the NVDA reaction after market close Wednesday is going to cause some volatility in the markets.
Lots of reasons are lining up to believe the outcome of NVDA earnings will be bearish. I have a pivot on the chart on Wednesday. The NVDA chart has stalled at resistance and gapped lower.
Etc.
I think this will be the last large move in vol until early 2025 (Feb-March).So in other words, after this selloff the market rallies into Q1 2025.
In 2025, we will make volatility great again. I think we're going to see a resurgence of vol and we're going to see covid style numbers get printed in vol with 200-400% moves.
However, let's wait until this move plays out first before we focus on 2025.
I'm looking to enter calls early next week for 12/20 $30C.

Correction comingCheck out the VIX, just landed on the 20 level. I think is going to retest t he 30 level soon. Tomorrow Core PPI numbers are out. This could be the trigger. You can buy calls of VXX or UVXY if you want to play this one. I have my shorts well loaded. Don't need options.

Long $UVXY 6x- 20x gains ahead?Finally got the reversal I've been looking for in $UVXY.
My entry was at $23 and I think we have a large move ahead of us. If we look at the chart, we have our first green flat bottomed Heikin Ashi candle.
Normally with a move like today's people are exiting puts and shorting UVXY, but I think this move is just starting and vol is about to become unpinned.
Over the coming 1-2 months, I think we can see 6x-20x gains through UVXY.
I'm looking for price to test at a minimum the $168 level and reach a potential high of $457.
I'll start taking profits in the $168-242 range and see if we can get all the way up to the top of the range.
Playing this both through a large spot position and through options.
Let's see what happens in the coming months.

VIX to $17 Soon for another key trend line resistance test!Ensure you hedge your trades and know your maximum loss and profit, especially if you have limited funds to dollar cost average or are trading options.
For informational and educational purposes only, I prefer buying laddered call options on UVIX (1.5x), VXX (1x), and UVXY (2x) at sub-$13 levels over 2-4 weeks that align with my long "risk on" call expirations. This way, I can sell the pops and use the proceeds to add to my most committed "risk on" positions.
Good luck!
@candlestickninjatv

The formerly dead VIX has a chance of forming a golden cross50 DMA should easily cross the 200 DMA if Iran will retaliate and it looks like they are set to do so.
Can't stand politics, but we have to respect the pillars in order: Macro, Fundamental and finally Technicals,

UVXY crosses over mean anchored VWAP LONGUVXY which leverages the VIX as a measure of volatility / greed/ fear has finally crossed
over the mean anchored VWAP. This is a sign of bullish momentum and perhaps a signal that
traders should hedge or consider their positions in terms of hard risk management. Those
who traded this move up today made 10% or better in the trade. Those who bought call options
expiring tomorrow made 10X and those with call options for next Friday made 5X overnight.
Tomorrow is another day. Likely the market will rise from the correction and UXVY will fade
a bit. No matter, its value for insurance and hedging is reinforced on days like the past day.
I am maintaining a full position aside the call options closed at the afternoon bell which
expire on Friday and had time decay to contend with. My first target is 7.75 then comes
8.05 and 8.45. I will take off 20% at each target and keep the others for insurance for
a true market crash or black swan event to buffer losses while stops get hit.

UVXY - VIX Futures ETF- rises from a falling wedge breakout LONGUVXY on the 30- minute chart is now in an establish falling wedge breakout. Increasing
volumes lend support for bullish momentum as does the fear that rate cuts may be postponed
the the market's bullrun may stall and correct. This chart is left clean with only trend lines
drawn in recognizing that quite a few traders only have a basic subscription on Tradingview
without the luxury of multiple indicators, alerts and so on. A rise in the VIX may be a signal to
start trimming long positions or hedging with short trades.

UVXY the VIXX following ETF ShortUVXY the fear and volatility ETF ran up nearly 10% on the past trading day before
retracing a bit all due to the quick about-face in the market at about 1PM New York time.
It moved from the lows at the opening bell and let up with after hours profit taking.
The relative volatility indicator shows the volatility pump and then dump.
The dual signal RSI indicator shows the low time frame in blue dropping faster
than the higher time frame in black. I see this as a good setup for a short trade
that could yield half of the run-up over the next two trading days or 5% by
next Tuesday, August 1. The stop loss set at the top wicking at 17.25 while the target
the pivot low from which price began at 15.55. I have contemplated a put option
on this but have not yet reviewed the options chain. Price action down may begin
slow until price crosses under the POC line of the volume profile and then accelerate
as price drops below the high volume area into relative volume voids.
