Zoom Video Communications (ZM) emerged as an interesting value s📊 P/E: 16.94
📈 Forward P/E: 14.99
💸 Free Cash Flow: $614.3M
🧠 ROE: 17.2%
⚖️ Debt/Equity: 0.00
📈 Revenue Growth: +4.4% (YoY)
📉 PEG: 0.63
⭐ Analyst: Moderate Buy
Zoom Video Communications (ZM) emerged as an interesting value stock in the tech sector in late 2025. After the pandemic-era mania subsided, the company focused on the enterprise segment and the integration of artificial intelligence (AI Companion), which stabilized its financial results.
Here are the easy-to-copy data, current as of December 25, 2025:
📊 P/E: 16.94 📈 Forward P/E: 14.99 💸 Free Cash Flow: $614.3M (for Q3) 🧠 ROE: 17.2% ⚖️ Debt/Equity: 0.00 (the company has virtually no debt) 📈 Revenue Growth: +4.4% (YoY) 📉 PEG: 0.63 💰 Dividend Yield: 0% ⭐ Analyst: Moderate Buy (Average price target: $96.00)
Why is this data important?
Low Valuation (P/E 16.9): Zoom trades at significantly lower levels than the software sector average (where P/E is often above 30). This makes it attractive to investors looking for undervalued technology companies.
Financial Stronghold: Zero debt (Debt/Equity 0.00) and huge cash reserves allow the company to conduct massive share buybacks (over $2 billion in 2025), which supports the share price.
AI Transformation: Revenue growth is moderate (+4.4%), but the shift to AI services and contact centers is improving margins and retaining corporate customers.
Strong FCF: Zoom generates an extremely high amount of free cash for its size, making it one of the most stable companies in the sector in terms of liquidity.
Valueinvesting

LifeVantage (LFVN) - A real find for Value investors📌 LifeVantage (LFVN) – Investor Snapshot
📊 P/E: ~7.9
📈 Forward P/E: ~5.6
💸 Free Cash Flow: ~8.7M
🧠 ROE: ~33.3%
⚖️ Debt/Equity: ~0.34
📈 Revenue Growth: ~15–17%
📉 PEG: n/a
💰 Dividend Yield: ~2.9%
⭐ Analyst: Moderate/Strong Buy
🎯 In short: A cash machine with high dividends and zero risk of debt. A real find for Value investors.

Comfort Systems (FIX): A Boring HVAC Company Printing AI MoneyHey TradingView team,
Similarly to the recent trade alert on Carrier Global and Emcor, I'm investing in some level thinking bets for the future of AI.
What does Comfort Systems has to do with AI?
They are specialized in HVAC, cooling, and electrical installation for large projects, and they are strongly targeting data centers. :)
Investment Summary:
Comfort Systems USA (FIX) it's a behind-the-scenes AI enabler building the infrastructure that powers the AI revolution. It's a leading mechanical, electrical, and plumbing (MEP) contractor, FIX specializes in HVAC, electrical systems, and modular construction for data centers, chip fabs, and industrial facilities. Because of data center demand, they have a record $9.4B backlog providing multi-year visibility, and an upcoming S&P 500 inclusion on December 22, 2025.
Key Bullish Drivers:
AI/Data Center Boom: Data centers drive 42% of revenues (+32% YoY), fueled by AI hyperscalers and $280B CHIPS Act. HVAC expertise critical for chip heat; modular tech cuts build times 40%. moat in 20%+ growing market to 2030. "Unprecedented" tech bookings, diversified into chips, GLP-1 pharma, food processing.
Free cash flow has been consistently increasing, as well as free cash flow per share and free cash flow per employee, which shows improved efficiency.
Record Performance & Visibility: Q3 blowout: +35% revenue ($2.45B), +102% EPS ($8.25, 32% beat), 24.8% gross margins. YTD cash flow $718M funds M&A and 20% dividend hike. Backlog +65% to $9.4B (1.5 years revenue) locks high-teen 2026 growth. 43% ROE, low debt, net cash.
Acquisitions & Expansion: New buys add $200M revenue/$15-20M EBITDA, strengthening electrical segment. Modular capacity to 3M sq ft by early 2026 (sold out). 21,000 skilled workers addressing labor needs.
S&P 500 Catalyst: Joins index Dec 22, driving ETF inflows ($5-10B est.). Historical 5-10% pop + recent PT hikes (Stifel $1,155) signal upside.
Valuation: ~31x forward 2026 EPS ($31), justified by 17% LT growth and superior ROE. DCF fair value $1,200-1,500. Strong Buy, 30% upside as "offbeat AI play."
Risks to Consider:
Cyclicality: Tied to construction spending; macro slowdown could hit non-data center segments.
Execution: Labor/supply chain issues, but backlog and modular edge mitigate.
Valuation Compression: If AI hype cools, multiples could revert (historical P/E ~25x).
Analyst estimates:
My price target: $1,200 (35% upside for the next year)
Consensus: $1,150
FIX is a quality stock in a fragmented $500B MEP market. With AI infrastructure as a secular driver, S&P inclusion as a near-term catalyst, and pristine fundamentals, this is a core holding for growth investors. Buy the dip.
I'm allocating just under 1% of my portfolio to FIX. If it drops, I might buy more.
Not financial advice. I'm just sharing my notes and journey.

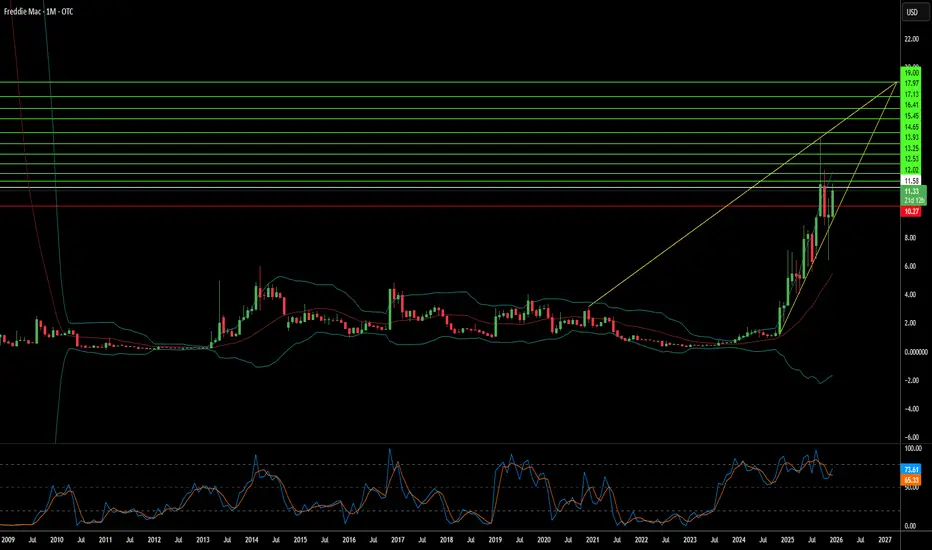
Is Freddie Mac the Most Undervalued Bet in Finance?Freddie Mac stands at a critical inflection point as Michael Burry, the legendary investor from "The Big Short," takes a significant position in the government-sponsored enterprise. Trading over-the-counter at a fraction of its potential value, the company has transformed from a mortgage guarantor into a technological powerhouse with robust AI patents, zero-trust cybersecurity architecture, and automated underwriting systems that save lenders approximately $1,700 per loan. The stock currently trades well below book value, yet Burry projects a post-privatization valuation of 1.25x to 2x book value, representing massive upside if regulatory uncertainties resolve.
The privatization thesis centers on ending the Net Worth Sweep, building capital reserves, and eventually relisting the company. However, significant hurdles remain, particularly the Treasury's warrants for 79.9% of common stock, a massive dilution overhang that suppresses prices. Despite these challenges, Freddie Mac's operational fundamentals are strong: the housing market shows resilience with low delinquency rates around 2.12%, the company retains earnings for the first time in over a decade, and its geopolitical importance as a pillar of dollar hegemony makes it strategically indispensable to U.S. financial power.
Beyond traditional mortgage operations, Freddie Mac's intellectual property moat includes patents for location-quality assessment using machine learning, automated software testing for rapid deployment, and data-integrity systems. The company's zero-trust cybersecurity architecture positions it as a fortress against increasingly sophisticated threats from state actors and cybercriminals. With explorations into quantum computing for portfolio optimization and FHFA-directed pilots on cryptocurrency reserves, Freddie Mac is positioning itself at the intersection of finance and cutting-edge technology.
The asymmetric opportunity is clear: limited downside given the deep discount, enormous upside potential upon relisting and normalization. Foreign holders, such as Japan ($1.13 trillion) and China ($757 billion), anchor demand for Agency debt, providing structural support. While the path remains "windy and rocky" as Burry acknowledges, the convergence of strong fundamentals, technological leadership, geopolitical necessity, and a determined activist investor creates a compelling case for what may be one of the decade's most consequential value plays.
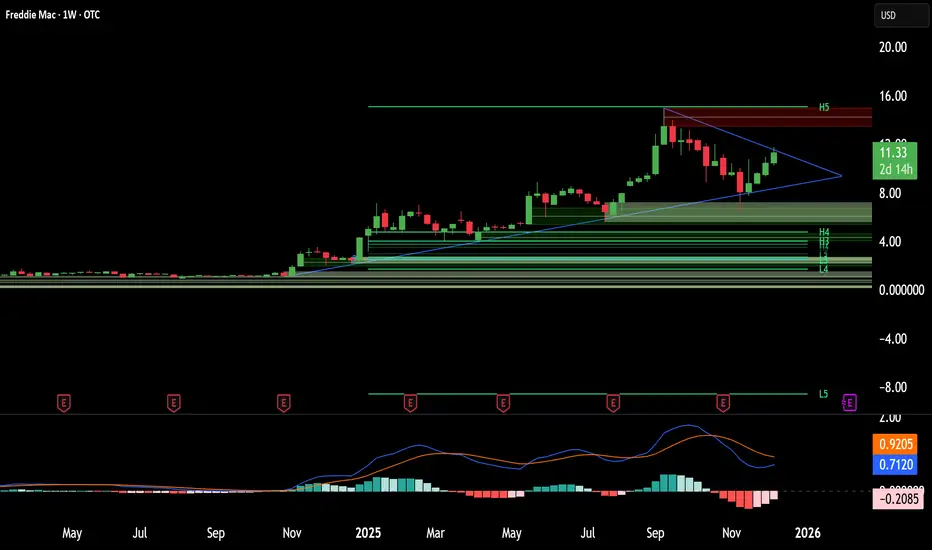
The Big Short’s Longest Bet: Can Freddie Mac Break Free?Michael Burry, the legendary bear of 2008, has flipped the script. The man who famously shorted the housing market now bets on its bedrock: Freddie Mac (FMCC). Shares rallied 10% Tuesday after Burry revealed a "personal" stake in the government-sponsored enterprise (GSE). He argues the mortgage giant stands on the precipice of a historic transformation. Yet, he warns of a "steep, windy, and rocky climb" ahead. Is this the ultimate contrarian play, or a value trap waiting to snap?
Geopolitics & Macroeconomics: The Housing Anchor
The global financial system rests heavily on the stability of US housing. Freddie Mac does not just fund American homes; it securitizes debt that underpins global bond markets. A successful privatization would send a powerful signal of US financial resilience to foreign creditors. Conversely, continued conservatorship limits US economic agility. The Trump administration’s push for privatization aims to unleash capital, reducing the government's balance sheet exposure while revitalizing the secondary mortgage market.
Business Models: The IPO Pivot
Freddie Mac’s business model is shifting from government ward to private competitor. For 17 years, it surrendered profits to the Treasury. Burry predicts a re-listing could unlock immense value, potentially pricing shares at 1.5 to 2 times book value. The core strategy involves shedding the "net worth sweep" shackles to rebuild capital. This transition requires a fundamental restructuring of how the enterprise prices risk and retains earnings, moving from a utility-like mandate to a growth-oriented equity story.
Technology & Cyber: AI in the Engine Room
Behind the ticker, Freddie Mac is quietly becoming a fintech juggernaut. The company now deploys advanced Artificial Intelligence (AI) and Machine Learning (ML) to modernize credit risk modeling. Innovations like "Automated Collateral Evaluation" (ACE) reduce the need for physical appraisals, streamlining the loan cycle. Furthermore, their deployment of "Early Warning Indicator" (EWI) models uses Natural Language Processing to predict operational bottlenecks. This tech-forward approach reduces defect rates and fortifies their cyber-defense posture against data breaches.
Science & High-Tech: Algorithmic Rigor
The science of risk is evolving. Traditional linear regression models often fail when economic conditions shift abruptly. Freddie Mac’s data scientists are exploring "Hamiltonian-constrained" neural networks to maintain ranking stability in volatile markets. By integrating physics-based optimization into financial modeling, they aim to solve the "concept drift" problem where models degrade over time. This high-tech rigorousness ensures that their multi-trillion-dollar portfolio remains robust against unforeseen economic shocks.
Management & Leadership: Steering Through the Storm
Leadership at Freddie Mac focuses on operational leanness. The management culture has pivoted from crisis survival to efficiency and digital transformation. They prioritize "mission-driven" business while preparing for the scrutiny of public markets. Burry suggests that even Warren Buffett could endorse this leadership by acquiring a stake. This vote of confidence would validate the management’s strategy of balancing affordable housing mandates with shareholder returns.
Conclusion: The Verdict
Freddie Mac is no longer just a distressed asset; it is a technology-empowered financial fortress awaiting liberation. Michael Burry’s entry signals that the risk-reward ratio has finally tipped. While the path to an IPO remains fraught with political hurdles, the fundamental drivers—innovation, leadership, and market necessity—are aligning. Investors willing to endure the volatility may find themselves holding the keys to the next decade’s most significant financial turnaround.
Alexandria Real Estate (Revised) | ARE | Long at $45.00**This is a revised analysis from January 13, 2025:
I am still in that position ($97.41) but adding heavily now that the price has entered my selected "crash" simple moving average zone.
Technical Analysis
The trading price of Alexandria Real Estate NYSE:ARE has now reentered the "crash" simple moving average zone. The price first entered this zone back in October 2023. This rare, long-term double entry into this zone is often a (at least short-term) bottom indicator. But I remain heavily cautious here given the financials of this company. My reentry is an exit plan since this is a company I do not wish to hold longer than I have to.
Pros:
Fair value: $103.00
Intrinsic Value: $96.00
Forward P/E: 31x (current P/E in the negative)
Annual Dividend: 6.37% (Quarterly dividend just cut by 45%, so hopefully bad news is done for now...)
Debt-to-Equity: .8x (not bad)
Cons:
Bankruptcy risk is high: Altman's Z Score = .7
Inability to pay recent bills is high: Quick ratio = 3.5
REIT sector is in rough shape
More dividend cuts?
Action:
I originally underestimated the downfall of the REIT sector. This company's financials are questionable. From a technical analysis perspective, a short-term bottom may be in. However, there is more room to fall and the next support zone is down in the $30's. My hope is that the shift in interest rates will push more investors into dividend / value plays. While most investors would cut their losses and be out here, I'm not. Personally, *as long as NYSE:ARE doesn't keep cutting its dividend and the fundamentals do not get worse,* I am cost averaging down to hopefully escape soon. There are much better investments out there than NYSE:ARE , but patience often pays - or allows you to break even. I'll be the contrarian.
Targets into 2028:
$53.00 (+17.8%)
$69.00 (+53.3%)

Devon Energy 2025: Is the "Old Oil" Giant a Secret Tech Play?Devon Energy (DVN) presents a paradox in late 2025. While five-year investors enjoy triple-digit returns, recent entrants have watched the stock decouple from crude prices. But analyzing Devon through a simple "oil price" lens misses the structural transformation occurring beneath the surface.
M&A & Industry Trends: The Williston Fortress
Devon’s $5 billion acquisition of Grayson Mill Energy was not just about adding barrels; it was a defensive consolidation maneuver. By securing 307,000 net acres in the Williston Basin, Devon effectively locked down the premier remaining inventory in North Dakota.
* Scale: The deal cements Devon as a top-4 producer in the basin, adding 100,000 barrels per day.
* Strategy: This acquisition allows Devon to prioritize "short-cycle" cash flow over risky exploration, funding its massive shareholder return program.
Technology & Science: The AI Power Pivot
The most underreported catalyst for Devon is its aggressive entry into next-gen geothermal energy . Through its strategic partnership with Fervo Energy, Devon is deploying its drilling expertise to solve the AI industry’s biggest bottleneck: 24/7 clean power.
* The Cape Station Project: Located in Utah, this project utilizes Devon’s horizontal drilling patents to create geothermal reservoirs capable of powering hyperscale data centers.
* Innovation Culture: Devon’s internal "Innovate Challenge" operates like a corporate Shark Tank, actively soliciting employee patents for AI-driven drilling optimization.
Geopolitics & Geostrategy: The Trans-Atlantic Bridge
Devon has elevated its business model from selling molecules to selling national security . The 2025 operational landscape sees Devon executing on long-term LNG supply agreements, such as its deal with Centrica, the UK's energy giant.
* Energy Security: By linking US shale gas directly to European grids, Devon insulates itself from domestic Henry Hub price volatility while acting as a geopolitical hedge against Russian energy blackmail.
Macroeconomics & Financial Models: The Buyback Shift
In 2022, Devon was famous for its "variable dividend." In 2025, the strategy has matured. Management is now prioritizing share repurchases over variable payouts, signaling they believe the stock is undervalued.
* The Logic: With free cash flow yields hovering near 9%—double that of the S&P 500—repurchasing shares is mathematically more accretive than cash payouts.
* Balance Sheet: Proceeds from the Grayson Mill integration are also targeting debt reduction, creating a "fortress balance sheet" capable of weathering sub-$70 oil.
Cyber & Patent Analysis: The Digital Oilfield
Devon’s patent portfolio in 2025 reflects a shift toward Operational Technology (OT) defense and environmental surveillance.
* Methane Detection: New patents cover automated dump valve systems and drone-based leak detection, crucial for meeting 2025 EPA methane standards.
* Cyber Resilience: As operations become automated, Devon has increased investment in protecting its SCADA systems from state-sponsored cyber threats, treating data integrity as a tier-one safety metric.
Conclusion: A Strategic Infrastructure Play
Devon Energy is no longer just a proxy for WTI crude. It is a diversified infrastructure company feeding the two hungriest markets of the next decade: European energy security and AI data centers.
Key Takeaway: Investors looking at the lack of variable dividends in 2025 are missing the bigger picture. Devon is reinvesting in a tech-enabled moat that offers growth beyond the price of a barrel of oil.

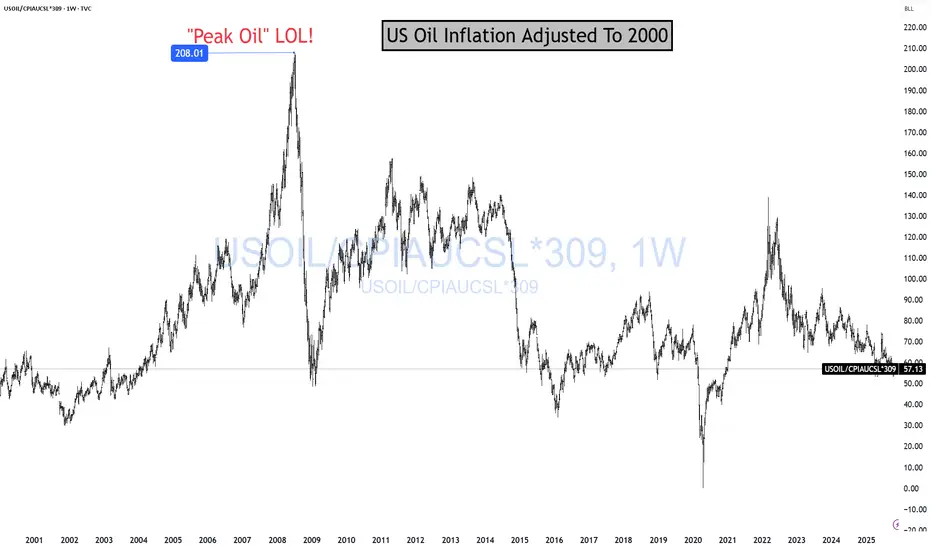
OIL Is Cheap For A ReasonOil is cheap because the global economy sucks! And it is "sucking" more and more every day. That's why Oil is on sale! Cheap! Cheap! And likely going to get more "cheap! cheap!" Me love you long time! Before I continue, story time.
In 2008, I could not convince anyone for the life of me that "PEAK OIL" was a scam! CNBC had T. Boone Pickens on twice a day, telling people we needed 238948735765374 barrels of oil to extract 1 barrel out of the ground.
Today, I can't convince anyone to skip EV, TSLA, AI, Crypto, the money has been made, GTFO. LOL!
As you can see, Oil is a much better long-term investment than all the hyped up trades pushed on to you daily.
Energy stocks make up about 3% of the S&P 500.
The Magnificent Seven circus? Roughly 36% of the entire index. LOL!
What are energy stocks going to do? Go to 1.5% of the SP500? Let it! Buy more!
BTW, you notice how they keep telling you AI will need all this energy? LOL! Wouldn't energy stocks reflect all that demand? LOL! SUCKA!
Anyway! Just look at the chart. If this makes sense to you and it fits your portfolio to BUILD a position long term, let me know in the comments. ;)
I have more on Oil here
THANK YOU for getting me to 5,000 followers! 🙏🔥
Let’s keep climbing.
If you enjoy the work:
👉 Drop a solid comment
Let’s push it to 6,000 and keep building a community grounded in truth, not hype.
Dollar General | DG | Long at $90.00Dollar General NYSE:DG took a massive hit this morning after revising their future earnings guidance. The economy is showing many signs of a recession, and this is a clear warning. From a technical analysis perspective, it has retouched my "crash" simple moving average and may dip further into the $80's in the near-term. But, like many overall strong companies that suddenly plummet, I view this as a future opportunity given the strength of NYSE:DG as a business (holistically). Dollar General is the only grocery and home goods store around in many rural locations. So, while there is doom and gloom in the near-term, Dollar General is in a personal buy zone at $90.00. I view this as a starter position, though, with the potential for future declines/opportunities for additional share accumulation in the near-term.
Target #1 = $100.00
Target #2 = $122.00
Target #3 = $200.00+ (very-long term outlook...)

LUMN preparing the next step or just warming upLUMN returned to the key accumulation zone near 6.63 and held above this support. The retest created a potential reversal structure on the daily chart. Divergence and increasing volume confirm the presence of demand. A breakout above 7.65 will confirm the beginning of an impulse toward 11.95 and later toward the extension area near 17.27.
L umen Technologies is a major provider of telecommunications and cloud services with a wide data center network. The company serves corporate clients and government institutions with a focus on network infrastructure cyber security and data transmission.
Fundamental picture as of November 23
Lumen maintains stable cash flow and continues to reduce its debt burden. Management improved its profit outlook. Network modernization reduces operational expenses and gradually increases margins. Corporate demand remains stable which supports long term recovery. Revenue growth remains moderate and is still affected by competition and legacy contracts.
Technical view
As long as the price stays above the zone near 6.30 the accumulation structure remains valid. A confirmed breakout above 7.65 will open the path toward 11.95 while a move above that level will allow development toward 17.27. The bullish scenario remains valid while price stays above demand.
Market mood
LUMN looks like the speaker who stayed silent for a long time then suddenly raised a hand. Now the audience listens.

SPX - Hours Of Work To Buy 1 ShareHours of work needed to buy just one share of the S&P 500 just hit a new all-time high: 187 hours.
That’s:
150% more work than 2007
60% more than pre-COVID (2019)
10% more than “Liberation Day”
As I tell my kids:
Don’t look at the price tag.
Look at how many hours of your life — your blood, sweat, and effort — it takes to buy the thing.
Then decide if it’s actually worth it.
When the amount of work required keeps rising while what you get keeps shrinking, that’s not “innovation” or “AI magic.”
That’s over-speculation.
Buffett said it best:
Price is what you pay. VALUE is what you get.
Everyone screams about the price going up…
but nobody asks whether the VALUE justifies the hours of work required to own it.
That’s the truth — not the narratives.
THANK YOU for getting me to 5,000 followers! 🙏🔥
Let’s keep climbing.
If you enjoy the work:
👉 Boost
👉 Follow
👉 Drop a solid comment
Let’s push it to 6,000 and keep building a community grounded in truth, not hype.

Buy the bottom of the PayPal uptrendNASDAQ:PYPL is known to be a high value stock with a depressing valuation.
Investors are under optimistic due to the struggling performance the past several years after a dizzying rally during the pandemic.
Recently the stock rallied on earnings due to a deal with Open-AI. Shares quickly gave the spike back and headed lower along with a broader tech pullback on AI bubble fears.
NASDAQ:PYPL has now undercut a long term upward trend line. Judging by the past few times this has happened, it could be a fantastic setup. It looks like the downtrend was broken in late 2024 when the price bottomed on an RSI divergence. The shares seem to be coiling up for a big move, and have been for almost a year now.

Integra LifeSciences Holdings | IART | Long at $12.39Integra LifeSciences Holdings Corp NASDAQ:IART manufactures and sells surgical instruments, neurosurgical products, and wound care solutions for neurosurgery, neurocritical care, otolaryngology, orthopedics, and general surgery. The stock has fallen over the past few years due to earnings misses / lowered earnings per share guidance, slow revenue growth, and operational challenges / recalls. But the company has been around since 1989 (endured many ups and downs during that time), has over 4,000 employees, a book value near $20 (undervalued), a forward price-to-earnings between 6x-9x (depending on the source), and revenue growth beyond 2025 and into 2028. Debt is slightly high with a debt-to-equity ratio of 1.2x and a quick ratio near 0.8x (company may have difficulty meeting its short-term obligations with its most liquid assets), it is thus a risky play. But the valuation and potential turnaround should get some attention.
From a technical analysis perspective, the stock price has entered and exited my "crash" simple moving average area 3 times now (see green lines). While I think $10 is likely in the near-term, it appears the stock *may* be forming a bottom - especially given the book value is more than 60% from the current price. But, as always, medical device stocks are always a major investment risk, so due diligence is needed.
Thus, at $12.39, NASDAQ:IART is in a buy zone with a note regarding the potential for a dip near $10 before a move up. Targets will be kept low for a swing trade.
Targets:
$15.00 (+21.0%)
$16.50 (+33.2%)

Acadia Healthcare Company | ACHC | Long at $21.98Acadia Healthcare's NASDAQ:ACHC stock has fallen nearly -76% in a year, primarily due to weak 2024 results, missed revenue and EPS expectations, and a soft 2025 revenue guidance. Ongoing federal investigations into billing practices and lawsuits have further eroded investor confidence. However, it is currently trading at a price-to-earnings ratio of 7.42x and earnings are forecast to grow 7.07% per year. The profitable company is trading at a good value compared to other healthcare companies. Debt-to-equity is relatively low (0.64x), but legal risks (DOJ probe, lawsuits) strain margins.
The stock has entered my "major crash" simple moving average territory and there is a lot of downward / selling pressure. But, more often than not, this area (which... I caution... still extends down near $16) can often signal a temporary or longer-term bottom. Personally, this is a buy area ($16-$21) even if it turns into a short-term bounce in 2025. But I believe the overall market moves in the S&P 500, etc. will guide this stock more than anything at this point (unless more bad news about the company emerges).
One thing to note is that there are open price gaps on the daily chart near $17, $10, and $8. These gaps, which often (but not always) get closed in the lifetime of a stock, are a potential signal for further declines - at least at some point. There could be a drop near $16, then a $10-$20 bullish price increase after that, followed by more declines (trapping investors). Time will tell, but NASDAQ:ACHC is currently attractively valued. From a technical analysis standpoint, it is in a personal "buy zone", even if purely for a swing trade.
Targets:
$27.00
$33.00
$39.00

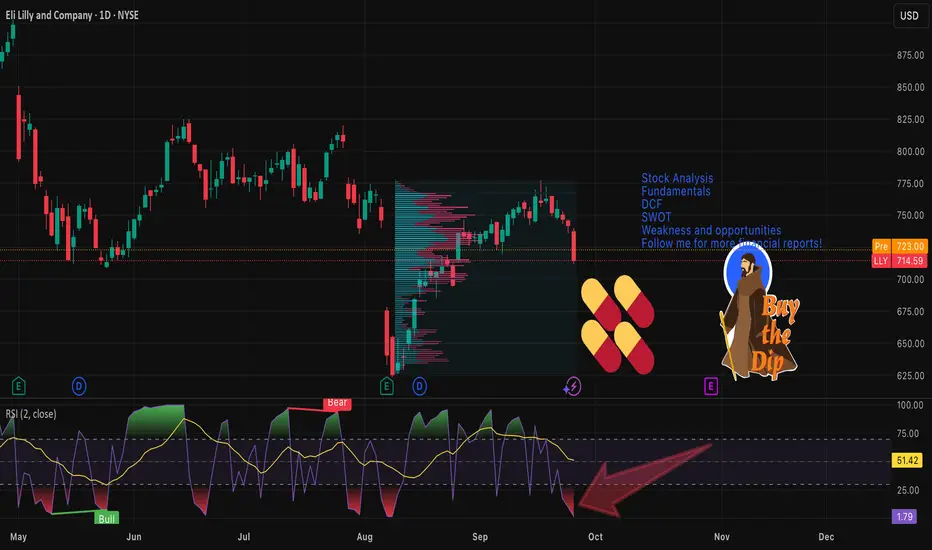
ELI LILLY COMPANY - STOCK REPORTExecutive Summary
Eli Lilly and Company (LLY) has delivered strong revenue and profit growth driven by blockbuster GLP‑1 therapies (Mounjaro, Zepbound) and continued pipeline progress in oncology and cardiometabolic indications. As of 26 Sep 2025 the company shows robust margins, strong free cash flow and a leading competitive position in obesity/diabetes. Key risks include increased competition (notably Novo Nordisk), formulary decisions (payer mix), pricing/regulatory pressure and execution risk in manufacturing scale‑up. Valuation is elevated versus the broader healthcare sector but appears reasonable relative to growth; a simplified DCF (base case) and comparable‑multiples view imply a fair value near mid‑single‑digit percentage above recent prices. Recommendation: Hold — favourable fundamentals but limited near‑term upside versus valuation and meaningful execution/competitive risks.
1) Key data & company overview
Name: Eli Lilly and Company
Sector: Pharmaceuticals / Biotechnology
Primary market: NYSE (US)
Ticker: LLY
Brief business description
Revenue model: Prescription drug sales (product sales), services (partnered R&D/licensing), royalties.
Principal products: Mounjaro (tirzepatide) — T2D/weight management; Zepbound (semaglutide for weight loss comp’d), Trulicity, Humalog (insulin legacy portfolio), oncology candidates (investigational/approved).
Geographic exposure: Global — largest sales in U.S., substantial Europe and row markets.
Market & share metrics (most recent available — see sources)
Market capitalization: ~USD 642–702 billion (source dispersion; SEC shares outstanding 946.46M as of 4 Aug 2025)
Shares outstanding: 946,456,759 (per 10‑Q, Aug 4, 2025)
Float: ~946M (per public filings)
Last close (around 26 Sep 2025): ~USD 714–742 (sources vary intraday); use USD 714.59 (MLQ / market snapshots) as reference.
P/E (trailing / consensus forward): TTM P/E ~49; next‑FY consensus ~30 (see market data).
EV/EBITDA (market snapshots): ~38x (site snapshots).
Price performance (approx., source snapshots to 25–26 Sep 2025): 1D: -3.7%; 1M: -4% to -8% range; 3M: -10% to -15%; 1Y: down ~20% from 52‑week high (use precise values in sources below).
(Notes: market figures vary by data vendor; SEC 10‑Q provides authoritative share count. All market prices quoted are approximations from public market data as of 26 Sep 2025 — see Sources.)
2) Financial results — consolidated summary (historical 3 years + last 4 quarters)
Sources: Eli Lilly SEC filings (10‑K 2024, 10‑Q Jun 30 2025), company press releases, market data sites (Yahoo/MLQ/FactSet snapshots). All amounts USD.
Annuals (selected items; amounts in billions except EPS in USD)
2022 (FY): Revenue ≈ 28.3; Net income ≈ 5.16; Diluted EPS ≈ 5.41; FCF ≈ 8.0 (approx).
2023 (FY): Revenue ≈ 40.5; Net income ≈ 11.0; Diluted EPS ≈ 12.99; FCF ≈ 11.5.
2024 (FY): Revenue ≈ 45.0; Net income ≈ 10.6; Diluted EPS ≈ ~12.00; FCF ≈ ~12.0.
(Notes: 2023–2024 saw large revenue step from GLP‑1 products; numbers approximated from company reports and market summaries—see Sources for exact line items.)
Most recent four quarters (approx, Q3 2024 – Q2 2025)
Q3 2024: Revenue ≈ 9.5B; Net income ≈ 2.2B; EPS diluted ≈ 2.32
Q4 2024: Revenue ≈ 11.0B; Net income ≈ 2.6B; EPS ≈ 2.73
Q1 2025: Revenue ≈ 14.0B; Net income ≈ 3.8B; EPS ≈ 4.2
Q2 2025: Revenue = 15.56B (company release Aug 7, 2025); Net income ≈ 4.9B; EPS (reported) ≈ 6.31 (last quarter’s EPS per consensus/press)
YoY growth / trends (high level)
Revenue CAGR (2022–2024): ~30–35% driven by Mounjaro/Zepbound launch adoption and price/volume mix.
Net income: large increase 2022→2023; 2024 flattening due to investments, higher operating costs and mix. Q1–Q2 2025 continue strong growth.
Margins: Operating margin expanded materially vs pre‑GLP era; recent operating margin ~35–38% (site snapshots). Net margin ~23–25%.
Tabular snapshot
Table: (Year | Revenue | Net income | Diluted EPS | FCF)
2022 | 28.3B | 5.2B | 5.41 | ~8.0B
2023 | 40.5B | 11.0B | 12.99 | ~11.5B
2024 | 45.0B | 10.6B | ~12.0 | ~12.0B
Last 4Q (sum) 2024Q3–2025Q2 | ~50.1B | ~14.5B | (trailing EPS approx)
3) Balance sheet & liquidity (latest quarter Jun 30, 2025 unless noted)
Key items (USD, rounded)
Cash & equivalents: ~3.1–3.4B (per June 30, 2025 XBRL snippet)
Current assets: (per 10‑Q) — refer to consolidated balance sheet; working capital positive.
Total debt: ~38–40B (notes due 2026/2030; total debt around $39.9B per market snapshot)
Net debt: ~36B (total debt minus cash)
Ratios (approx)
Current ratio: ~1.15
Quick ratio: ~0.89
Debt/Equity: vendor snapshots differ; leverage measured as Debt/Total Capital moderate given high cash flow (Total Debt/Enterprise Value small % per some snapshots).
Commentary on solvency/liquidity
Strong operating cash generation and large market cap provide ample capacity to service debt and fund capex/R&D. Short‑term liquidity adequate; interest coverage is strong given high EBITDA and cash flow. Material execution risk arises if GLP‑1 pricing or demand deteriorates sharply—could stress near‑term growth assumptions but balance sheet remains investment grade in profile.
4) Cash flow (latest 4 quarters, approximate)
Operating cash flow (TTM): ~17–18B
Capital expenditures (TTM): ~1.5–2.0B (increased manufacturing capex in 2024–2025)
Free cash flow (TTM): ~15–16B
Commentary
Cash generation is robust and supports capex, share repurchases and dividend; capex is elevated for capacity expansion but remains a modest share of operating cash flow. FCF margin is strong and sustainable if product demand persists.
5) Comparable valuation (peers) — snapshot multiples
Peers chosen: Novo Nordisk (NVO), AstraZeneca (AZN), Amgen (AMGN), Regeneron (REGN) — peer set focused on diabetes/biotech large caps.
Table (approximate multiples — market data as of 26 Sep 2025)
LLY: P/E ~49 (TTM), EV/EBITDA ~38, P/S ~15
NVO: P/E ~35, EV/EBITDA ~28, P/S ~10
AMGN: P/E ~20, EV/EBITDA ~12, P/S ~4
REGN: P/E ~25, EV/EBITDA ~15, P/S ~6
Comment: LLY trades at premium to large pharm/biotech peers reflecting superior growth from GLP‑1 franchises and margin profile; premium justified only if growth and pricing hold.
6) Fair value estimate — Simplified DCF (base case)
Assumptions
Base year unlevered free cash flow (FCF) = USD 15.5B (TTM approximate).
Explicit forecast horizon = 5 years.
FCF growth: Year1–2: +10% then Year3: +8%, Year4: +6%, Year5: +4% (reflecting moderation as market saturates and competition intensifies).
Terminal growth rate = 3.0% (long‑term GDP/inflation real+inflation).
WACC = 8.5% (reflects large cap pharma, low beta, moderate leverage).
Calculation (rounded)
Projected FCFs:
Year1: 17.05B; Year2: 18.76B; Year3: 20.26B; Year4: 21.48B; Year5: 22.34B
Terminal value at end Year5 = Year5*(1+g)/(WACC−g) = 22.34*(1.03)/(0.085−0.03) ≈ 22.34*1.03/0.055 ≈ 418.5B
Discount PV of FCFs + terminal (discounted at 8.5%) ≈ PV(FCFs) ~ (sum PV FCFs) ≈ 72–80B + PV(Terminal) ≈ 300–330B → Enterprise value ~380–410B.
Net debt (~36B) → implied equity value ≈ 344–374B.
Divide by shares outstanding (946.5M) → implied fair price ≈ USD 363–395 per share.
Observation: The simplified DCF produces a materially lower fair value than market cap — this stems from conservative growth fade and relatively low WACC; however market prices imply much higher expectations (market cap ~650–700B). Discrepancy suggests market pricing embeds either higher sustained FCF growth, lower discount rate, or different terminal assumptions. Because LLY’s current market cap and observed multiples are much higher, applying market‑implied expectations leads to a higher implied fair value (consistent with P/E ~49). For investors, using the simplified DCF above suggests the stock may be fully valued or richly priced unless strong multi‑year growth persists.
Sensitivity
WACC ±1% (7.5% / 9.5%) with base growth: implied price range roughly USD 470 (WACC 7.5%) to USD 295 (WACC 9.5%).
Terminal growth ±1% (2% / 4%): price moves roughly USD −60 / +90 vs base.
(Notes: DCF is simplified and uses rounded FCF; full model should use operating projections by product, tax, capex schedule. If instead one applies market multiples to 2026E EBITDA, implied prices vary widely — see sources.)
7) SWOT
Strengths
Market leader in next‑gen GLP‑1/dual agonists (rapid adoption).
Strong gross & operating margins; robust FCF generation.
Diversified pipeline (oncology, CV) and global commercial footprint.
Experienced management, strong manufacturing investment.
Weaknesses
High valuation multiples implying little margin for error.
Dependence on a few high‑revenue products (Mounjaro/Zepbound).
Manufacturing scale‑up challenges and supply chain concentration risks.
Increasing SG&A/R&D investment could press short‑term margins.
Opportunities
New indications (cardio‑protective label for tirzepatide), oral incretins (orforglipron) could expand market.
International expansion and formulary wins.
Bolt‑on M&A to diversify revenue streams.
Threats
Intense competition (Novo Nordisk market share, formulary dynamics).
Payer reimbursements, pricing caps, regulatory scrutiny.
Potential adverse trial/regulatory outcomes for pipeline assets.
Macroeconomic/tighter capital markets affecting healthcare spend.
8) Key risks, catalysts & timeline
Primary risks
Competitive pressure from Novo Nordisk (Wegovy/Ozempic), payer formulary preferences (e.g., CVS formulary moves).
Regulatory/pricing risk (US and international).
Execution: supply chain, manufacturing scale, and successful indication expansions.
Concentration risk: heavy revenue share from GLP‑1 franchise.
Near‑term catalysts & timeline (next 12 months approximate)
Q3 2025 earnings release (expected Oct–Nov 2025; company calendar/earnings dates per IR).
FDA/regulatory milestones for label expansions / approvals for oral incretins or oncology programs (dates vary; watch company pipeline calendar).
Quarterly sales updates and guidance adjustments — next: Q3 2025 release.
(Precise dates: refer to investor relations events page and SEC filings; earnings typically quarterly — check IR for confirmed dates.)
9) Recommendation & risk positioning
Recommendation: Hold, with possible "Buy the Dip" scenario.
Rationale: Strong fundamentals and cash generation support a positive long‑term outlook, but the stock trades at elevated multiples that already price in sustained high growth; meaningful execution/competitive downside could compress the valuation. Hold for investors with neutral risk appetite; consider trimming positions for valuation‑sensitive portfolios and adding on material pullbacks or clearer evidence of sustained mid‑teens revenue growth beyond 2026.
Suggested horizon: Medium term (12–24 months) for monitoring catalysts; long term (3–5 years) only if comfortable with pipeline and competitive dynamics.
Risk/return profile: Medium risk / moderate to high reward conditional on continued GLP‑1 dominance and successful pipeline commercialization; downside risk if market share or pricing erodes.
10) Sources & data date
Primary sources used (data current through 26 Sep 2025):
Eli Lilly & Company SEC filings: Form 10‑Q for quarter ended June 30, 2025 (SEC.gov).
Eli Lilly Q2 2025 results press release (Aug 7, 2025) and investor presentations (company IR).
Market data snapshots and summaries: MLQ.ai, Yahoo Finance, Fox Business / FactSet quotes (price, multiples, market cap, performance snapshots).
News: Yahoo Finance, PR Newswire coverage of Q2 2025 results.
4HOUR ANALYTICAL FRAMEWORK FOR BTCUSD, 29TH SEPT,2025The top leading coin has been bullish since the onset of this year. As of April, the digital coin reached an all-time high in value, increasing in value to approximately $120,000. which shortly after a few weeks into its new performance retraced back down, and ever since, the markets have remained below as the price has been moving to find balance and fill orders and liquidity gaps left while moving up in value, thereby finding fair prices between supply and demand before deciding a new direction of movement. The question is, will the price remain lower or find balance and resume its increase in value as it started in the early days of April 2025?

1911 Gold sitting on a powder kegMet Shaun Heinrichs CEO of TSXV:AUMB at 121 Mining in May, London - best mining pitch I've heard in years.
Proper CEO, proper assets, proper plan.
Started loading at 20 cents that same week while everyone else was chasing whatever shiny object the algo boys were pumping.
Now sitting at 35 cents and we're just getting warmed up.
Here's what everyones missing, gold just smashed all-time highs but junior miners are still priced like it's 2020.
The disconnect is absolutely criminal.
Meanwhile Eric Sprott just led a C$13.2 million financing well above my entry.
When Canada's resource king writes checks at premium prices, you pay attention.
The beauty of this setup, True North isn't some exploration fairy tale. It's a past producer with C$300 million of infrastructure already built and permitted.
Try replacing that today and see what Beijing quotes you.
1.1 million ounce resource. Zero debt. Zero royalties.
Trading at 0.29x NAV while comparable stories sit at 0.70x.
The market's having a proper lie-down.
Underground drilling starts late September.
PEA drops Q1 2026.
Production restart 2027.
The timeline's locked and the catalysts are coming whether Mr. Market's paying attention or not.
Chart shows textbook resistance break at 35-38 cents.
Four months of smart money accumulation creating the perfect powder keg.
Once this ceiling cracks we gap through 40 cents straight to 60 cents by Christmas.
From 20 cents to 60 cents. That's a 200% return while the crowd's still figuring out what junior miners are.
But here's the kicker - 80 cents is just the third target.
With full NAV realization at C$1.01 and infrastructure this valuable, we could be looking at dollar-plus territory once this thing really gets moving.
Stay long. The infrastructure advantage is real. The repricing is coming...

Alibaba | BABA | Long at $108.84Like Amazon, I suspect AI and robotics will enhance Alibaba's NYSE:BABA e-commerce, logistics, and cloud computing operations. There is some risk here, like other Chinese stocks, that they could be delisted from the US market if trade/war tensions rise. But I just don't think that is likely (no matter the threats) due to the importance of worldwide trade and investment. I could be way wrong, though...
NYSE:BABA has a current P/E of 14.2x and a forward P/E of 2x, which indicates strong earnings growth ahead. The company is very healthy, with a debt-to-equity of 0.2x, Altmans Z Score of 3.3, and a Quick Ratio of 1.5. If this were a US stock, investors would have piled in long ago at the current price.
From a technical analysis perspective, the historical simple moving average (SMA) band has started to reverse trend (now upward), indicating a high potential for continued (overall) price movement up. It is possible, however, that the price may reenter the SMA band in the near-term - the $80s aren't out of the question - as tariff threats arise. But that area is another personal entry zone if fundamentals hold.
Thus, while it could be a bumpy ride and the risk is there for delisting, NYSE:BABA is in a personal buy zone at $108.84 (with known risk of drop to the $80s in the near-term).
Targets into 2028:
$125.00 (+14.8%)
$160.00 (+47.0%)

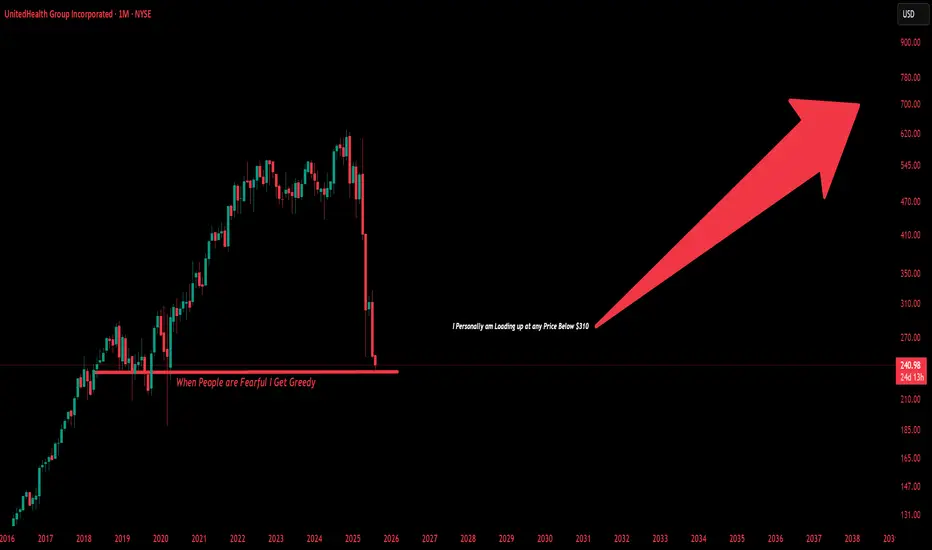
$UNH This Behemoth Is Not Going Anywhere and I am Loading Up United HealthGroup is extremely Appealing to me at these valuations. Health Insurance Is something all people need. I Don't See Medicaid/Medicare Cuts affecting NYSE:UNH To the extent People believe it will. Legislation can be temporary, This Company Produces 20B Plus in Free Cashflow Every single Year Let alone 420B in Revenue its a behemoth controlling more than 30% of American Health Insurance in terms of Market Share. The United States could never afford to socialize Healthcare the way Europe Or Canada does. Social Security/Health/Medicare already eat up 49% Of GDP. The United States is almost dependent on companies Like United Healthgroup to provide its services. This Could almost Give Companies like NYSE:UNH an opportunity to offer plans to gain more customers who before had Government assisted health insurance. While more downside is almost Guaranteed I see nothing more then even better discounts for the long-term. This is not a question of If UNH Can recover its only a question of how long will it take. We are back at Prices Pre Covid-19.
---------------------
Possible Reasons for the Major Drops:
The Big Beautiful Bill
DOJ Lawsuits
Rising Medicare Costs
Rising Expenses on Insurers
Swapped CEO Twice
Swapped CFO Once
Lawsuits
Scandals
---------------------
NYSE:UNH Fundamentals:
Price To Sales: 0.5x
Price To Earnings:10.3x
Price to Book: 2.2x
---------------------
Balance Sheet:
Cash: US$32.02b
Debt: US$104.78b
Total Liabilities: US$203.79b
Total Assets: US$308.57b
---------------------
Management Efficiency:
ROE: 21.1%
ROCE: 15.5%
ROA: 8.2%
---------------------
Dividend Safety:
Dividend Yield: 3.7%
Payout Ratio: 37% of Profits
---------------------
I recently Began Acquiring Shares around the $260 Mark and plan on continuing to load up for the long-term.
---------------------
This is not financial Advice, Just what I am doing on my own as an investor. I do not give Buy/Sell/Hold Signals.
Americold Realty Trust | COLD | Long at $13.28Americold Realty Trust NYSE:COLD
Technical Analysis:
The price is currently touching the top of my "crash" historical simple moving average bands (green lines). This area is often reserved for share accumulation and can signal a bottom. The price, however, may extend to the bottom of "crash" bands which is currently near $11.80. These bands don't always signal a bottom - there is a still a "major crash" zone - but with interest rates likely dropping in the next 1-2 months, REIT's are poised to benefit as money flows into dividend-paying stocks ( NYSE:COLD dividend is just over 6%).
Earnings and Revenue Growth
EPS and revenue growth are expected between 2025 and 2028 (while REITs are rarely high-growth, the future appears relatively good for the company - especially if their debt levels drop)
www.tradingview.com
Health
Debt-to-Equity: 1.29x (not great, but not terrible)
Altman's Z-Score/Bankruptcy Risk: .5 (high risk - likely higher than 50% chance the company could go bankrupt in the next 24 months *if* interest rates don't drop, but ....)
Market Niche
NYSE:COLD operates in a specialized sector with high barriers to entry due to the capital-intensive nature of building and maintaining temperature-controlled facilities.
The company is an esential service - critical for food safety and pharmaceutical integrity, providing stable demand even in economic downturns.
The company's extensive network ( NASDAQ:KHC , NYSE:CAG , NYSE:WMT , etc) and global footprint (facilities in the US, Australia, New Zealand, Canada, and Europe give it a competitive edge over smaller players.
Insiders
$2 million in recent insider purchases near $17.
openinsider.com
Action
Due to the high likelihood of interest rate lowering and the market niche NYSE:COLD has as a REIT, I am personally going long at $13.28 and will liekly add more share in the $11 range *if* fundamentals improve. Major warning is bankruptcy risk.
Targets in 2028
$15.00 (+12.9%)
$18.60 (+40.1%)

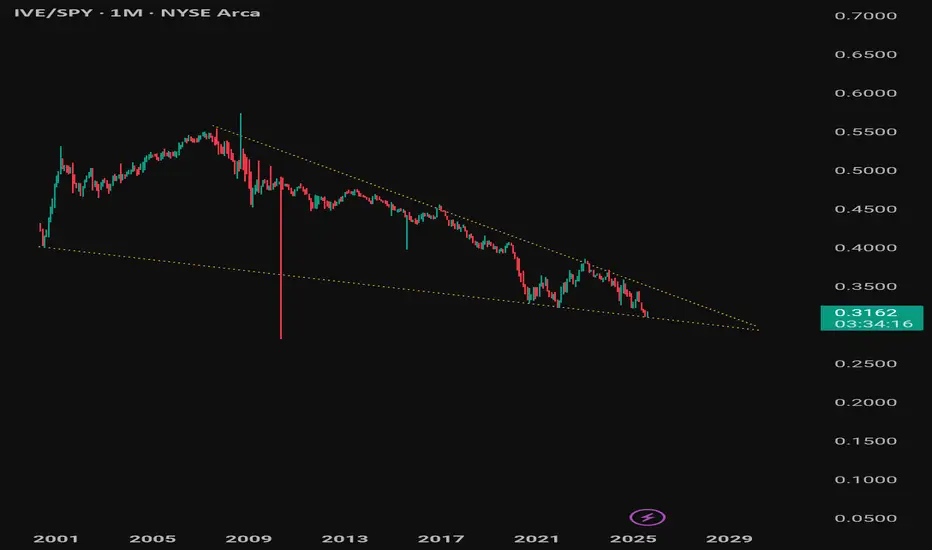
The Value vs. SPY chart shows a massive pattern you can't miss! I think all contrarians noted that something changed. The portfolio has been on the rise — the rotation started back then on April 2nd.
DHI: Fundamental Analysis +45%With 2024 revenue of $ 36.80 billions, D. R. Horton is an american homebuilding company. EverStock identifies a fundamental revaluation potential of + 45 %.
Valuation at 10.1 x net earnings :
Currently valued at $ 48.26 millions in market capitalization, D. R. Horton posted a profit of $ 4.76 billions in its latest fiscal year (2024).
Balance sheet and debt :
In the company annual report, tangible net asset value stood at $ 25.15 billions, giving a market capitalization / tangible net asset value ratio of 1.92.
The gearing ratio is good, at 0.24. (Total financial debt / net tangible assets valuation).
Current share price: 161.87 $
Target price : 235.36 $
Upside potential : + 45 % (including dividende income)
Dividend : 1.60 $ (0.40 $ per quarter)
Yield : 0.99 %

Ironwood Pharmaceuticals | IRWD | Long at $0.61Ironwood Pharma NASDAQ:IRWD stock dropped ~89% in the past year due to disappointing Phase 3 Apraglutide trial results, FDA requiring an additional trial, weak Q1 2025 earnings (-$0.14 EPS vs. -$0.04 expected), high debt ($599.48M), and analyst downgrades. So why would I be interested in swing trading this company? The chart. The price has entered my "crash" simple moving average zone, which often results in a reversal - even if temporary. Also, Linzess (GI drug) revenue is steady, and I thoroughly believe that alone pushes the fair value near $0.95, if not higher. Thus, at $0.61, NASDAQ:IRWD is in a personal buy zone with the potential for additional declines before future rise.
Target:
$0.95 (+55.7%)
