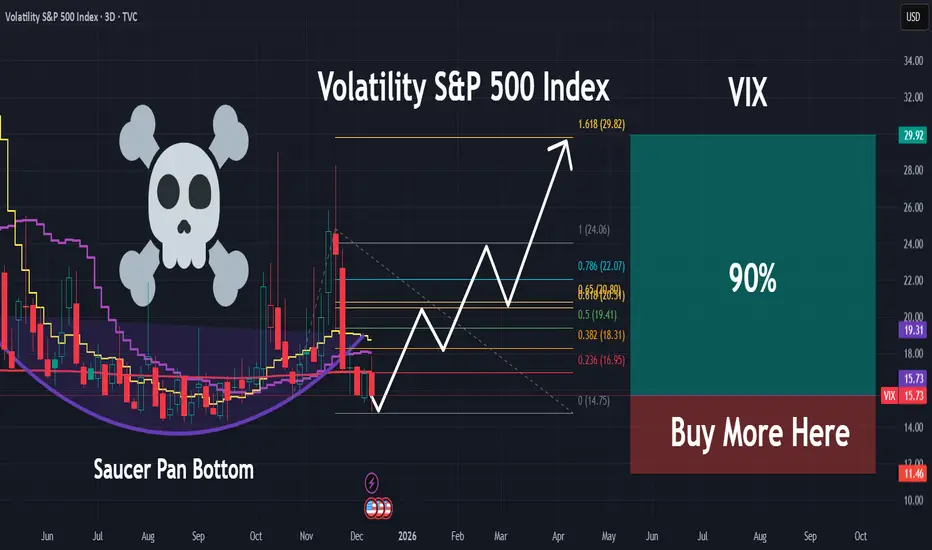
VIX short-term TASince the beginning of February the VIX has started an uptrend again, you should be cautious of market volatility in the upcoming days.
VIX CBOE Volatility Index

US Job Openings (JOLTS) vs S&P 500: 2026 Divergence PersistsUS Job Openings (JOLTS) vs S&P 500: 2026 Divergence Persists: AI Boom or Recession Warning? 📉🤖
Description:
The historical correlation between US job openings (from JOLTS data) and the S&P 500 has broken down dramatically since late 2022, and as of early 2026, the gap is widening. This chart overlay highlights a key macro divergence that traders should monitor closely for potential market shifts. 📊
Chart Setup on TradingView:
1. Start with the S&P 500 index: Search for "SPX" or "SP:SPX" as your main symbol. 🔍
2. Add a comparison: Go to "Compare" in the chart menu, search for "FRED:JTSJOL" (Job Openings: Total Nonfarm, sourced from Federal Reserve Economic Data). ➕
3. Normalize for better visualization: Use percentage change from a baseline (e.g., November 2022) or index both to 100 at a common point. ⚖️
4. Timeframe: Monthly or weekly for longterm view; add a vertical line at November 30, 2022 (ChatGPT release date) to mark the divergence start. 📅
5. Optional indicators: Add RSI on SPX for overbought signals, or correlate with unemployment rate (FRED:UNRATE) for additional context. 📈
Key Data Points (as of February 3, 2026):
| Metric | Value | Change from Peak/Recent |
| Latest Job Openings (Nov 2025) | 7.146 million | 41% drop from peak of 12.134 million (Mar 2022) |
| S&P 500 Close (Feb 3, 2026) | 6,907.41 | +44% from Nov 2022 levels (~4,800), hitting new highs |
| Job Openings Rate | 4.3% | Down from 7.3% peak in 2022 |
| Historical Correlation (pre2023) | ~0.85 (strong positive) | Now near 0, indicating decoupling |
Analysis & Context:
Historical Trend: Job openings have traditionally mirrored stock market performance, as a tight labor market signals economic strength, boosting corporate earnings and investor confidence. From 20002022, the two moved in tandem through booms and busts (e.g., post2008 recovery). 📜
The Divergence : Starting around late 2022, coinciding with the public release of ChatGPT and the AI hype cycle, job openings began trending downward while the S&P 500 surged. Openings have fallen steadily (e.g., 303,000 drop in Nov 2025 alone), driven by sectors like accommodation/food services (148,000 drop) and transportation (108,000 drop), offset partially by gains in construction (+90,000). 🔻
Potential Causes:
AI Productivity Gains: Companies are leveraging AI tools to automate tasks, reducing the need for new hires while maintaining output. This "productivity paradox" allows earnings growth without labor expansion. 🤖💼
Economic Softening : Quits rate steady at ~2.0% and layoffs at 1.7 million suggest a cooling but not collapsing job market. However, if this persists, it could foreshadow weaker consumer spending. ❄️
Fed Policy & Inflation : With rates stabilizing, markets are pricing in growth, but labor data lags, creating a mismatch. 💰
Implications for the Economy : Bullish view: This is a "soft landing" where AI drives efficiency, supporting higher valuations. Bearish view: Divergences like this have preceded recessions (e.g., 2000 dotcom bust). If openings drop below 7 million, it might signal broader weakness, pressuring megacap tech stocks that have driven SPX gains. ⚠️
Actionable Insights for Traders:
ShortTerm : Watch tomorrow's JOLTS release (Feb 4, 2026) for December 2025 data: consensus expects ~7.23 million. A miss below 7.1M could trigger SPX pullback; consider shorting via SPY puts if it breaks 6,850 support. ⏰
MediumTerm Strategy : If divergence widens (openings <6.5M by mid2026), rotate from growth stocks to defensives (e.g., utilities, consumer staples). Target SPX upside resistance at 7,000; downside support at 6,800 (50day MA). 🔄
Risk Management : Use this as a macro overlay: pair with VIX for volatility spikes. Set alerts on TradingView for JOLTS updates via FRED integration. 🛡️
Trade Idea : Long SPX if openings stabilize above 7M (bullish confirmation); hedge with VIX calls if below. Position size: 12% risk per trade. 💡
What do you think: bullish on AI or bearish on labor? Share your views below! 🗣️
#SPX #JOLTS #Economy #AI #Trading

Are we about to see a massive vix spike? $100?I'm not sure what the cause will be here, but it looks like we're on the verge of a massive vix spike. I can imagine that the selloff will look like a combination between the 1987 1 day crash and the covid selloff.
I think we're about to see a 20%+ correction that happens very quickly which I think will lead to a massive spike in the Vix. Potentially the largest spike thus far.
In order for this move to play out, we'll need a close over 20, then the 28 level on the chart, and then I think it's possible that we see the upper resistance levels.
Let's see how it plays out over the coming weeks.

Vol shock incoming?Looks like we're getting very close to a vol reaction. I think that it's likely that we see one more move down before we can see volatility react.
I'd be looking to start accumulate calls/spot down in the $23-31 region as I think that we're getting very close to a large move in volatility.
Marked off levels to the upside. Let's see how high we go.

Geopolitics Alert: Greenland, Tariffs & Potential VIX Surge 2026As President Donald Trump ramps up his aggressive foreign policy in early 2026, fresh tariff threats against European allies are stoking fears of a trade war escalation, potentially driving market volatility higher and pushing the VIX (fear gauge) into overdrive.
Trump's January 17 announcement of 10% tariffs starting February 1—rising to 25% by June—on eight European nations (Denmark, Norway, Sweden, France, Germany, the UK, the Netherlands, and Finland) unless they facilitate a U.S. "purchase" of Greenland has sent shockwaves through global markets.
This move, tied to his long-standing obsession with annexing the Arctic territory for national security reasons, risks severe retaliatory measures from the EU, including tariffs on up to $108 billion in U.S. goods.
The standoff is intensifying: European leaders are holding emergency summits, deploying troops to Greenland to assert sovereignty, and rejecting Trump's demands outright, with Danish officials calling it "blackmail."
Trump has not ruled out military options, linking his threats to a perceived Nobel Peace Prize snub, which could fracture NATO alliances and trigger broader geopolitical turmoil.
On X, traders are buzzing about immediate impacts—S&P futures dipping, VIX spiking from 13 to potentially 40 in a flash, and crypto liquidations exceeding $1B amid risk-off sentiment.
Oil prices are already edging higher on China data, but Greenland tensions add uncertainty, pushing safe havens like gold while hammering stocks and autos.
These risks—trade retaliation, alliance breakdowns, and failed annexation attempts—could cascade into major market disruptions, echoing past tariff shocks that tanked equities.
With no deal in sight for Greenland (public support in the U.S. is low at 17%, and force is even less favored), volatility looks set to surge.
Hedging with VIX futures or options isn't a bad idea for protection—better safe than sorry in this high-stakes game.

UVXY short-term TAUVXY is trying to reverse and getting ready for the push higher, currently there's a positive accumulation on hourly frame and daily frame is starting to accumulate as well, daily frame remains in the bearish area yet but it's improving and may break out soon. Keep an eye on VIX.

Too squeezy to ignoreThe VIX ETF just broke up the falling wedge in the weekly timeframe. I just bought this, it might pull back to test the broken resistant at 34-35. the VIS also is very low and trying to go up. And the SPY is close to ATH. MY SL triggers only if a weekly candle closes below 34.
Good luck

Jan 14 Major Volatility Event Update - Thank youI wanted to give everyone an update related to my thinking.
I'm not expecting this Jan 14 volatility event to be more than a 3-5% pullback event. I know that may seem huge for some of you, but it really is not that big.
What I really do expect is this event changes how the markets develop forward objectives for Q1 and Q2 2026.
I've tried to explain my actions and expectations in this video for all of you to review.
Remember, I'm just a trader like all of you. I use my tools and research to try to make the best decisions.
Overall, as I've learned, it is all about protecting capital and positioning for the best opportunities. If you are wrong, you take your lumps, learn, and try to do better next time. If you are right, you try to replicate that winning process.
As I mentioned before. Last year, I had a great year trading. I'm not going to go into details - but I'm very happy.
I'm looking to do even better this year.
As I continue to share more videos, remember one thing (please), I'm just sharing my thoughts. if you don't like my content - go find someone else you trust.
This is all about trying to make the best decisions.
Get some.

How Intermarket Signals Could Help to Avoid Major CrashesThree Crashes, One Pattern
I've been testing whether intermarket analysis can help avoid major drawdowns when selling weekly puts. Here's what the data shows across three very different market crashes:
COVID Crash (Feb-Mar 2020)
Drop: -914.75 points (-22.87%)
Duration: 29 bars, 41 days
Signal: BEAR fired in mid-February, BEFORE the crash
The macro composite dropped sharply as bonds rallied (flight to safety), credit weakened, and VIX exploded. The signal went red weeks before the worst of the selling.
2022 Bear Market (Jan-Jul 2022)
Drop: -837.25 points (-15.25%)
Duration: 137 bars, 199 days
Signal: BEAR fired in early January, stayed red through most of the decline
This was a slow grind lower as the Fed tightened. The indicator stayed in BEAR mode for most of the year, keeping me flat during the worst of it. Notice how the red background covers almost the entire decline.
April 2025 Tariff Crash
Drop: -770.25 points (-13.35%)
Duration: 6 bars, 10 days
Signal: BEAR fired in late March, BEFORE the drop
The fastest of the three crashes - just 10 days. But the macro signals still deteriorated first. Credit (JNK) weakened, volatility spiked, and the composite crossed below its signal line before price collapsed.
The Pattern
Three different causes (pandemic, Fed tightening, tariffs). Three different timeframes (41 days, 199 days, 10 days). But in each case, the macro signals deteriorated BEFORE equities fell hard.
The Core Idea
Markets don't move in isolation. Before major equity drawdowns, stress often appears first in:
TLT (Bonds) - Flight to safety begins
JNK (Credit) - High-yield weakens as credit risk gets priced
DXY (Dollar) - Strengthens as risk-off flows accelerate
VIX (Volatility) - Fear builds in the options market
The indicator normalizes each market using z-scores (standard deviations from 1-year average), then combines them:
Macro Score = (TLT + JNK) - (DXY + VIX)
When this composite trends down and crosses its signal line, conditions favor caution. When it trends up and crosses above, conditions favor risk.
Why This Matters for Put Sellers
Selling weekly puts has attractive math: 90%+ win rate, consistent premium. But the losses when they come are brutal (600% stop loss). One bad week can erase months of gains.
The question isn't IF a crash will happen. It's whether you're holding short puts when it does.
My 5-year backtest on ES 7DTE puts - using TastyTrades backtester:
Without Macro Filter:
357 trades | 96.1% win rate
Total P/L: +$63,492
Max Drawdown: 10.30%
Profit Factor: 2.90
With Macro Filter:
200 trades | 96.0% win rate
Total P/L: +$33,636
Max Drawdown: 2.91%
Profit Factor: 3.51
Key finding: 72% reduction in maximum drawdown.
Yes, fewer trades means less total profit. But avoiding the tail risk changes everything about position sizing and sleep quality.
Current Status: A Challenging Environment
Right now (January 2026), we're in a consolidation range. The macro score is hovering near flat, and with the 7-day EMA setting, signals are flipping almost weekly.
This is exactly the environment where the indicator struggles:
Range-bound price action
No clear macro trend
Frequent signal changes (whipsaws)
Difficult to follow systematically
I'm being transparent about this because it's real. The indicator seems to work well for catching major regime shifts but generates noise during consolidation phases.
Work in Progress
This is not a finished system. It's a research framework I'm actively developing. Areas I'm exploring:
Signal method variations - The indicator offers 7 different methods (EMA Cross, Slope, Momentum, Multi-Confirm, etc.). Some may handle consolidation better.
Longer smoothing periods - The current 7-day EMA is responsive but whipsaw-prone. Testing longer periods for range markets.
Regime detection - Adding logic to identify trending vs ranging environments and adjust sensitivity.
Combining with price filters - Using EMA20 or other price-based filters as secondary confirmation.
The goal is to reduce false signals during consolidation while maintaining the ability to catch major turns.
What It Catches vs. What It Doesn't
Works well for:
Major regime shifts with clear macro deterioration
Gradual credit/bond stress building over days or weeks
Events like COVID, 2022 bear market, April 2025 tariff crash
Struggles with:
Range-bound, choppy markets (like now)
Overnight gaps from surprise news
Idiosyncratic moves unrelated to macro
Short-term whipsaws in flat macro environments
How I'm Using It (Current Approach)
1. Check the indicator before opening new put positions
2. Clear RISK-ON (green, rising): Full position size
3. Clear RISK-OFF (red, falling): No new positions or reduce exposition
The "flat/choppy" category is new - I'm adding nuance rather than treating it as binary. When macro is unclear, I'd rather miss premium than get caught in a whipsaw.
The Honest Tradeoff
What you give up:
Fewer trades = less total premium
False signals in consolidation
Missed rallies when flat
Requires discipline to follow
What you gain:
Avoided COVID crash: -22.87%
Avoided 2022 bear: -15.25%
Avoided April 2025: -13.35%
Significantly better risk-adjusted returns
Ability to size up when conditions are clearly favorable
For me, avoiding those three crashes was worth the whipsaws in between. Your risk tolerance may differ.
Try It Yourself
I've published the indicator with multiple signal methods so you can test what works for your approach:
EMA Cross (what I use) - Classic crossover
Slope - Simple trend direction
Momentum - Rate of change threshold
Multi-Confirm - Requires 4+ methods to agree (more conservative)
Indicator in related ideas below.
What's Next
I'll continue refining this approach and will share updates as I find improvements. Specific things I'm testing:
Longer EMA periods for the signal line
Adding a "flat zone" where macro is inconclusive
Combining macro with price structure (above/below key MAs)
Different parameter sets for trending vs ranging markets
If you have ideas or are working on something similar, drop a comment. This is open research, not a black box.
Final Thought
Three crashes. Three different causes. Three times the macro signals warned before price collapsed.
Is it perfect? No - the current consolidation proves that. But when the big moves come, they tend to show up in credit, bonds, and volatility first.
I'd rather deal with some whipsaws during flat markets than be holding short puts when the next -15% hits.
---
What macro signals do you watch? How do you handle range-bound environments? Let me know in the comments.

VIX: Fear vs Correction principleBased on principle, where highest probability is when:
-(SPX) 50/200 UP sloping.
-Full correction
-Positive "context" (fundamentals, that change every year. For instance next year theme is new FED chair. Beginning of QE money printing etc).
Some times SPX drops and VIX flies on "fear". but strong trend stays in tact. And sometimes there is a full exhaust, meaning going up is "easy" (no resistance).

VIX Signals Rising Market Risk — Swing Trade Focus!📈 VIX Volatility Index — Swing Trade Bullish Setup 🚨
Asset: VIX Volatility Index (Fear Gauge)
Market Type: Index
Trading Style: Swing Trade
🧠 Trade Plan — Bullish Bias
Strategy: Thief Layering Method (Multiple Limit Order Entries)
🔹 Entry Plan
Layered buy-limit approach to capture volatility expansion from value zones.
🟦 Buy Limit Layers:
• 14.50
• 15.00
• 15.50
👉 You may increase or adjust layers based on your own risk appetite and capital size.
📌 Why Layering Works on VIX?
Volatility often expands in waves. Layering helps build position strength during uncertainty instead of chasing price.
🛑 Stop Loss (Risk Control)
❌ Thief SL: 14.00
⚠️ This SL is not mandatory. Adjust stop-loss based on your personal risk management plan.
🎯 Target Zone
💰 Primary Target: 17.50
🚔 Police Force Zone → Strong resistance + sentiment trap + overbought conditions may appear.
📤 Smart traders escape with profits, not emotions.
⚠️ Target is flexible — partial profits and trailing stops are always encouraged.
🔄 Related Markets to Watch (Correlation Guide)
📉 S&P 500 / SPX / SPY
• VIX usually moves inverse to equities
• Equity weakness = volatility expansion
• Sharp drops in SPX often trigger fast VIX spikes
📊 VIX Futures
• Futures strength confirms volatility expectations
• Watch near-term contracts for momentum clues
📈 Volatility ETFs
• High beta reaction to VIX movements
• Useful for confirmation, not prediction
📊 Technical Logic Behind This Setup
✔️ VIX measures expected 30-day market volatility, not price direction
✔️ Volatility compresses → then expands aggressively
✔️ Mean-reversion + breakout behavior makes layering effective
✔️ RSI, prior resistance zones, and sentiment shifts align near target area
🌍 Fundamental & Economic Factors to Monitor
📰 High-Impact Events That Fuel VIX
• Inflation data (CPI, PPI)
• Central bank interest-rate decisions
• Employment data (NFP)
• Unexpected economic surprises
🌐 Macro & Sentiment Drivers
• Geopolitical tensions
• Trade disputes & policy uncertainty
• Sudden equity sell-offs
• Risk-off sentiment across global markets
📌 Volatility often rises before panic becomes obvious — stay alert.
🚦 Key Levels Summary
🟢 Support Zone: 14.00 – 14.50
🟡 Reaction Zone: 16.00 – 16.80
🔴 Resistance / Target Zone: 17.50 – 18.00
A clean breakout above resistance may unlock further upside momentum.
⚠️ Risk Disclaimer
Dear Ladies & Gentlemen (Thief OGs),
This is not financial advice.
Profit, loss, stop-loss, and targets are your responsibility.
Trade smart. Protect capital. Take money when market gives.
💬 Drop your view below:
Do you expect fear to rise… or stay calm?
📊 Like, comment & share to support quality volatility analysis.

M2 Liquidity vs Gold × VIX — Macro Stress & Liquidity GaugeThe formula reflects real U.S. dollar liquidity, normalized through gold as a long-term store-of-value anchor and multiplied by VIX — an indicator of market stress and expected volatility.
The indicator has been working for over 20 years and captures global market sentiment: periods when market participants are willing to take on risk, as well as phases of consolidation and heightened caution.
The green zone represents periods of fear and liquidity compression — precisely the conditions under which favorable opportunities for gradual position accumulation are formed.
The red zone reflects overheated market phases, when investors are already deeply positioned and the incentive grows to lock in profits, move to cash, or rotate capital into other asset classes (under current conditions — including crypto markets).
The yellow zone serves as a transitional decision-making phase.
When the indicator moves from the green zone toward the red zone, the yellow zone acts as an area for partial profit-taking, helping reduce risk ahead of potential market overheating.
When the indicator moves from the red zone toward the green zone, the yellow zone may serve as an area for re-entering or gradually rebuilding a position.
The yellow zone functions as a balancing range, allowing for position management and capital reallocation without attempting to precisely time market reversals.

YEN CARRY TRADE LAST WAVE UP 5 of C of B CRASH SOON AFTERThe chart of the yen carry trade The reason for the coming CRASH in world markets for 2026 . Best of trades WAVETIMER !

VIX | Major Volatility and Market Correction Incoming | LONGThe VIX Index, formally known as the Cboe Volatility Index, is a real-time market index that represents the market's expectation of 30-day forward-looking volatility for the S&P 500 index. It is widely known as the "fear gauge" because it tends to rise sharply during periods of increased investor fear and market uncertainty.
Weekly US Market Outlook – SPY, QQQ, DXY, VIX (30 NOV)Weekly US Market Outlook – SPY, QQQ, DXY, VIX
Bullet points:
Market sentiment turned bullish again as the probability of a December Fed rate cut climbed to 87%.
Fear & Greed Index recovered from extreme fear (9) to 24.
Options sentiment still signals extreme fear → room for upside continuation.
DXY remains bearish until 99, supporting risk assets.
VIX continues to decline toward 15.70–14.20, but these levels historically precede sharp corrections.
Heavy data week ahead (ADP, Jobless Claims, PCE) → major volatility drivers.
SPY targets 690 → 700 zone; QQQ targets 625 → 637 → 647.5.
Market Sentiment
Market sentiment has shifted decisively toward a bullish stance after the probability of a December rate cut surged back to 86%. Markets are now pricing in one more cut before 2026, creating a supportive macro backdrop for equities. At the same time, the Fear & Greed Index has rebounded from extreme fear levels of 9 to 24, indicating a slow but clear improvement in risk appetite.
Stronger than expected earnings from NVDA continue to reinforce the narrative that the AI cycle is intact and far from bubble conditions. Additionally, easing geopolitical tensions specifically the US–China trade agreement have reduced risk premia across global markets. Taken together, these developments support a short to mid term bullish environment and increase the likelihood of a Santa Rally.
Options Sentiment
Despite improving market sentiment, options markets remain deeply positioned in the extreme fear zone. This divergence between spot indices and options positioning typically suggests that market participants remain hedged or underexposed, allowing equities to extend higher as positioning normalizes. In other words, options sentiment indicates there is still significant room for markets to explore higher price levels.
DXY – US Dollar Index
Monitoring the DXY is essential because of its direct correlation with risk assets. A rising dollar weighs on equities, while a declining dollar supports them. The DXY was rejected at the 100.30 level and is now retracing toward the HTF Key Zone, highlighted around 99.
My base case is a move down into the 99 region, followed by short term accumulation and a potential bounce back above this level. Until DXY reaches 99, the trend remains bearish, which historically provides strong support for equities, commodities, and other USD sensitive assets.
VIX – Volatility Index
VIX, which reflects S&P 500 options based volatility expectations, has been declining since the November 21 peak, which aligned with the recent local bottom in the S&P 500. I expect VIX to continue trending lower toward 15.70 and potentially 14.20 levels previously associated with S&P 500 all time highs.
However, it is crucial to note that when VIX reaches these zones, markets often experience rapid and unexpected corrections. Therefore, while volatility compression favors short-term bullish continuation, the risk of a sharp reversal increases as VIX approaches these historically significant thresholds.
Upcoming Data Releases
A high-impact macro week is ahead, especially between Wednesday and Friday. The key releases include:
ISM Manufacturing PMI – Monday
JOLTS Job Openings – Tuesday
ADP Nonfarm Employment – Wednesday
Services PMI – Wednesday
ISM Non-Manufacturing PMI – Wednesday
Initial Jobless Claims – Thursday
PCE Inflation (September, delayed) – Friday
Michigan Consumer Sentiment – Friday
The most influential dataset will be the combination of ADP Employment, Initial Jobless Claims, and PCE Inflation. If labor data comes in stronger than expected, the Fed may interpret it as a sign of a resilient labor market reducing the need for additional cuts. Conversely, if PCE inflation comes in hotter than expected, policymakers may see it as a reason to delay cuts.
Given that this PCE print is delayed due to the U.S. government shutdown, the market reaction may be muted, but it still matters for the December policy narrative.
SPY Weekly Outlook – Prediction
In my opinion, SPY is positioned to target new all time highs early in the week. Price may first test 686, followed by a brief retracement or consolidation, and then continue higher toward 690, marking a fresh ATH. Under strong bullish momentum, SPY may extend into the 700 zone by the end of the week. These levels represent the primary upside targets I will be monitoring closely.
QQQ Weekly Outlook – Prediction
QQQ remains structurally weaker than SPY, yet it also maintains strong bullish momentum. The 617 level is a key zone for potential call entries. Price may initially target 625, where a short term rejection could occur, followed by a small pullback. Afterward, QQQ could advance toward its all time high at 637, and in a stronger continuation scenario, possibly extend to 647.5.
Conclusion
Overall, market conditions have turned constructive again. Sentiment is stabilizing, central bank expectations are supportive, volatility is compressing, and the dollar remains weak all providing a tailwind for equities. This week’s heavy macro calendar may bring volatility spikes, but unless data significantly challenges the rate cut narrative, both SPY and QQQ appear positioned to continue their upward trajectory toward new highs.
⚠️ This analysis is for educational purposes only and does not constitute financial advice. Always conduct your own research before trading or investing.

VIX mid-term TAI've been watching VIX closely since September, and the accumulation has been growing since then and it's not stopped yet, it looks like it set double top and currently is cooling down but the indicators are still very strong and they don't get that strong that often on daily time frame, the VIX may look like it's cooling down for a holiday cheer but it didn't go away yet. So be prepared for a possible volatility to hit again.

volatility clustering"high volatility is often followed by high volatility (and low by low) rather than being randomly distributed"
Markets move in cycles. Using this principle you could some times predict outcomes (regime changes).

Macro Liquidity Model + Altcoin True Market Cap: CorrelationMacro Liquidity Model vs Altcoin Real Market Cap — CCI & MACD Confirmation
This model uses the formula:
FRED:M2SL / (CRYPTOCAP:TOTAL3 – CRYPTOCAP:USDT – CRYPTOCAP:USDC – CRYPTOCAP:DAI) × TVC:VIX
It shows the relationship between global liquidity (M2) market fear (VIX) and the true altcoin market capitalization (TOTAL3 excluding stablecoins).
This helps us understand which phase of the market we are currently in.
At the moment we are somewhere right near the bottom — if not already at the bottom. You can safely start accumulating any asset you prefer.
The CCI shows “overbought” conditions for M2, which actually means altcoins are oversold.
MACD hasn’t touched zero yet, which suggests there might still be a small dip left — which is also visible on the TOTAL3 – USDT – USDC – DAI chart.
If the next weekly candle closes bullish, there is a chance the market will continue rising until May, especially if the 2020 fractal repeats.
In general, May looks like the optimal time to start taking profits — and then we will see how the macro develops from there.
For additional clarity:
the upper chart represents global money (M2)
the lower chart represents altcoins
the higher the upper chart goes → the more money is OUT of the market
the lower it drops → the more money is FLOWING into the market

QuantSignals V3: VIX Poised for Potential Pullback – Handle WithVIX Weekly | QuantSignals V3 | 2025-11-20
Direction: PUT (Bearish)
Confidence: 58%
Expiry: 2025-11-28 (8 days)
Strike Focus: $23.00
Weekly Momentum: BEARISH (-1.17%)
Flow Intel: Neutral
Entry Price: Market (illiquid options)
Target 1: Price-dependent
Target 2: Price-dependent
Stop Loss: $24.01 (Katy AI stop level)
Position Size: 1% of portfolio (extremely cautious)
Analysis:
Katy AI: NEUTRAL overall, but 68.8% of prediction points below current price; final target $19.88 (-15.9%).
Technical: VIX at $23.66, 1-week bearish momentum, resistance $24.01, support around $21-22.
Options Flow: Extremely illiquid, neutral bias.
Risk Level: HIGH – illiquid market, low confidence, extreme volatility.
Trade Setup:
Why Trade: Detailed AI series shows consistent downward bias.
Timing: Position early in the week to capture predicted decline.
Risk Mitigation: Extremely small size; stop loss at $24.01.
⚠️ Important: Illiquid VIX options make this trade high-risk. Only for professional traders or market-makers. Retail traders should avoid.
PRE-NY CONDITIONS Dollar is pressing into a major cross-asset high, recognized across FX, yields, and risk assets. London kept DXY inside a tight structure with no clean breakout, which turns this level into stop-time: the point where liquidity pauses and the market decides whether the move extends or fades.
Front-end yields remain firm, anchoring the Dollar’s support. The 10-year is indecisive, offering no confirmation and keeping the curve without a clear macro signal. ES holds its overnight gap on Nvidia strength, but volatility near 21 keeps risk fragile. Gold remains neutral, reflecting a balanced but uncertain safety tone into the U.S. session.
DXY: Testing a major high; range-bound after London; structure stretched but supported by 2Y strength.
US10Y: Indecisive daily structure; long end is not confirming Dollar strength; macro tone remains unclear.
US2Y: Firm short-end repricing; maintains policy pressure and supports Dollar tone.
ES: Holding gap; risk appetite supported but shallow; volatility still limiting follow-through.
Gold: Neutral safety tone; neither attracting nor rejecting flows; reflects cross-asset indecision.
VIX: Near 21; elevated volatility keeps conditions reactive and reduces trend reliability.
Cross-asset alignment remains mixed. The Dollar is firm, but only the front end confirms it. Long-end yields hesitate. ES shows controlled appetite, but volatility denies conviction. Gold confirms the indecision. Liquidity conditions lean cautious, shaped more by bond market signals than by clean macro drivers.
Pillar Focus: PEM — Confirmation Entries
Today's environment aligns with PEM logic. A stretched Dollar at a major level, split yields, and elevated volatility mean operators should rely on confirmation-based triggers, shorter engagements, and strict timing. High-frequency windows (NY open → 10:00 → London fix) carry more clarity than directional assumptions.
Follow higher-timeframe direction
Ignore noise from earlier sessions
Wait for structure + flow alignment
Act only on confirmation
Summary: NY opens into a cautious environment defined by a stretched Dollar, mixed yields, and elevated volatility — a clear PEM day.
— CORE5DAN
Institutional Logic. Modern Technology. Real Freedom.

QuantSignals V3: High-Confidence VIX DowntrendVIX QuantSignals Katy 1M Prediction (2025-11-19)
Current Price: $22.40
Trend: Bearish
Confidence: 75%
Volatility: 94.1%
Final Prediction: $20.98 (-6.34%)
30-Min Target: $21.10 (-5.81%)
Trade Signal:
Direction: PUT
Entry: $22.40
Target: $21.26
Stop Loss: $22.74
Expected Move: -6.34%
Summary: 1 trade signal generated from 1 successful analysis.
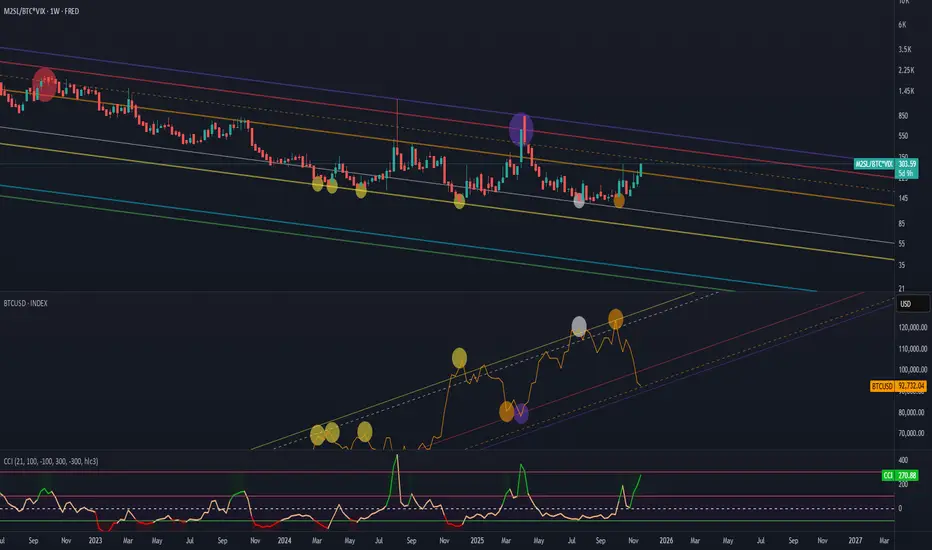
Liquidity (M2) to BTC.D, amplified by (VIX) FEARIt shows the ratio of global liquidity (M2) to Bitcoin’s market capitalization, amplified by market fear (VIX), relative to BTCUSD.
Thanks to this formula, we have an understanding of which phase of the market we are currently in.
In this case the CCI indicator shows:
overbought conditions — meaning money is outside the market and
oversold conditions — meaning there is too much money in the market and it’s time to sell
FRED:M2SL/CRYPTOCAP:BTC*TVC:VIX
For some reason the Bitcoin chart isn’t displaying with all the markings, so I’ll attach a screenshot below.
PRE-LONDON CONDITIONS — DXY Range-Bound, Yields Slide, ES HeavyU.S. Dollar Index (DXY) holds a tight 98.99–99.59 range in a third consecutive inside bar.
U.S. 10-year yield drops ~1.01% in Asia.
U.S. 2-year yield falls ~1.27%.
S&P 500 futures (ES) extend lower toward the 6.571 fractal.
Gold tests support after filling imbalance.
Volatility remains elevated.
DXY — Dollar Index
Dollar stays inside 98.991–99.591.
Inside-bar stack remains unbroken.
Price sits near the 0.6 premium zone.
Neutral until London breaks the range.
Yields — 10Y & 2Y
10Y yield: -1.01% in Asia → long-end compression.
2Y yield: -1.27% → dovish policy tone.
Curve: both ends lower → risk-off positioning.
ES — S&P 500 Futures
ES moves lower toward 6.571.
Yesterday’s high-volatility expansion continues.
Tone remains defensive.
Gold — Safety Premium
Gold fills imbalance and presses into support.
Break = active safety flows.
Hold = passive bid.
Volatility
VIX closed pre-London.
Futures hold elevated regime.
Conditions favor fast intraday expansions.
Calendar Risk
Medium-tier data ahead.
Yesterday’s partial data production repeats → limited visibility.
Expect flow-driven moves until major prints arrive.
Execution View
DXY bias neutral inside range.
Yields down + ES down = risk-off.
Gold support = key inflection.
London expansion outside 98.99–99.59 sets direction.
Trade second move, not first spike.
Summary:
Dollar trapped. Yields lower. ES heavy. Gold at support.
Fragile pre-London environment; London’s first expansion defines the session.
— CORE5DAN
Institutional Logic. Modern Technology. Real Freedom.
