FireHoseReel | SKY Is Gaining Strong Momentum🔥 Welcome to FireHoseReel !
Let’s check what SKY is setting up right now.
👀 SKY – 4H Overview
SKY has managed to recover its recent price drop very well over the last few 4H candles and is now approaching a major breakout resistance.
If this bullish leg continues, SKY could experience further upside expansion.
📊 SKY Volume Analysis
Volume has increased clearly during the recent rise.
If the upcoming pullback is accompanied by decreasing volume, followed by a renewed expansion in buy volume and an upside move, this would serve as a strong confirmation of trend continuation.
✍️ SKY Trading Scenarios
🟢 Long Scenario
A pullback toward the $0.05582 resistance, followed by lower corrective volume, and then a strong volume expansion after confirming resistance-as-support, could activate our multi-timeframe long trigger.
🔴 Short Scenario
A break below the key support at $0.04893, accompanied by heavy selling pressure, could provide a valid short setup for SKY.
❤️ Risk Management & Emotional Discipline
Crypto trading is highly risky. Without proper risk management and emotional control, trading is no different from gambling.
Logic must always come before emotions. Learn to manage your trades, and enjoy the process of trading with control and discipline.
VOL

FireHoseReel | WLFI: Ready to Explode, Don’t Get Left Behind🔥 Welcome FireHoseReel !
Let’s break down what’s happening with WLFI right now.
👀 WLFI – 4H Technical Breakdown
WLFI has successfully broken its 4H dynamic resistance and has already completed a clean pullback retest.
Price is now pushing into the 4H box top, and a confirmed breakout above this zone will activate our long trigger, giving us a valid entry setup.
📊 Volume Analysis – Key Factor for Breakout
Multi-timeframe volume is increasing as WLFI approaches this resistance.
This time, the breakout attempt is backed by stronger buy volume + a clean curve-line break, unlike previous attempts where price showed volume divergence and failed to break through.
For WLFI, volume is the critical element—without strong volume, this resistance has historically rejected price.
✔️ WLFI/BTC Pair Note
The WLFI/BTC pair isn’t very useful for analysis since it’s only listed on Upbit, and the chart lacks structure and clarity.
Because of that, we rely mainly on the WLFI/USDT pair, which currently shows solid momentum toward a breakout.
✍️ Long Scenario setup becomes valid with:
• Breakout above 0.1602
• Clear volume convergence + increasing buy pressure
• A structure that forms a higher high outside the 4H box
• You can also wait for a break-and-retest (pullback) of this resistance to enter.
This entry is slightly riskier but gives a cleaner confirmation if the pullback candle forms an indecision/rejection setup.
🛞 Risk Management & Disclaimer
Please remember to always use proper risk management and position sizing. Nothing in this analysis is financial advice. The market can change quickly, so always trade based on your own strategy, research, and risk tolerance. You are fully responsible for your own trades.

FireHoseReel | BNB Daily Analysis #4🔥 Welcome FireHoseReel !
Let’s dive into the analysis of BNB (Binance Coin).
👀 BNB – 1H Timeframe
BNB is currently breaking through its multi-timeframe resistance around $842.
If price forms a higher low above this zone, we can take it as a valid confirmation for bullish continuation.
Keep in mind: the long trigger sits at $880, which makes this setup a bit risky.
📊 Volume Analysis
The volume indicator is showing rising multi-timeframe buy volume, which is different from previous behavior on the left side of the chart.
This suggests a healthy convergence of buying pressure, showing that sellers are weakening, market fear is fading, and investors are slowly stepping back in to accumulate at these levels.
✔️ BNB/BTC Pair Perspective To look at things differently, we also check the BNB/BTC pair, which helps us understand the structure more deeply.
The pair is still in the same condition as yesterday, with one difference:
The multi-timeframe resistance at 0.0991 could become a risky long trigger.
A breakout above this zone may push momentum into the BNB/USDT pair as well.
✍️ Let’s break down the trading scenarios for BNB on the 1H timeframe.
🔼 Long Scenario:
We need:
• Strong buyer support and increased participation
• Continued multi-timeframe volume convergence
• Breakout of key resistance zones on both BNB/USDT and BNB/BTC
If these conditions align, we can take a low-risk (0.5%) long entry on the breakout.
If needed, we can also add to the position on higher resistance breakouts.
🔽 Short Scenario:
A breakdown of the key support levels on the chart + clear selling pressure can give us a valid short or exit signal.
This breakdown may also require a break of USDT dominance resistance, which would strengthen the bearish move.
🛞 Risk Management & Disclaimer
Please remember to always use proper risk management and position sizing. Nothing in this analysis is financial advice. The market can change quickly, so always trade based on your own strategy, research, and risk tolerance. You are fully responsible for your own trades.

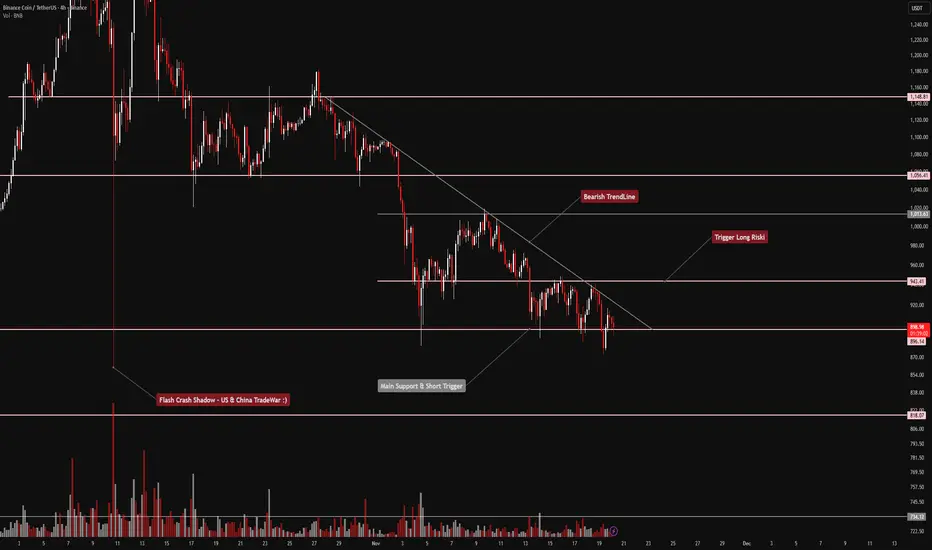
FireHoseReel | BNB Daily Analysis #1😄 Hey! How’s it going? You good?
🍾 Welcome to Fire Hose Reel!
Hit that follow button and enjoy the analysis ahead. And if you ever want a custom chart breakdown, just drop a comment — I got you.
😎 Let’s jump into the analysis of my favorite coin : BNB
👀 BNB on the 4-hour timeframe
After the recent flash crash in the market, BNB entered a corrective phase. A descending trendline (dynamic resistance) has formed, and every time price touches it, we see a retracement.
Right now, BNB is walking right along a major support zone. Losing this area could push price down toward the next support.
This key support sits around $896, and a breakdown below it could intensify the bearish trend, adding momentum to the downside and breaking price out of this triangle-shaped structure.
📊 Volume Indicator
Looking at the volume below the chart, every touch of the trendline has caused sellers to step in, sometimes even breaking strong support levels. When that happens, the volume bars spike upward, signaling increased selling pressure.
At the moment, if sell volume continues rising, BNB could lose the $896 support and move further downward.
✔️ Now let’s analyze something different — BNB/BTC pair
On the 4-hour timeframe, BNB/BTC hit an important resistance level and got heavily rejected, pushing price downward.
Here’s the key point:
BNB’s relative value against BTC is still higher, and just like the USDT pair, it’s sitting on a major support.
If this level breaks, maximum selling pressure could kick in and cause a strong drop.
✍️ Trading Scenarios (Long & Short)
🔼 Long Scenario
• A breakout above the descending trendline
• Confluence with the $943 resistance
• Strong buy volume confirming the breakout
This setup is a bit risky, since higher timeframes are still leaning bearish. Tight stop-loss & quick partial take-profits are recommended.
🔽 Short Scenario
The current level where price is hovering can act as a good support, but if this zone breaks with selling pressure, price could move downward.
That gives us a clean opportunity to open a short trade on the breakdown.
🛞 Risk Management & Disclaimer
Please remember to always use proper risk management and position sizing. Nothing in this analysis is financial advice. The market can change quickly, so make sure you trade based on your own strategy, research, and risk tolerance. You are fully responsible for your trades.
Will Ethereum’s tight range lead to a breakout? | Day 34☃️ Welcome to the cryptos winter , I hope you’ve started your day well.
⏰ We’re analyzing BTC on the 1-Day timeframe .
👀 Ethereum on the daily timeframe. Ethereum is currently inside a box-like structure in a trading range format. The top of this trading range is in the $4,161 area, and the bottom of this trading range is in the $3,801 price area, where by breaking these zones, Ethereum can start a stronger and more impulsive leg of movement.
🧮RSI oscillator, which has now formed two important oscillation zones for us — one around 54, which overlaps with our long trigger, and the other around 40, which overlaps with our short trigger. The fluctuation limit crossing these zones can give more momentum to Ethereum’s next move on the daily timeframe.
🕯 Ethereum’s volume, after the flash crash the market experienced, has increased sharply, but the tendency has been pushed toward selling pressure, which has caused Ethereum’s corrections to always come with selling pressure.
📈 For Ethereum positioning, the specified zones have high price action validity, where you can set alerts so that if the price reaches these zones, you can open a position. Or, in the multi-timeframe, you can find the identified support and resistance zones and open positions with lower risk around these areas, moving toward anticipating higher or lower levels, so that in each level, you can add some risk to your position.
❤️ Disclaimer : This analysis is purely based on my personal opinion and I only trade if the stated triggers are activated .

Has Bitcoin already priced in its next move ? | Day 56☃️ Welcome to the cryptos winter , I hope you’ve started your day well.
⏰ We’re analyzing BTC on the 1-Day timeframe .
👀 Bitcoin on the daily timeframe. After the flash crash it experienced, Bitcoin is almost building a box with a top at $114,559 and a bottom at $106,431, which by breaking these areas, it can get out of this trading range and give us a position.
The noteworthy point in the recent days is the Monday meeting between Trump and the President of China, which can determine the destiny of the market and give it a good direction.
🧮 The RSI oscillator, two key zones have formed for us in the areas of 54.5 and 36, and by the fluctuation limit crossing these areas, the next move of Bitcoin can begin.
🕯 Bitcoin’s volume on the daily timeframe has increased sharply after recording a new all-time high, and this has been a tendency toward increasing selling pressure. In the image, it is completely clear that you can see exactly what happened to the market after the flash crash it experienced.
📈 To take a position with this structural style that we currently have, you can refer to the multi-timeframe analysis of Bitcoin and extract the long and short position triggers, and if Bitcoin gives you an entry, enter the position around the anticipated top or bottom with low risk so that later you can add more volume to your position at higher or lower levels.
❤️ Disclaimer : This analysis is purely based on my personal opinion and I only trade if the stated triggers are activated .

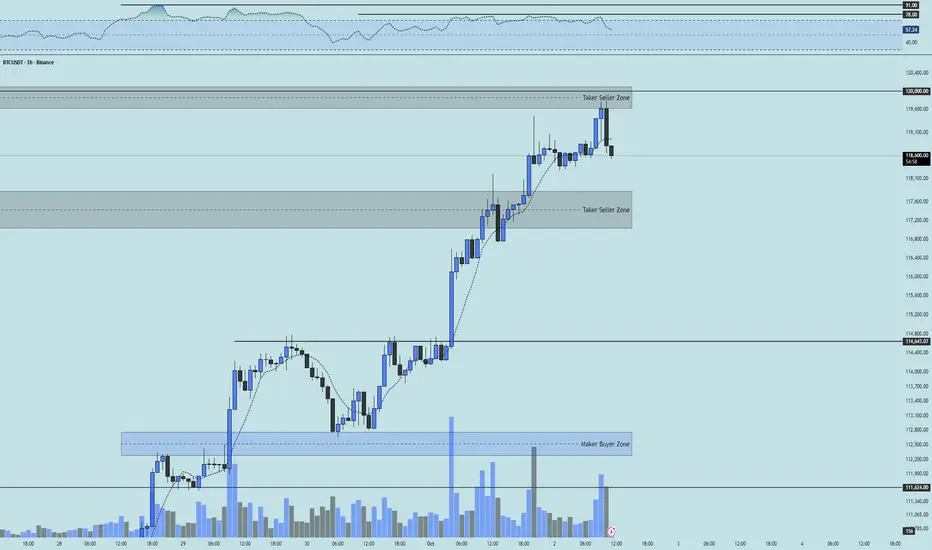
BTC 1H Box Breakout Setup | D1👋 Hey everyone! Hope you’re doing great!
💥 Welcome to Satoshi Frame — today we’re diving into the 1-hour Bitcoin analysis. Stay tuned and follow along!
👀 On the 1-hour timeframe of Bitcoin, we can see that after its recent drop, Bitcoin has entered a one-hour consolidation box. The top of this box is around $115,802, and the bottom is at $110,224. A breakout from this box could lead to the next impulsive move. Currently, Bitcoin’s price is near the midline of the box at $113,222 — and if it breaks and stabilizes above this level, Bitcoin could start moving toward the top of the box and potentially break above it.
Notice that Bitcoin reacted to the buyer-maker zone near the bottom of the box, showing a reversal pattern. With buying pressure pushing it upward and a higher low forming, the probability of a midline breakout has increased.
🧮 Looking at Bitcoin’s RSI oscillator, it’s currently near the static resistance around the 54 range. If RSI breaks and stabilizes above this level, long-trade momentum is likely to increase, which could help Bitcoin break through the midline and become more bullish.
🕯 Let’s first discuss the maker-buyer zone, which acts as a major support area for buyers and institutions that accumulate their positions here. This area tends to create counter-direction reactions in Bitcoin. Right now, Bitcoin has formed a higher low just below the midline and is showing increasing buying volume, with larger candle sizes appearing on the chart.
🧠 For Bitcoin’s trading setup, once the midline breaks, we can consider entering a position, forming a potential long scenario:
↗️ Long Position Scenario:
If Bitcoin breaks and stabilizes above $113,222, accompanied by an RSI breakout above 54 and a rise in buying volume, it could move toward the top of the box and provide a solid long opportunity.
❤️ Disclaimer : This analysis is purely based on my personal opinion and I only trade if the stated triggers are activated .

BTC 1H Analysis - Key Triggers Ahead | Day 52☃️ Welcome to the cryptos winter , I hope you’ve started your day well.
⏰ We’re analyzing BTC on the 1-Hour timeframe .
👀 On the 1-hour timeframe, Bitcoin has broken through all major resistance levels, setting a new ATH, and then experienced a 2% price drop due to profit-taking and FOMO-driven selling. It then moved toward its key support zone around $122,584, bounced from there, and is now moving toward its early trigger zone at $124,113.
🧮 The RSI oscillator shows two important levels — 63 and 45 — and once the volatility threshold crosses especially above 63, Bitcoin could see a sharp increase in volatility, activating its triggers and enabling breakout moves.
🕯 Bitcoin’s volume has decreased after each touch of resistance, but now with a noticeable volume increase, our early trigger could become active, allowing Bitcoin to form larger, high-volume candles either upward or downward. Since the high-wave cycle remains bullish, the current scenario still favors upside continuation and resistance breakouts.
🧠 For Bitcoin positions, it’s better to wait for all confirmations to align — including activation of the early trigger, an RSI breakout above 63, and rising buy volume — before opening a long position.
❤️ Disclaimer : This analysis is purely based on my personal opinion and I only trade if the stated triggers are activated .

BTC 1H Analysis - Key Triggers Ahead | Day 50☃️ Welcome to the cryptos winter , I hope you’ve started your day well.
⏰ We’re analyzing BTC on the 1-Hour timeframe .
👀 On the 1H timeframe for Bitcoin, after breaking through the taker-seller zone around $117,550, price pushed up toward its resistance area near $120,000. From there, we’ve started to see early signs of rejection. With a 1H candle close rejecting this zone, we can say that after such a strong rally, Bitcoin is now entering its corrective phase, moving back toward its key support levels. Let’s break it down deeper.
🧮 The RSI oscillator, after consolidating for about 1 day and 6 hours around the overbuy boundary, has now started to exit that zone. This suggests potential downside momentum toward its key swing supports. Keep in mind, a static swing resistance formed at the 78 level in overbuy territory. If that breaks — along with the taker-seller zone — long trades could push RSI up toward 91 before facing a possible rejection (a less likely scenario for now). At this stage, I don’t have a clear key support zone to highlight, but with corrective structure forming, I’ll point out the levels to watch in future updates.
🕯 Today’s buying candles expanded slightly in size and volume following the weaker USD news. However, because the move up has been sharp and the number of selling candles limited, hitting the taker-seller zone increases the probability of a pullback. A strong close with solid selling volume would confirm corrective pressure for Bitcoin.
🧠 I believe the smarter approach is to wait for the corrective structure to play out first. Once the new resistance levels are defined and broken, we can look for setups. Keep in mind, shorting here isn’t ideal — the broader trend is still strongly bullish and momentum is very powerful. The goal is to position for the next high-probability move, not fight the trend.
↗️ Long scenario: A Bitcoin long could be considered on a clean break above RSI 78 combined with a strong candle close above the marked taker-seller zone, ideally supported by increasing buy volume. Multi-timeframe candle setups would give stronger confirmation for entry.
📉 Short scenario: At the moment, I don’t see a high-probability short setup. Long positions are simply carrying more edge (and dopamine).
❤️ Disclaimer : This analysis is purely based on my personal opinion and I only trade if the stated triggers are activated .
HBAR 4H Analysis – Key Triggers Ahead💀 Hey , how's it going ? Come over here — Satoshi got something for you !
⏰ We’re analyzing HBAR on the 4-hour timeframe timeframe .
👀 On the 4H timeframe for HBAR , we can observe that this coin is ranging inside a box with very strong support and resistance levels. The last time, it reacted to the midline of this box (50% zone) and has built a trading structure for a potential breakout.
⚙️ The key RSI levels are at 57 and 35. Once the oscillation surpasses these levels, the price of this coin can shift and bring momentum into the market. Keep in mind that these zones often indicate increased volatility in the direction of price movement.
🕯 The volume of this coin has been decreasing over the past few days, and the number of trades has significantly dropped. Many buy and sell orders have been filled, and the coin is currently ranging in this box, deciding its next direction. Notice that with declining volume, we can often identify a new trend forming, since the current trend may be coming to an end.
📊 On the OTHERS.D index 4H timeframe , we can see that it is also moving inside a box, with the top of the box at the 7.9% zone . Breaking this level along with the RSI surpassing 63 could bring strong volume into the market. At the same time,
📊 a breakout on the TOTAL3 index would also inject solid volume into the market. This index is likewise inside a box, and the last time it reacted to its midline, it rebounded upward and is now moving toward the 1.08 resistance.
💰 Looking at the HBAR/BTC pair , we can observe that it has formed a box-like structure, similar to its USDT pair. With a breakout above the midline, more Bitcoin could be liquidated and converted into this coin. HBAR is considered one of the whales’ favorite coins.
🔔 The alert zones for HBAR carry some risk, and the possibility of failure should also be considered. The long alert zone is around 0.25846, which is the midline of this 4H box. The short alert zone is around 0.22784. Breaking this zone could provide a short position, coinciding with a deeper correction for this coin.
❤️ Disclaimer : This analysis is purely based on my personal opinion and I only trade if the stated triggers are activated .

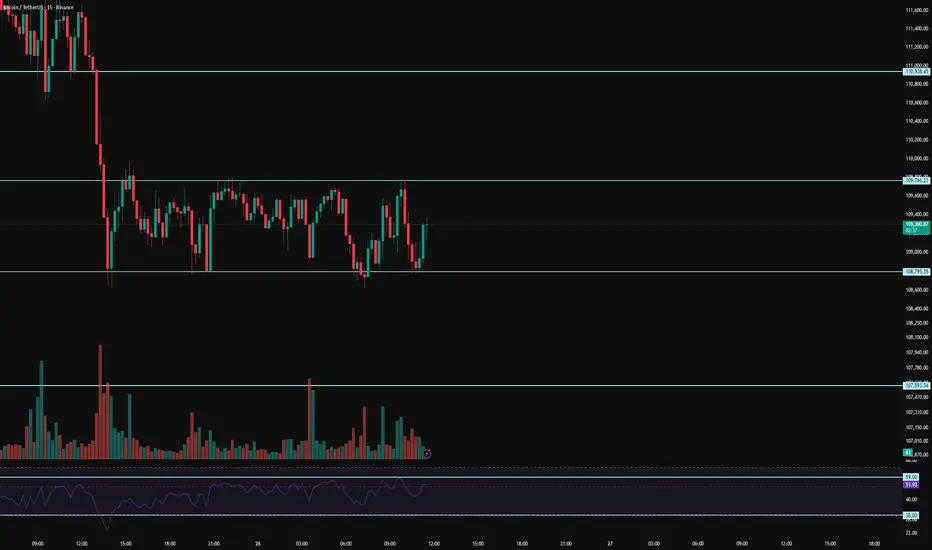
BTC 15M Analysis - Key Triggers Ahead | Day 47❄️ Welcome to the cryptos winter , I hope you’ve started your day well.
⏰ We’re analyzing BTC on the 15-Minutes timeframe .
👀 After several days of decline from the zones we previously identified, we are back to analyze Bitcoin for you. On the 15-minute timeframe, Bitcoin is consolidating above the $108,800 support level, with the upper boundary of this consolidation at $109,760. A breakout above this level could signal the beginning of a new structure and trend. A breakdown below support, however, seems less convincing for a short position, as many traders who feel they missed out are now stepping in to buy. Current support zones are acting as both maker and taker buy levels. Bitcoin requires increased volume to confirm either a breakout or breakdown. With the upcoming weekend, however, risks must be carefully managed due to typically lower market activity.
🧮 Looking at the RSI oscillator, it is currently holding above the 50 level but facing resistance around 59. A breakout above 59 could enable Bitcoin to break consolidation resistance and push higher. On the other hand, a key zone lies near the oversold boundary; if Bitcoin enters this area, selling pressure could intensify and trigger a deeper correction.
🕯 Candle size and volume on the 15-minute chart remain within a range. We must wait for significant volume inflow—either upward or downward—to confirm direction. Bitcoin is shaping a new structure for the upcoming week, so patience is required until a breakout with decisive green or red candles occurs.
🧠 Trading outlook: It is preferable to wait for market structure to mature, with multiple tests of both support and resistance. The candlestick type used for entry is crucial, along with momentum confirmation at key RSI levels. A breakout above $109,766 combined with RSI surpassing 59 could provide a long setup. A breakdown below $108,795 combined with RSI falling below 30 and stronger selling pressure could trigger a short setup. Keep in mind that weekend trading usually comes with lower volume, which may result in indecisive structures—unless an unexpected global event sparks volatility.
❤️ Disclaimer : This analysis is purely based on my personal opinion and I only trade if the stated triggers are activated .
BTC 1H Analysis - Key Triggers Ahead | Day 44😃 Hey , how's it going ? Come over here — Winter got something for you!
⏰ We’re analyzing BTC on the 1-Hour timeframe.
👀 On the 1-hour timeframe for Bitcoin, after testing the $115,123 support level, price entered a ranging zone during the holiday session. A breakout above or below this range could give us a long or short setup. Although Bitcoin was expected to make a strong upward move (which it did), it then faced seller pressure.
🧮 Looking at the RSI oscillator, BTC is consolidating around the 50 zone and is now close to the key 40 support level. Losing this level could shift momentum toward selling. On the upside, the 70 zone remains important: if RSI breaks above it, Bitcoin can enter overbought territory and push higher.
🕯 Currently, candle size and volume remain in range, so we’ll need to wait for the new weekly open to see where Bitcoin decides to move.
🧠 In my view, it’s better not to take a position directly on BTC. As mentioned earlier, focusing on altcoins could be more profitable — if Bitcoin corrects, we can still catch strong entries on alts.
❤️ Disclaimer : This analysis is purely based on my personal opinion and I only trade if the stated triggers are activated .

BTC 1H Aanalysis - Key Triggers Ahead | Day 42😃 Hey , how's it going ? Come over here — Winter got something for you!
⏰ We’re analyzing BTC on the 1-Hour timeframe.
👀 On the 1-hour timeframe for Bitcoin, we can see that after reaching the seller trigger zone around $117,825, price was rejected to the downside. Currently, it is losing an important support level on this timeframe, and if we get a candle close below this zone, Bitcoin will likely move toward the buyer trigger area. After that, the market will enter a decision-making phase, where we will have to wait and see what happens in the coming week.
🧮 Looking at the RSI oscillator, there is a key level around 34. If momentum breaks below this level, we could see a deeper correction in Bitcoin’s price.
🕯 The size and volume of red candles are increasing, showing that many traders are selling Bitcoin and closing their long contracts. We need to watch how far this selling pressure continues. This correction, along with the selling momentum, is not unusual — it’s a natural part of Bitcoin’s price movement. Once this correction is complete, we’ll need to see what structure Bitcoin forms next.
🧠 For Bitcoin to make a real bullish reversal without entering an accumulation phase, the support level currently being lost could turn into a strong resistance trigger for future long positions. However, the main trigger remains at $117,825. If Bitcoin breaks above and holds that level, it could even set a new all-time high (ATH).
❤️ Disclaimer : This analysis is purely based on my personal opinion and I only trade if the stated triggers are activated .

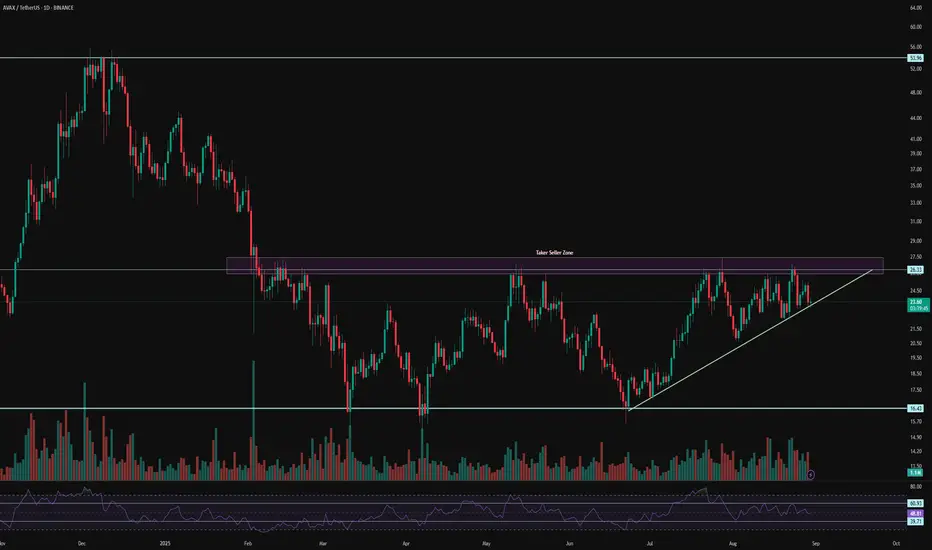
AVAX 1D Analysis – Key Triggers Ahead💀 Hey , how's it going ? Come over here — Satoshi got something for you !
⏰ We’re analyzing AVAX on the 1-Day timeframe timeframe.
👀 In the daily timeframe of AVAX, after the drop it experienced, AVAX entered a box with a long-term range. The ceiling and floor of this box are in the area of $16 and $26. The time range of this box or its length is almost 170 days. At the ceiling of this box, there are strong seller tickers that get their sell orders activated every time the price reaches this area. To break this zone and for a good rise of AVAX, we need a very strong and high-volume momentum that causes a price jump and fills the sell orders.
💰 In the daily timeframe of AVAXBTC we can see a relatively good compression formed in this area, and with the breakout of the Bitcoin ceiling, more Bitcoin will be converted into AVAX and it can be a good confirmation for a long position and some spot buying. The area considered for the alarm zone is 0.0002286.
⚙️ Two key areas for RSI have been considered. Passing the swing limits of 61 and 40 can bring good volatility to AVAX and help it break out of this RSI compression that is seen as a box.
🕯 The area considered as the seller ticker is a strong one, and every time the price reached this area, we faced selling pressure. The size of the green candles is also larger compared to the red candles, and each time the compression area became smaller and the price is ready for a breakout and reaction (not today but next week).
🔔 The area we considered as the alarm zone for AVAX is $26, and with the breakout of this area, AVAX can move towards higher price levels. Price behavior at $26 can give us complete awareness for trading.
❤️ Disclaimer : This analysis is purely based on my personal opinion and I only trade if the stated triggers are activated .
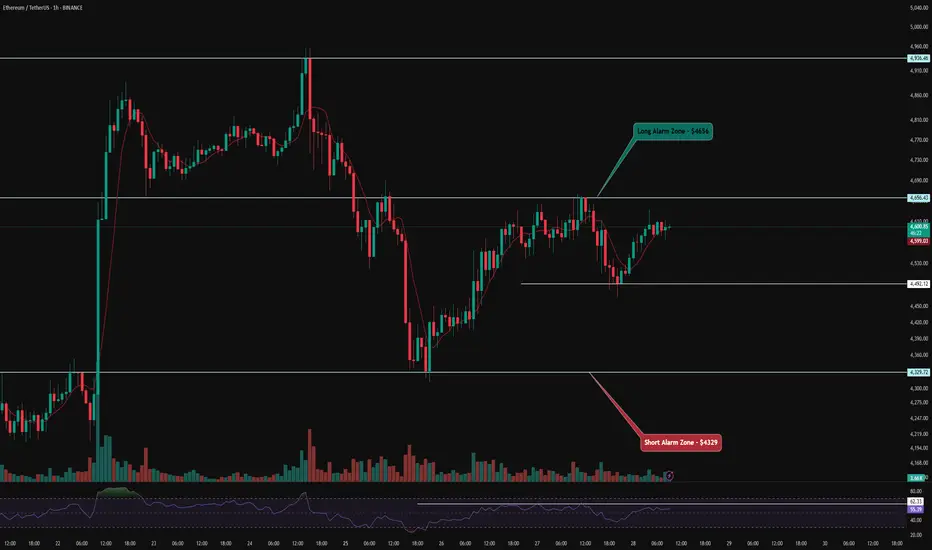
ETH 1H Analysis – Key Triggers Ahead | Day 5💀 Hey , how's it going ? Come over here — Satoshi got something for you !
⏰ We’re analyzing ETH on the 1-hour timeframe timeframe .
🔭 On the 1H timeframe for Ethereum, we can observe that ETH is moving inside a 1-hour range box, which has also formed with a V-pattern structure. A breakout and consolidation above or below this box can provide us with either a long or short trade setup.
⛏ The key RSI level is around 62, where Ethereum has been ranging for almost 2 days below this level with support around the 50 zone. Once the oscillation surpasses these levels, Ethereum can start its next move.
💰 The volume and number of green and red candles are almost equal. However, with larger green candles and rising volume, we can say that Ethereum is holding a good amount of accumulation volume.
📊 On the 1H timeframe of ETHBTC , we can observe that the alert zone for confirming a long position in Ethereum has slightly shifted lower, now sitting around 0.0415. Breaking this zone could allow Ethereum to move toward higher resistance levels and potentially even register a new all-time high.
💡 Looking at Ethereum’s alert zones, the level for a long position is around $4556, while the level for a short position is around $4329. With a breakout and consolidation above or below these areas, Ethereum gives us trade opportunities. Monitoring price behavior in these zones can be of great help in decision-making.
❤️ Disclaimer : This analysis is purely based on my personal opinion and I only trade if the stated triggers are activated .
BTC 1H Analysis – Key Triggers Ahead | Day 24💀 Hey , how's it going ? Come over here — Satoshi got something for you !
⏰ We’re analyzing BTC on the 1-hour timeframe timeframe .
👀 On the 1-hour Bitcoin chart, BTC is in a box and has formed a V-pattern. Breaking the box's ceiling would trigger the V-pattern breakout. The breakout trigger for Bitcoin is at $112,200.
⚙️ Key RSI levels are 64 and 46. When oscillation crosses 64, Bitcoin’s momentum heads toward overbought.
🕯 Volume, size, and number of green candles have increased, with buyer makers present. There was an attempt to break resistance with higher volume, but seller takers pushed the price back. Buyer makers then guided the price up from a higher low. Breaking resistance needs more volume.
💵 On the 1-hour USDT.D chart, Tether dominance is at 4.35%. Breaking this could bring significant trading volume to Bitcoin.
🔔 Bitcoin’s trading alarm zone is at $112,200, where price action could be highly reliable. No specific short position idea, but if $110,000 breaks with heavy selling, I might open a position.
❤️ Disclaimer : This analysis is purely based on my personal opinion and I only trade if the stated triggers are activated .

BTC 4H Analysis – Key Triggers Ahead | Day 23💀 Hey , how's it going ? Come over here — Satoshi got something for you !
⏰ We’re analyzing BTC on the 1-hour timeframe timeframe .
👀 On the 4-hour Bitcoin chart, after hitting a new high, BTC faced a quick rug pull/sell-off with strong momentum toward the $112,000 support. It then bounced with a solid 4-hour candle toward the $117,000 resistance but got heavily rejected again with selling pressure. BTC is now around $110,000, supported once by buyer makers. Today, check Forex Factory for key US economic news that could impact the market.
⚙️ Key RSI level is near 30; crossing this with high volatility could intensify selling pressure, offering a small risk opportunity. Another key level at 64; breaking this could form a higher low compared to the previous one.
🕯 Red candles are increasing in size and volume, with fewer but larger candles moving downward, indicating sustained selling pressure.
💵 On the 1-hour USDT.D chart, after breaking 4.44%, it’s moving upward but showing trend weakness. This level is key for BTC’s highs and lows. A rejection and drop in dominance could boost BTC and BTC pairs, while a hold above 4.44% could deepen BTC’s correction.
🔔 Trading alarm zones are at $112,240 and $109,800. A break and hold above/below these could offer trade setups. Always check oscillator conditions and Tether dominance. Also, focus on BTC pairs — they provide more momentum with less capital.
❤️ Disclaimer : This analysis is purely based on my personal opinion and I only trade if the stated triggers are activated .

BTC 1H Analysis – Key Triggers Ahead | Day 22💀 Hey , how's it going ? Come over here — Satoshi got something for you !
⏰ We’re analyzing BTC on the 1-hour timeframe timeframe .
👀 On the 1-hour Bitcoin chart, after the last attempt to push toward resistance, it faced a strong rejection at $115,000 and moved toward the box's lower boundary. Currently in the alarm zone for a short position, but personally, I wouldn’t open a short here.
⚙️ Key RSI levels are 45 and 20. The 20 level is a support in the heart of oversold territory, where Bitcoin’s volatility spikes and often sees a reversal. The 45 level acts as resistance, with volatility triggering reversals upon hitting it.
🕯 Volume shows larger and more frequent red candles, with price heading toward its support levels.
💵 USDT.D broke and held above 4.27% but got rejected at 4.4%. A break and hold above 4.4% could increase selling pressure on Bitcoin.
🔔 Bitcoin’s alarm zones today aren’t very logical, so we can focus on altcoins instead. I’ll post a few altcoin picks on TradingView and the channel today.
❤️ Disclaimer : This analysis is purely based on my personal opinion and I only trade if the stated triggers are activated .

BTC 4H Analysis – Key Triggers Ahead | Day 20💀 Hey , how's it going ? Come over here — Satoshi got something for you !
⏰ We’re analyzing BTC on the 4-hour timeframe timeframe .
👀 On the 4-hour timeframe, Bitcoin is moving inside a 4H range box. The top of this box is at the $122,300 level and the bottom is at the $112,000 level. The midline of the box is around $117,000, and after touching this level the price got rejected downwards .
⚙️ On the RSI, we have two key zones: 30 and 64. When the oscillator crosses these zones, long or short trading volatility increases and the probability of entering overbought or oversold conditions rises .
🕯 On the 4H chart, the size of the buying candles has become noticeably large. After yesterday’s news, the market faced holidays and volume decreased, but with the opening of the new weekly candle, we may see an increase in trading volume. This could bring more volume into long positions .
💵 USDT.D on the 4-hour timeframe has a support at 4.19% and a resistance at 4.35%. Breaking either of these levels could inject significant volume into Bitcoin. Tether selling volume has been relatively strong and faced selling pressure, which could push this drop further .https://www.tradingview.com/x/4bTsKokC
🔔 Our trading alarm zones are placed at $117,000 and $112,000. Price action around these levels, with the start of the new week, can be strong. Selling pressure on Tether and a potential interest rate cut may shift the market sentiment toward long positions .
❤️ Disclaimer : This analysis is purely based on my personal opinion and I only trade if the stated triggers are activated .

BTC 4H Analysis – Key Triggers Ahead | Day 19💀 Hey , how's it going ? Come over here — Satoshi got something for you !
⏰ We’re analyzing BTC on the 4-hour timeframe timeframe .
👀 On the 4H timeframe of Bitcoin we observe that, after being rejected from the 115,000$ area, it is moving towards its support in the 112,000$ zone .
⚙️ We have two key areas on RSI: the support area around 30, where RSI is currently located, and the key zone for a trend change around 73, where volatility usually increases .
🕯 The size of the red candles has each time been larger than the green candles, showing stronger selling pressure .
💵 USDT.D on the 4H timeframe has resistance around the 4.46% area. If this area breaks, Bitcoin selling pressure will increase .Note that Tether dominance is close to its 4H top .
🔜 Today is the Jackson Hole event .
🔔 The alarm zone for a short position is at the 112,000$ level. If this level is lost and price action confirms, we can have a very low-risk trade. For a long position, breaking the 115,000$ area could be the start of a trend reversal .
❤️ Disclaimer : This analysis is purely based on my personal opinion and I only trade if the stated triggers are activated .

BTC 1H Analysis – Key Triggers Ahead | Day 18💀 Hey , how's it going ? Come over here — Satoshi got something for you !
⏰ We’re analyzing BTC on the 1-hour timeframe timeframe .
👀 On the 1-hour timeframe of Bitcoin, we can see that after hitting the $115,000 zone, it got rejected with a relatively strong red candle and is now moving toward its support at $112,700 .
⚙️ We have two key zones in the RSI : the support zone at 30 , and the resistance zone for long positions at 59.67. Breaking these levels can push Bitcoin toward its alarm zone and sensitive price area for a breakout .
🕯 The size of the red candles is getting smaller , showing reduced selling pressure , while the green reversal candles from $112,700 are closing larger and stronger than before .
💵 USDT.D on the 1-hour timeframe is moving toward its resistance at 4.46% , but the trend is weakening and the size of the buying candles is shrinking . In previous attempts to reach this zone, it faced rejection . If the 4.36% support level is lost , strong inflows could move into Bitcoin .
🔔 Our trading alarm zones are at $115,000 and $112,700 . These zones usually break with increased volume and volatility , and by watching price behavior there , we can find the best trading opportunities .
❤️ Disclaimer : This analysis is purely based on my personal opinion and I only trade if the stated triggers are activated .

BTC 1H Analysis – Key Triggers Ahead | Day 17💀 Hey , how's it going ? Come over here — Satoshi got something for you !
⏰ We’re analyzing BTC on the 1-hour timeframe timeframe .
👀 On the 1-hour timeframe, we can see that Bitcoin, after losing the $115,000 support zone, moved toward its next support at $113,000 .
⚙️ Our key RSI zone is 27.89, and if this level is lost, Bitcoin will face more selling pressure. The next key RSI zone is 49.74, and breaking above this level could push Bitcoin higher .
🕯 The size of the red candles has increased, and with each rise in trading volume, selling pressure grows stronger. Step by step, as supports are lost (big money in whale wallets and unrealized positions being released), Bitcoin faces heavier selling pressure .
💵 USD.D on the 1-hour timeframe is moving upward and is facing a strong resistance around 4.5%. If this resistance is broken, Bitcoin will likely come under even more selling pressure .
🔔 Our Bitcoin alert zone is set at $113,000: if this zone is broken, Bitcoin could fall to lower support levels. Our alert zone for a long trade is $115,000, and by observing price action around these two zones, we can identify the best type of trade .
❤️ Disclaimer : This analysis is purely based on my personal opinion and I only trade if the stated triggers are activated .

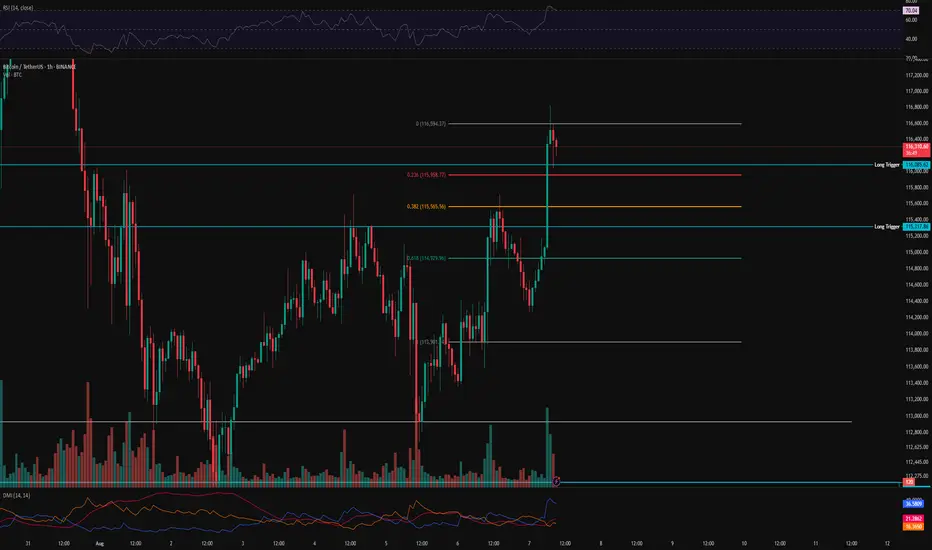
BTC 1H Analysis – Key Triggers Ahead | Day 4💀 Hey , how's it going ? Come over here — Satoshi got something for you !
⏰ We’re analyzing BTC on the 1-hour timeframe .
👀 After triggering our long entry levels , Bitcoin faced increased buying volume , and the U.S . unemployment claims came in higher than expected, which was interpreted positively for the crypto market .
🔼 With rising buying volume, Bitcoin may continue moving toward higher levels and could even aim for a new local high. Our key support zones are the same trigger levels we've been watching—these are also our ideal long entry points .
⚡️ There is a strong resistance around $117,000, where taker sellers are actively selling their Bitcoin at premium prices. In order to break through this area, we’ll need solid volume inflow from both market makers and retail buyers .
⚙️ There’s no clear RSI support zone at the moment, since on the 1-hour chart RSI is already in the Overbought area and oscillating there .
📈 Long position : Be a bit patient here . Wait for Bitcoin to pull back to key Fibonacci levels , preferably around 0.236 and 0.382, and then bounce back up . Once we break above the pullback, you can consider entering a long trade .
📉 Short position : A short setup could form only if both of our marked trigger levels get stop -hunted, combined with increased selling pressure , support breakouts , and confirmation from bearish candlestick patterns.
That said — we are not looking to short right now, as there are better opportunities to catch strong long entries .
❤️ Disclaimer : This analysis is purely based on my personal opinion and I only trade if the stated triggers are activated .