Volatility

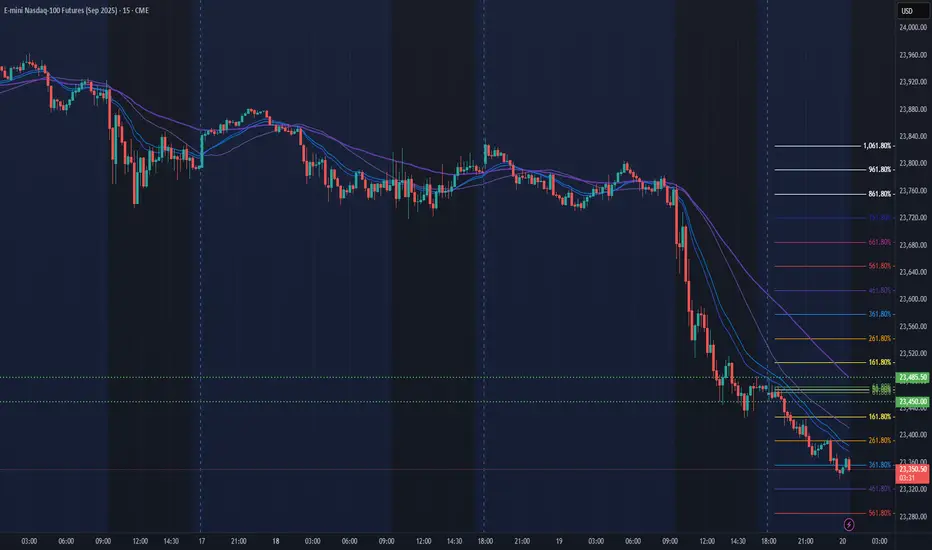
NQ Power Range Report with FIB Ext - 8/20/2025 SessionCME_MINI:NQU2025
- PR High: 23485.50
- PR Low: 23450.00
- NZ Spread: 79.5
Key scheduled economic events:
10:30 | Crude Oil Inventories
14:00 | FOMC Meeting Minutes
Session Open Stats (As of 12:35 AM 8/20)
- Session Open ATR: 282.07
- Volume: 38K
- Open Int: 287K
- Trend Grade: Long
- From BA ATH: -2.9% (Rounded)
Key Levels (Rounded - Think of these as ranges)
- Long: 24382
- Mid: 23239
- Short: 22096
Keep in mind this is not speculation or a prediction. Only a report of the Power Range with Fib extensions for target hunting. Do your DD! You determine your risk tolerance. You are fully capable of making your own decisions.
BA: Back Adjusted
BuZ/BeZ: Bull Zone / Bear Zone
NZ: Neutral Zone
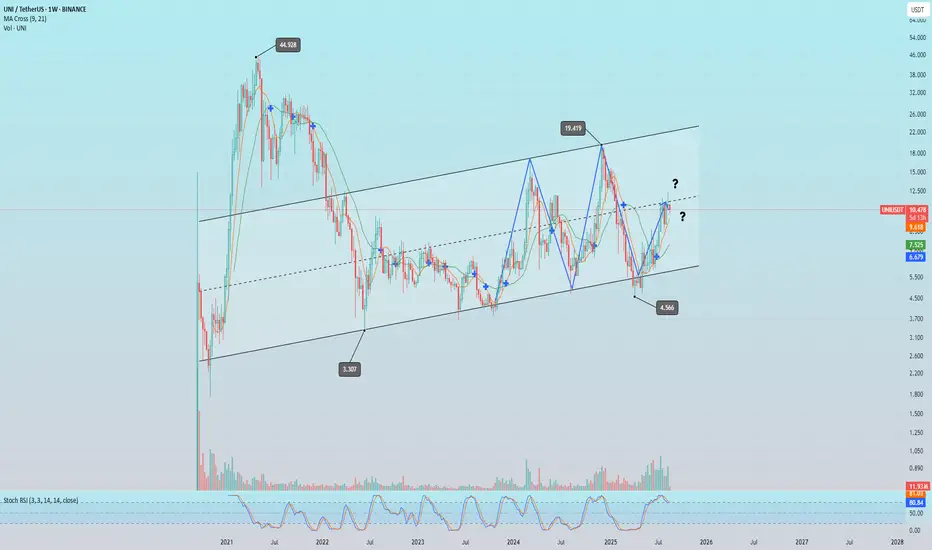
UNI. Is it all that obvious?Is everything really so obvious here and price will just move from the bottom to the top again and again?.. This is a key asset for the large-cap market and if so, you are in for the easiest trade in the markets - or is it?..
NQ Power Range Report with FIB Ext - 8/19/2025 SessionCME_MINI:NQU2025
- PR High: 23838.00
- PR Low: 23792.25
- NZ Spread: 102.25
No key scheduled economic events
Session Open Stats (As of 12:45 AM 8/19)
- Session Open ATR: 269.98
- Volume: 22K
- Open Int: 293K
- Trend Grade: Long
- From BA ATH: -1.3% (Rounded)
Key Levels (Rounded - Think of these as ranges)
- Long: 24382
- Mid: 23239
- Short: 22096
Keep in mind this is not speculation or a prediction. Only a report of the Power Range with Fib extensions for target hunting. Do your DD! You determine your risk tolerance. You are fully capable of making your own decisions.
BA: Back Adjusted
BuZ/BeZ: Bull Zone / Bear Zone
NZ: Neutral Zone
GBPUSD 4H TIMEFRAME OVERVIEW💡 Smart Money Concept (SMC) / ICT Strategy Applied
🔹 Previous analysis marked:
Accumulation zone, strong support, order block, FVG tapped, and buy/sell side liquidity are still valid reference points.
🔹 Current key points:
Price is currently around 1.3500–1.3515.
After tapping into the FVG and retesting the order block, market structure suggests a potential bearish continuation.
⚠️ Bearish scenario:
🎯 Target 1: 1.33981
🎯 Target 2: 1.32795
🎯 Target 3: 1.31437 (major support zone)
If price breaks above 1.36156, this bearish setup may become invalid.
📌 Setup leans toward short positions while monitoring liquidity sweeps and structure breaks.
This is not financial advice, just my market prediction.

NQ Power Range Report with FIB Ext - 8/18/2025 SessionCME_MINI:NQU2025
- PR High: 23853.50
- PR Low: 23795.00
- NZ Spread: 131.0
No key scheduled economic events
Session Open Stats (As of 12:25 AM 8/18)
- Session Open ATR: 277.67
- Volume: 17K
- Open Int: 291K
- Trend Grade: Long
- From BA ATH: -0.9% (Rounded)
Key Levels (Rounded - Think of these as ranges)
- Long: 24382
- Mid: 23239
- Short: 22096
Keep in mind this is not speculation or a prediction. Only a report of the Power Range with Fib extensions for target hunting. Do your DD! You determine your risk tolerance. You are fully capable of making your own decisions.
BA: Back Adjusted
BuZ/BeZ: Bull Zone / Bear Zone
NZ: Neutral Zone
SOL. 100% upside potential.If markets as a whole remains bullish, probability of this move is high. CRYPTOCAP:SOL price has been touching the middle of the channel with higher lows since May.

Ski Mask Dog | SKI | Long at $0.06Whelp... I'll leave it to the "crypto bros" to explain the value and utility of Ski Mask Dog COINEX:SKIUSDT , but Congressman Mike Collins knows something I don't. He's purchased between $10,000 and $150,000 of the alt coin between December 2024 and June 2025 at an average price of $0.08 (assuming the purchases were equally valued). Here is the reference: www.capitoltrades.com
Even if it was only $10,000 of the coin, why would he even bother given the strength of other coins... unless he knows something...
I suspect he does.
Thus, at $0.06, I just filled my wallet with a fair share and I'm going to let it ride. Pure gamble.
Targets into 2028:
$0.12 (+100.0%)
$0.25 (+316.7%)

Deep Dive Into Keltner Channel 🗓The Keltner Channel is a volatility-based technical indicator that helps traders identify market trends, breakout opportunities, and potential reversal zones. Built using an Exponential Moving Average (EMA) and the Average True Range (ATR), it adapts dynamically to price movement and provides a smoother alternative to Bollinger Bands.
📚 Introduction
The Keltner Channel is a versatile volatility-based trading indicator that helps traders identify trend direction, spot potential breakout opportunities, and determine overbought or oversold conditions.
Unlike Bollinger Bands, which use standard deviation, the Keltner Channel is built around the Average True Range (ATR), making it less reactive to sudden price spikes and better at adapting to steady market trends.
At its core, the channel consists of three lines:
Middle Line – an Exponential Moving Average (EMA) of the price
Upper Band – EMA plus a multiple of ATR
Lower Band – EMA minus the same multiple of ATR
When price stays close to the upper band, it indicates strong bullish momentum.
When price hugs the lower band, bearish pressure dominates.
Periods of narrow channel width often precede breakouts, while wide channels may signal trend exhaustion.
📚 Calculation
The Keltner Channel is typically calculated as follows:
Middle Line = EMA(n) , where n is the chosen period length (commonly 20)
Upper Band = EMA(n) + ATR(m) * Multiplier , where m is chosen period length for ATR
Lower Band = EMA(n) - ATR(m) * Multiplier , where m is chosen period length for ATR
EMA smooths price data while giving more weight to recent values. ATR measures volatility by accounting for true price ranges, including gaps. Multiplier (often 2) determines how far the bands are from the EMA.
📚 How to Use Keltner Channel in Trading Strategies
⚡️Keltner Channel Breakout Strategy
The Keltner Channel breakout strategy is built on the idea that the channel defines a normal range of price movement. The middle line reflects the average trend, while the upper and lower bands expand with volatility. Most of the time, price stays inside this range, so a close outside the channel signals unusual strength. A breakout above the upper band shows that buyers are strong enough to push price beyond what is typical, while a breakout below the lower band shows the same for sellers. This behavior suggests momentum is likely to continue, making it a potential point to join the trend.
Long Setup:
Price candle shall be closed above 200-period EMA
Candle closes above the Kelner's Upper Band, indicating strong bullish breakout
Put your trailing stop-loss at the Middle Band, close trade only when candle closes below it
Short Setup:
Price candle shall be closed below 200-period EMA
Candle closes below the Kelner's Lower Band, indicating strong bearish breakdown
Put your trailing stop-loss at the Middle Band, close trade only when candle closes above it
📈Long Trading Strategy Example
1. Price candle shall be closed above 200-period EMA. In our example we have BITMART:BTCUSDT.P 4h time frame.
2. Open long trade when price candle closed above the Keltner's Upper Band.
3. Close trade when price candle closes below the Middle Band
In our case we have 2:1 risk to reward trade if we compare initial stop loss and exit price.
📉Short trading strategy example
1. Price candle shall be closed below 200-period EMA. In our example we have BITMART:ETHUSDT.P 4h time frame.
2. Open short trade when price candle closed below the Ketlner's Lower Band.
3. Close trade when price candle closes above the Middle Band
In this case we have not a good trade. After closing short price continues dropping but then suddenly pumped and destroyed all gained profit. We think it's also important to show such trades it will make you more prepared for real market when you start trade using this strategy.
🧪 Important: as you could see stop-loss on the candle close above/below Middle Band can't be the best decision in every case. It will help you to avoid the false trade close, but usually significantly cut your profit. As always we highly recommend to make your out backtest using different trade exit approaches. You can try 3:1 RR or close exactly at the Middle Band and compare the results with provided close only approach.
⚡️Pullback to the Middle Line
The pullback-to-the-middle-line strategy focuses on the EMA at the center of the Keltner Channel, which acts as dynamic support in uptrends and resistance in downtrends. In trending markets, price often retraces to this middle line before continuing in the direction of the prevailing move.
When the EMA is sloping upward, traders look for buying opportunities when price returns to the middle line, expecting the trend to resume. In a downtrend, the EMA slopes downward, and touches of the middle line can be used as selling points.
Exits are usually made at the opposite channel band, since price tends to extend from the EMA toward one of the outer boundaries. This gives the setup a favorable risk-to-reward profile: stops are placed near the middle line or the most recent swing, while profit targets are naturally defined by the channel structure. The key is to apply the strategy only in clear, directional markets, as pullbacks lose reliability in sideways or choppy conditions.
Long Setup:
Middle Band's slope shall be upward indicating the short-term uptrend.
Open long trade when price pulled back to the Middle Band.
Put stop-loss below the Lower Band.
Take profit at the Upper Band.
Short Setup:
Middle Band's slope shall be downward indicating the short-term downtrend.
Open short trade when price pulled back to the Middle Band.
Put stop-loss above the Upper Band.
Take profit at the Lower Band.
📈Long Trading Strategy Example
1. Middle Band's slope shall be positive. We use BITMART:BTCUSDT.P 4h time frame.
2. Open long trade when the price pulled back to Middle Band.
3. Put initial stop loss at the Lower Band.
4. Take profit at the Upper Band.
📉Short trading strategy example
1. Middle Band's slope shall be negative. We use BITMART:BTCUSDT.P 4h time frame.
2. Open short trade when the price pulled back to Middle Band.
3. Put initial stop loss at the Upper Band.
4. Take profit at the Lower Band.
🧪 Important: this strategy provides high frequent fast trades with poor risk to reward. Typically it equals approximately 1:1, but this setup has the high probability to play out well. Moreover, this strategy can be used in conjunction with the strategy from point 1 described above. Conditions don't contradict to each other and can allow you to earn money on two different market conditions.
⚡️Mean Reversion Strategy
The mean reversion strategy with the Keltner Channel is based on the assumption that price tends to return toward its average after moving too far away. The outer bands of the channel serve as dynamic thresholds that help identify when the market is stretched.
When price closes near or beyond the upper band, it suggests temporary overextension to the upside, creating an opportunity to anticipate a move back toward the EMA. Conversely, when price touches or moves below the lower band, traders look for a rebound toward the middle line.
The trade idea is to enter counter to the extreme move, with exits placed around the central EMA. Stop losses are typically set just outside the channel to protect against strong breakouts. This approach works best in sideways or range-bound markets, where prices oscillate around a fair value, but it tends to underperform in strong trends.
Long Setup:
Price candle shall be closed above 200-period EMA.
Open long when price touches the Lower Band.
Put initial stop-loss according to your money management system.
Close trade the Upper Band.
Short Setup:
Price candle shall be closed below 200-period EMA.
Open short when price touches the Upper Band.
Put initial stop-loss according to your money management system.
Close trade the Lower Band.
📈Long Trading Strategy Example
1. Price candle shall be closed above 200-period EMA. In our example we have BITMART:BTCUSDT.P 4h time frame.
2. Open long at the Lower Band
3. Put stop-loss. In our case we use 2%, you can use stop-loss based on your asset/time frame volatility and money-management.
4. Take profit at the Upper Band.
📉Short trading strategy example
1. Price candle shall be closed below 200-period EMA. In our example we have BITMART:ETHUSDT.P 4h time frame.
2. Open short at the Upper Band
3. Put stop-loss. In our case we use 3%, you can use stop-loss based on your asset/time frame volatility and money-management.
4. Take profit at the Lower Band.
📚 Conclusion
The Keltner Channel is a versatile tool that adapts to different market conditions and trading styles. Whether applied as a breakout system to capture momentum, as a pullback framework to ride established trends, or as a mean reversion setup in ranging markets, it provides traders with a structured way to interpret price action. Like any strategy, its effectiveness depends on matching the approach to the prevailing market environment and applying consistent risk management. By understanding the underlying logic of each method and practicing disciplined execution, traders can make the Keltner Channel a valuable part of their technical toolkit.

$BTCUSD: Volatility Bands Extended🏛️ Research Notes
Experiment with two BSP-powered volatility bands to produce multi-scale levels.
To cover the local scope I'd use 30 for averaging both price and volatility with multiplier 2:
For broader scale I'd pick 200 with factor 7
Monitoring behavior of price near horizontal and extended angular bands.

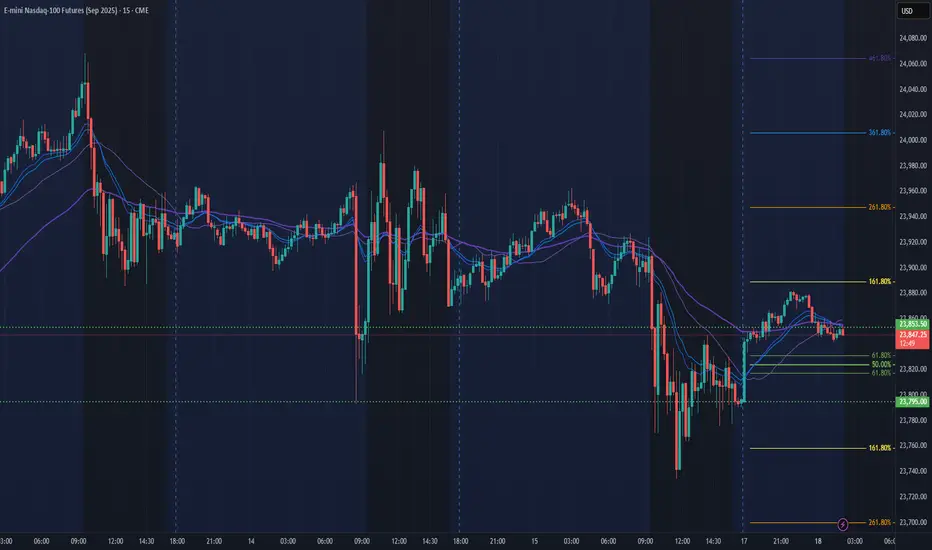
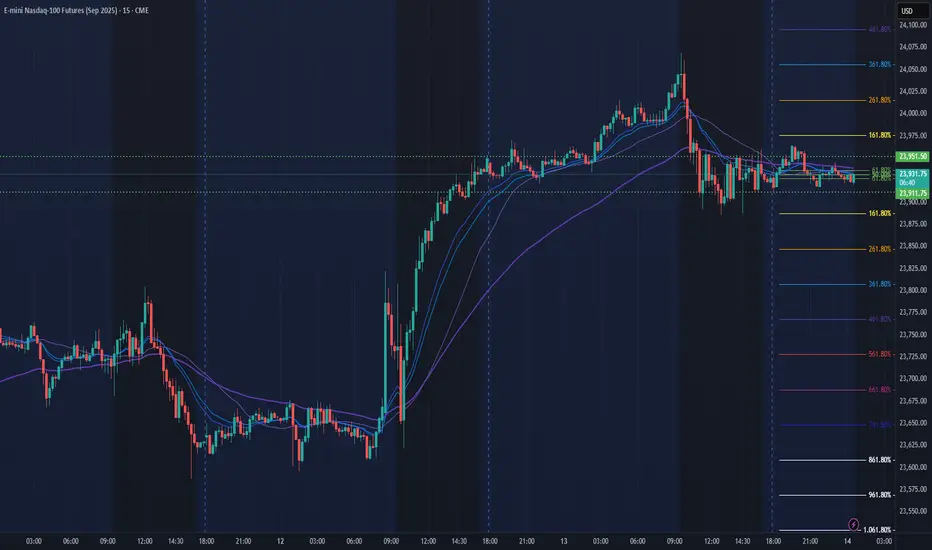
NQ Power Range Report with FIB Ext - 8/15/2025 SessionCME_MINI:NQU2025
- PR High: 23899.25
- PR Low: 23871.00
- NZ Spread: 63.25
Key scheduled economic events:
08:30 | Retail Sales (Core|MoM)
Session Open Stats (As of 12:45 AM 8/15)
- Session Open ATR: 281.42
- Volume: 17K
- Open Int: 300K
- Trend Grade: Long
- From BA ATH: -0.5% (Rounded)
Key Levels (Rounded - Think of these as ranges)
- Long: 24382
- Mid: 23239
- Short: 22096
Keep in mind this is not speculation or a prediction. Only a report of the Power Range with Fib extensions for target hunting. Do your DD! You determine your risk tolerance. You are fully capable of making your own decisions.
BA: Back Adjusted
BuZ/BeZ: Bull Zone / Bear Zone
NZ: Neutral Zone
ETHUSD Potential retrace 3800After making a High in the market I am looking for a potential buy entry around 3800.
I am not a financial advisor.
But watching the market every twice a week.

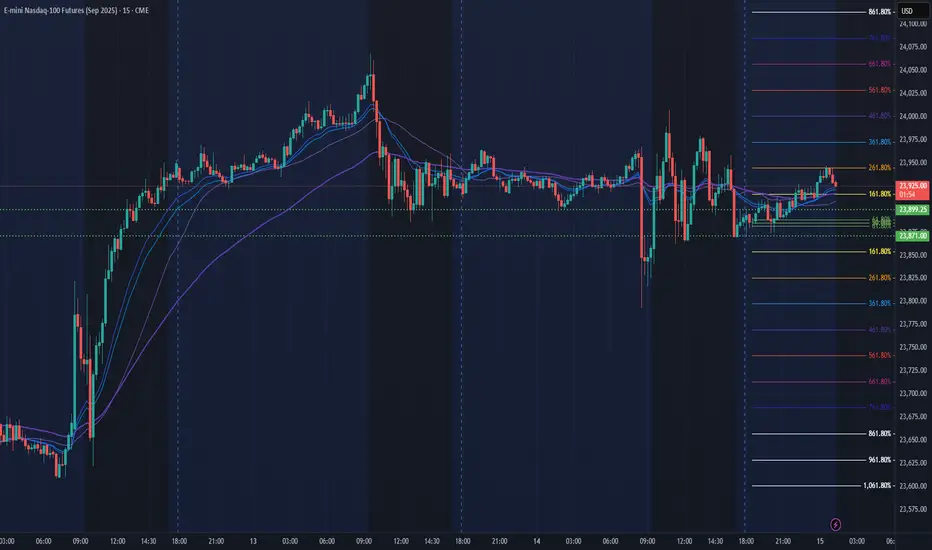
NQ Power Range Report with FIB Ext - 8/14/2025 SessionCME_MINI:NQU2025
- PR High: 23951.50
- PR Low: 23911.75
- NZ Spread: 88.75
Key scheduled economic events:
08:30 | Initial Jobless Claims
- PPI
AMP margins raised for pre-RTH expected volatility following economic news
Session Open Stats (As of 12:25 AM 8/14)
- Session Open ATR: 285.69
- Volume: 15K
- Open Int: 297K
- Trend Grade: Long
- From BA ATH: -0.5% (Rounded)
Key Levels (Rounded - Think of these as ranges)
- Long: 24382
- Mid: 23239
- Short: 22096
Keep in mind this is not speculation or a prediction. Only a report of the Power Range with Fib extensions for target hunting. Do your DD! You determine your risk tolerance. You are fully capable of making your own decisions.
BA: Back Adjusted
BuZ/BeZ: Bull Zone / Bear Zone
NZ: Neutral Zone
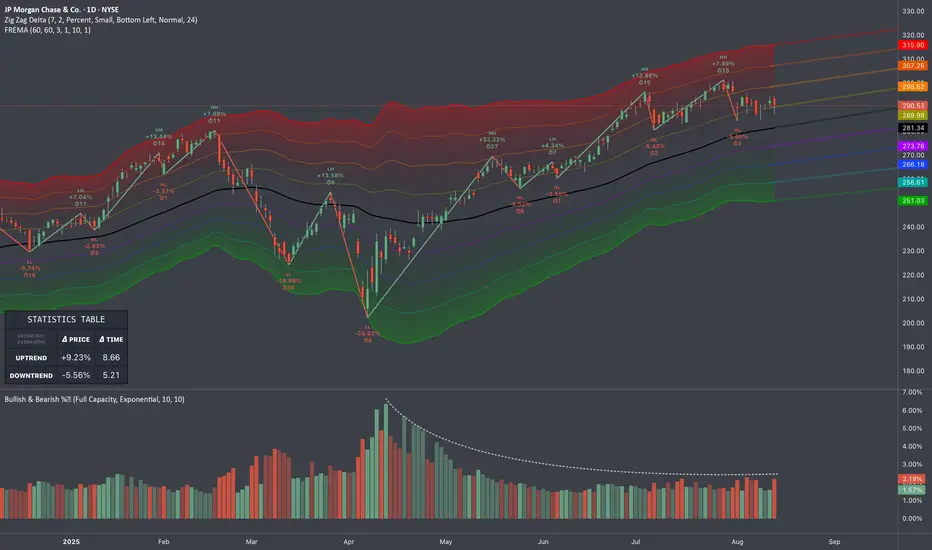
JPM: Mean Reversion (FREMA)🏛️ Research Notes
Already looks mature to me
Conditional averaging of percentage change shows weakening bullish momentum
Testing FREMA as an indicator for mean reversion, where I will look for deviations from the average and anticipate a price movement back towards that mean. The bands were extended to cover the a distorted outcome.
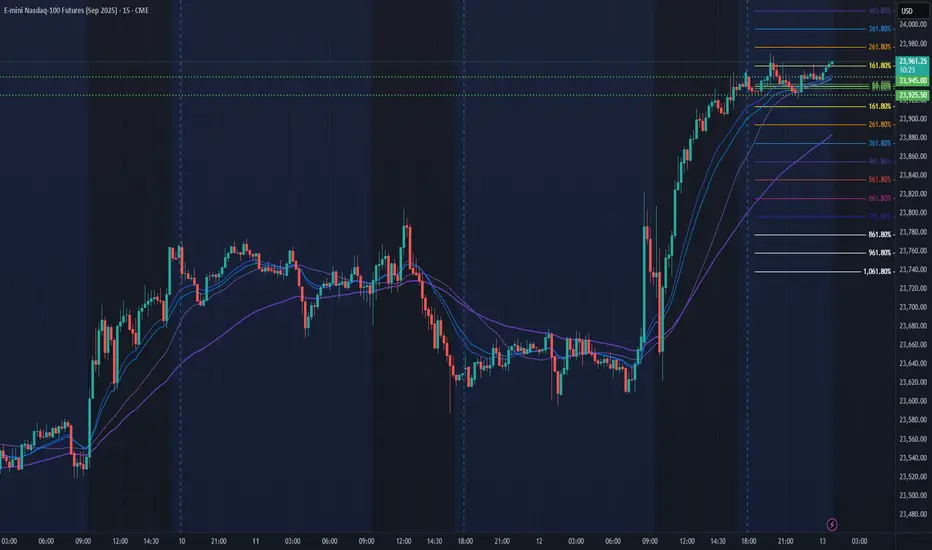
NQ Power Range Report with FIB Ext - 8/13/2025 SessionCME_MINI:NQU2025
- PR High: 23945.00
- PR Low: 23925.50
- NZ Spread: 43.5
Key scheduled economic events:
10:30 | Crude Oil Inventories
ATH climb continues
Session Open Stats (As of 12:25 AM 8/13)
- Session Open ATR: 294.04
- Volume: 21K
- Open Int: 302K
- Trend Grade: Long
- From BA ATH: -0.0% (Rounded)
Key Levels (Rounded - Think of these as ranges)
- Long: 23811
- Mid: 22096
- Short: 20383
Keep in mind this is not speculation or a prediction. Only a report of the Power Range with Fib extensions for target hunting. Do your DD! You determine your risk tolerance. You are fully capable of making your own decisions.
BA: Back Adjusted
BuZ/BeZ: Bull Zone / Bear Zone
NZ: Neutral Zone
GBPUSD – Hourly Head & Shoulders in PlaySpotting a potential head and shoulders pattern on the GBPUSD hourly chart.
I’m still waiting for confirmation before entering the trade.
Trade Setup:
Risk/Reward: 3.4
Entry: 1.34433
Stop Loss: 1.34645
Take Profit 1 (50%): 1.33822
Take Profit 2 (50%): 1.33603
On the higher time frame, price is also testing diagonal resistance — adding extra confluence to the short bias.
For now, it’s a waiting game to see if the pattern confirms.
💡 Trading Tip: Nobody knows for certain where the market will go — always predefine your risk before entering a trade.
Please note: This is not financial advice. This content is to track my trading journey and for educational purposes only.

NQ Power Range Report with FIB Ext - 8/12/2025 SessionCME_MINI:NQU2025
- PR High: 23650.00
- PR Low: 23614.50
- NZ Spread: 79.5
Key scheduled economic events:
08:30 | CPI (Core|MoM|YoY)
Temp AMP margins increase for expected economic news volatility
Session Open Stats (As of 12:35 AM 8/12)
- Session Open ATR: 291.18
- Volume: 17K
- Open Int: 290K
- Trend Grade: Long
- From BA ATH: -0.7% (Rounded)
Key Levels (Rounded - Think of these as ranges)
- Long: 23811
- Mid: 22096
- Short: 20383
Keep in mind this is not speculation or a prediction. Only a report of the Power Range with Fib extensions for target hunting. Do your DD! You determine your risk tolerance. You are fully capable of making your own decisions.
BA: Back Adjusted
BuZ/BeZ: Bull Zone / Bear Zone
NZ: Neutral Zone
NQ Power Range Report with FIB Ext - 8/11/2025 SessionCME_MINI:NQU2025
- PR High: 23770.75
- PR Low: 23725.00
- NZ Spread: 102.25
No key scheduled economic events
Session Open Stats (As of 12:35 AM 8/11)
- Session Open ATR: 299.17
- Volume: 27K
- Open Int: 291K
- Trend Grade: Long
- From BA ATH: -0.3% (Rounded)
Key Levels (Rounded - Think of these as ranges)
- Long: 23811
- Mid: 22096
- Short: 20383
Keep in mind this is not speculation or a prediction. Only a report of the Power Range with Fib extensions for target hunting. Do your DD! You determine your risk tolerance. You are fully capable of making your own decisions.
BA: Back Adjusted
BuZ/BeZ: Bull Zone / Bear Zone
NZ: Neutral Zone
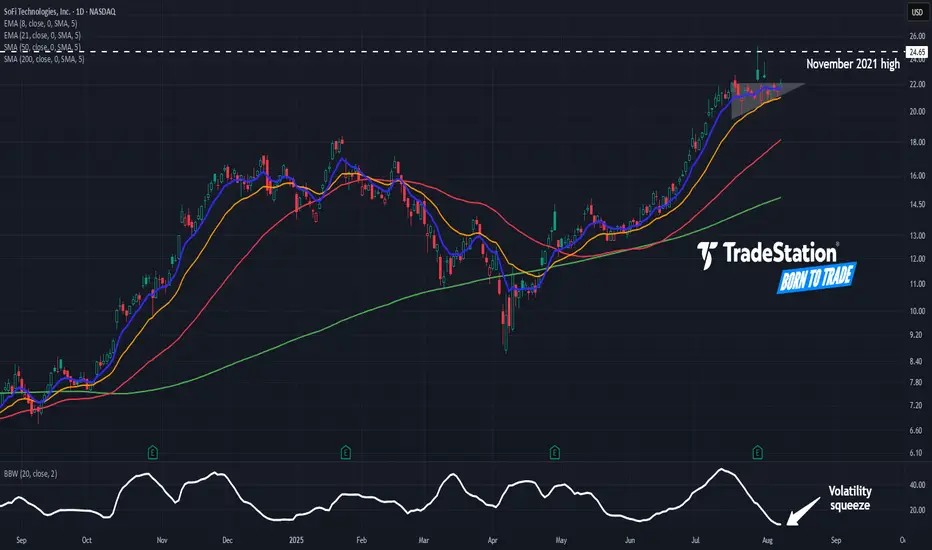
SoFi: Ascending TriangleSoFi Technologies rallied sharply in June and early July. Now, after a pause, some traders may see further upside.
The first item on today’s chart is the July 17 close of $22.09. The financial stock has remained mostly trapped below that level while making higher lows. The resulting ascending triangle is a potentially bullish continuation pattern.
Second, Bollinger Band Width has narrowed to its lowest reading since June 2024. Such tight consolidation may reflect a lack of selling pressure.
Third, the 8-day exponential moving average (EMA) has remained above the 21-day EMA. That may reflect bullishness in the short term.
Next, prices are consolidating below previous record highs from 2021. (The peaks then ranged from $24.65 to $28.26.) Could the stock challenge its old highs?
Finally, SOFI is an active underlier in the options market. Its average volume of 411,000 contracts would rank 11th in the S&P 500 (if it were a member), according to TradeStation data. That could help traders take positions with calls and puts.
TradeStation has, for decades, advanced the trading industry, providing access to stocks, options and futures. If you're born to trade, we could be for you. See our Overview for more.
Past performance, whether actual or indicated by historical tests of strategies, is no guarantee of future performance or success. There is a possibility that you may sustain a loss equal to or greater than your entire investment regardless of which asset class you trade (equities, options or futures); therefore, you should not invest or risk money that you cannot afford to lose. Online trading is not suitable for all investors. View the document titled Characteristics and Risks of Standardized Options at www.TradeStation.com . Before trading any asset class, customers must read the relevant risk disclosure statements on www.TradeStation.com . System access and trade placement and execution may be delayed or fail due to market volatility and volume, quote delays, system and software errors, Internet traffic, outages and other factors.
Securities and futures trading is offered to self-directed customers by TradeStation Securities, Inc., a broker-dealer registered with the Securities and Exchange Commission and a futures commission merchant licensed with the Commodity Futures Trading Commission). TradeStation Securities is a member of the Financial Industry Regulatory Authority, the National Futures Association, and a number of exchanges.
Options trading is not suitable for all investors. Your TradeStation Securities’ account application to trade options will be considered and approved or disapproved based on all relevant factors, including your trading experience. See www.TradeStation.com . Visit www.TradeStation.com for full details on the costs and fees associated with options.
Margin trading involves risks, and it is important that you fully understand those risks before trading on margin. The Margin Disclosure Statement outlines many of those risks, including that you can lose more funds than you deposit in your margin account; your brokerage firm can force the sale of securities in your account; your brokerage firm can sell your securities without contacting you; and you are not entitled to an extension of time on a margin call. Review the Margin Disclosure Statement at www.TradeStation.com .
TradeStation Securities, Inc. and TradeStation Technologies, Inc. are each wholly owned subsidiaries of TradeStation Group, Inc., both operating, and providing products and services, under the TradeStation brand and trademark. When applying for, or purchasing, accounts, subscriptions, products and services, it is important that you know which company you will be dealing with. Visit www.TradeStation.com for further important information explaining what this means.

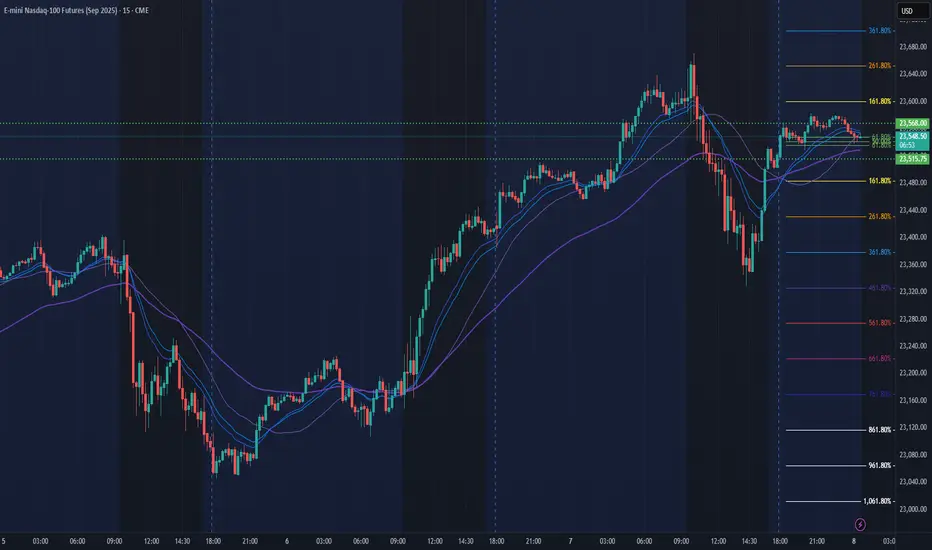
NQ Power Range Report with FIB Ext - 8/8/2025 SessionCME_MINI:NQU2025
- PR High: 23568.00
- PR Low: 23516.00
- NZ Spread: 116.5
No key scheduled economic events
Session Open Stats (As of 12:35 AM 8/8)
- Session Open ATR: 302.51
- Volume: 22K
- Open Int: 282K
- Trend Grade: Long
- From BA ATH: -1.1% (Rounded)
Key Levels (Rounded - Think of these as ranges)
- Long: 23811
- Mid: 22096
- Short: 20383
Keep in mind this is not speculation or a prediction. Only a report of the Power Range with Fib extensions for target hunting. Do your DD! You determine your risk tolerance. You are fully capable of making your own decisions.
BA: Back Adjusted
BuZ/BeZ: Bull Zone / Bear Zone
NZ: Neutral Zone
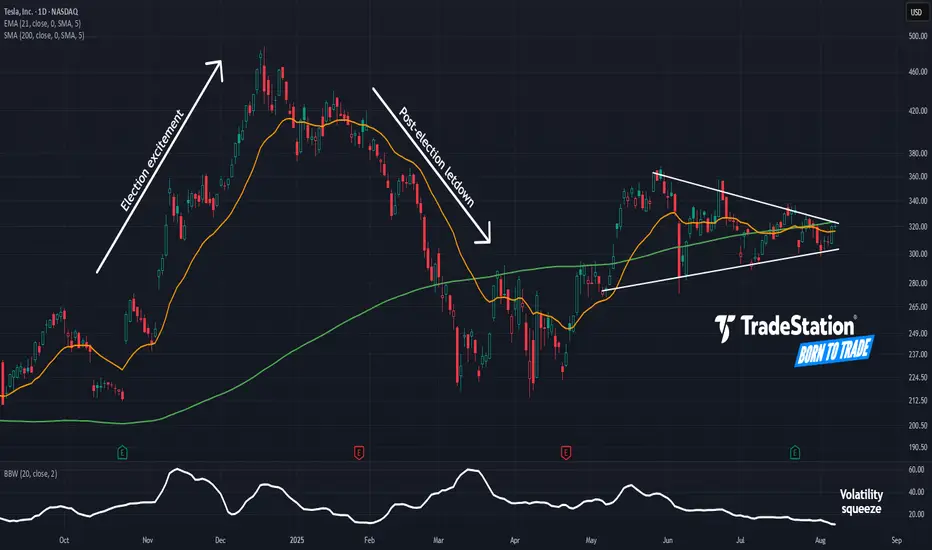
Tight Squeeze in TeslaTesla rallied sharply in late 2024, followed by a drop in the first quarter. Now, after a long period of consolidation, some traders may think the EV maker is getting ready to move again.
The first pattern on today’s chart is the series of higher lows and lower highs since May. That converging triangle may give TSLA breakout potential.
Second, Bollinger Bandwidth has squeezed to a 13-month low. Will that price compression give way to expansion?
Third, the rising 200-day simple moving average may suggest a longer-term uptrend remains in effect.
Next, prices are trying to push above the 21-day exponential moving average. That may be consistent with increasing bullishness in the short term.
Finally, TSLA is a highly active underlier in the options market. (Its average daily volume of 2.3 million contracts ranks behind only Nvidia in the S&P 500, according to TradeStation data.) That may help traders take positions with calls and puts.
TradeStation has, for decades, advanced the trading industry, providing access to stocks, options and futures. If you're born to trade, we could be for you. See our Overview for more.
Past performance, whether actual or indicated by historical tests of strategies, is no guarantee of future performance or success. There is a possibility that you may sustain a loss equal to or greater than your entire investment regardless of which asset class you trade (equities, options or futures); therefore, you should not invest or risk money that you cannot afford to lose. Online trading is not suitable for all investors. View the document titled Characteristics and Risks of Standardized Options at www.TradeStation.com . Before trading any asset class, customers must read the relevant risk disclosure statements on www.TradeStation.com . System access and trade placement and execution may be delayed or fail due to market volatility and volume, quote delays, system and software errors, Internet traffic, outages and other factors.
Securities and futures trading is offered to self-directed customers by TradeStation Securities, Inc., a broker-dealer registered with the Securities and Exchange Commission and a futures commission merchant licensed with the Commodity Futures Trading Commission). TradeStation Securities is a member of the Financial Industry Regulatory Authority, the National Futures Association, and a number of exchanges.
Options trading is not suitable for all investors. Your TradeStation Securities’ account application to trade options will be considered and approved or disapproved based on all relevant factors, including your trading experience. See www.TradeStation.com . Visit www.TradeStation.com for full details on the costs and fees associated with options.
Margin trading involves risks, and it is important that you fully understand those risks before trading on margin. The Margin Disclosure Statement outlines many of those risks, including that you can lose more funds than you deposit in your margin account; your brokerage firm can force the sale of securities in your account; your brokerage firm can sell your securities without contacting you; and you are not entitled to an extension of time on a margin call. Review the Margin Disclosure Statement at www.TradeStation.com .
TradeStation Securities, Inc. and TradeStation Technologies, Inc. are each wholly owned subsidiaries of TradeStation Group, Inc., both operating, and providing products and services, under the TradeStation brand and trademark. When applying for, or purchasing, accounts, subscriptions, products and services, it is important that you know which company you will be dealing with. Visit www.TradeStation.com for further important information explaining what this means.
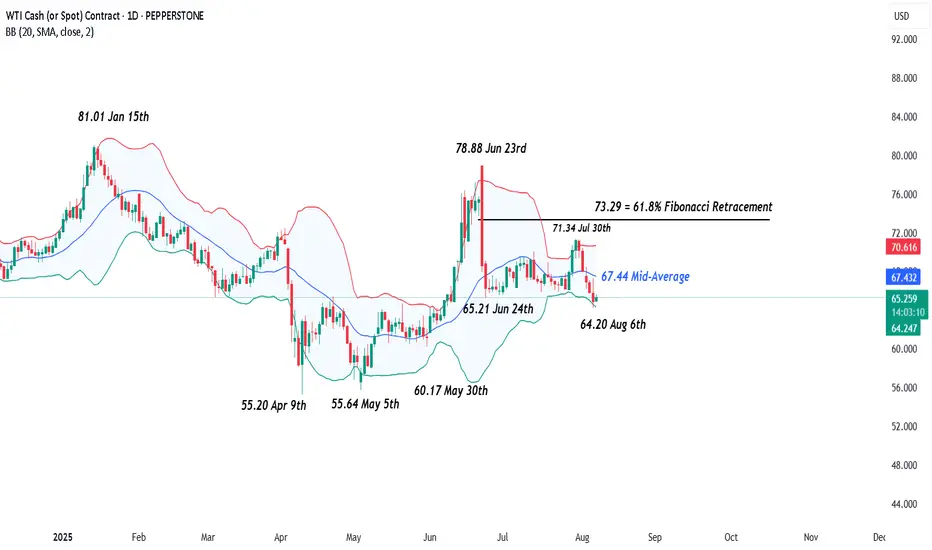
Could Oil (WTI) Be Breaking Out of its Range?Oil (WTI) has moved back to the forefront of traders thinking this week after OPEC+’s weekend decision to raise September production by circa 550k barrels per day. They also put traders on notice that all options remain open regarding further production increases to replace another output layer, amounting to 1.66 million barrels per day that has been offline since 2023. A decision on what comes next is due to take place at a meeting scheduled for September 7th.
Perhaps unsurprisingly, this potential for extra production (supply) being unleashed into the market later in the year has led to some downside pressure for Oil this week. This is because it comes at a time of uncertainty surrounding Oil demand due to possible weaknesses in the global economy, created by President Trump’s tariff policies. Oil (WTI) prices have fallen 4.8% from opening levels on Monday to post a new 1 month low at 64.20 yesterday, a level that it currently holding (more on this in technical update below).
Looking forward, one of the challenges traders are facing for where Oil moves next is President Trump’s August 8th deadline for Russia to end the war with Ukraine or face fresh sanctions on its energy exports. President Trump has also suggested he would increase tariffs on countries buying Oil from Russia, including China, although right now India is his initial focal point in this regard and yesterday, he doubled tariffs on Indian goods (25% to 50%) due to the country’s purchases of Russian Oil. These new tariffs are due to start in 3 weeks’ time.
With so much uncertainty surrounding Oil prices, including reports of a possible meeting between President Trump and President Putin being scheduled at some stage next week, it could be useful to be prepared for a potential increase in Oil (WTI) price volatility.
Technical Update: New Correction Lows Posted
Having seen the sharp sell-off in Oil between June 23rd and 24th 2025, a period of more balanced activity developed, as a reaction to over-extended downside conditions in price.
As the chart above shows, this resulted in a phase of sideways price activity between support marked by the 65.21 June 24th low, up to 71.34, which is equal to the July 30th failure high. However, price declines on Wednesday this week, have produced closes below 65.21, in the process of posting a new correction low at 64.20.
While communications between the US and Russia regarding the war in Ukraine are on-going, this type of break lower in the Oil price is no guarantee of future declines, so it could be helpful to assess what could be the potential support and resistance levels to focus on, just in case the outcome of these events lead to an increase in Oil price volatility.
Possible Next Support Levels:
As we have said above, the August 6th price weakness has seen a new correction low posted at 64.20, and this may now be viewed as the first support focus. Closes below 64.20 might then lead to a more extended decline in price.
Such moves would indicate the potential of further price weakness, with the next support possibly marked by the May 30th session low at 60.17, perhaps further towards 55.64 (May 5th low), if this level in turn gives way.
Potential Resistance Levels:
On the topside, within a period of price weakness, it can be the declining Bollinger mid-average that reflects the first possible resistance, and for Oil this currently stands at 67.44. Closing breaks above 67.44, if seen, could prompt further attempts to develop price strength to test higher resistance levels.
The first possible level would appear to be marked by 71.34, which is the July 30th session high. If this level was broken on a closing basis, it might then lead to tests of 73.29, which is equal to the 61.8% Fibonacci retracement of the June 23rd to June 24th sell-off.
The material provided here has not been prepared accordance with legal requirements designed to promote the independence of investment research and as such is considered to be a marketing communication. Whilst it is not subject to any prohibition on dealing ahead of the dissemination of investment research, we will not seek to take any advantage before providing it to our clients.
Pepperstone doesn’t represent that the material provided here is accurate, current or complete, and therefore shouldn’t be relied upon as such. The information, whether from a third party or not, isn’t to be considered as a recommendation; or an offer to buy or sell; or the solicitation of an offer to buy or sell any security, financial product or instrument; or to participate in any particular trading strategy. It does not take into account readers’ financial situation or investment objectives. We advise any readers of this content to seek their own advice. Without the approval of Pepperstone, reproduction or redistribution of this information isn’t permitted.