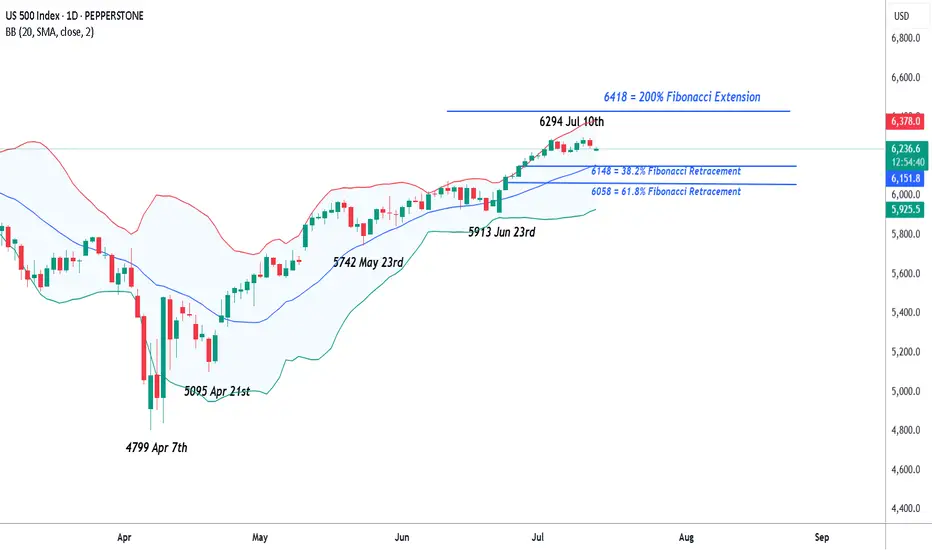
US 500 – A New Record Peak or Reversal in the Week AheadSo far in July, the US 500 has recorded multiple all-time highs on its way to an eventual peak of 6294 on Thursday (July 10th), from which it finally succumbed to some profit taking into the weekend, leading to a small Friday sell off to close at 6255 (-0.4%).
Along the way traders have ignored mixed US economic data, and more importantly they have, for the most part, shrugged off President Trump’s increasingly aggressive approach to tariffs, choosing instead to focus on economic resilience, renewed AI optimism and an improving outlook for the Q2 corporate earnings season that kicks fully into gear in the coming days.
In terms of tariffs, the fact that there is now a new August 1st deadline to concentrate on may be taking away some of the immediate urgency for the announcement of trade deals, although these issues still remain important and on-going, highlighted by President Trump's weekend social media announcement of 30% tariffs on the EU and Mexico, if a better deal cant be reached in the next 3 weeks.
With regard to corporate earnings, the major US banks like JP Morgan (Tuesday before the open) and Bank of America (Wednesday before the open) report this week. Both company’s share prices have seen strong gains since the April lows, so traders will be eagerly awaiting their actual numbers. They will also be keen to hear the thoughts of the bank CEOs on future earnings, bad debt provisions and the potential impact of Trump’s tariffs on the US economy moving forward. Only last week, Jamie Dimon, CEO of JP Morgan, warned market complacency towards potential tariff risks.
In terms of scheduled economic data. Tuesday’s US CPI (1330 BST) and Wednesday’s PPI release (1330 BST) stand out. Traders are sensitive to US inflation updates and have been watching over the last several months for signs that tariffs are pushing up prices. So far this hasn’t been the case but these new releases may tell a different story.
All of these issues could impact risk sentiment and the direction of the US 500 index in the next 5 trading days. Certainly, the early open has been impacted by President Trump's weekend tariff announcement, with the US 500 currently down 0.46% at 6227 (0800 BST).
The technical outlook could also be an important factor in determining price moves.
Technical Update: Assessing the Move to A New Record High
Last week appears to have seen a slowing in the speed of the recent price strength, but a new all-time high was still posted at 6294 on Thursday. It could be argued that this activity maintains what is still a more constructive pattern of higher price highs and higher price lows that have materialised since the April 7th downside extreme of 4799.
However, there is no guarantee this price activity will continue to see new all-time highs posted, so we need to be aware of potential support and resistance levels that may influence price activity.
Possible Support Levels:
If last week’s possible slowing in upside price momentum develops into a new phase of price weakness, a support level that traders might now be watching could be 6148.
This 6148 level is equal to both the 38.2% Fibonacci retracement of June 23rd to July 10th strength and the current level of the rising Bollinger mid-average. Closes below 6148 might suggest a more extended phase of weakness back to 6058, the lower 61.8% Fibonacci retracement, possibly further if this in turn gives way.
Possible Resistance Levels:
Having been capped by the 6294 all-time high last week, sellers may continue to be found at this level, so this might prove to be the first potential resistance if fresh attempts at price strength over the coming week develop.
Closing defence of 6294 may need to be watched if challenged, as successful breaks above this level might suggest an extension of the uptrend pattern currently evident in price activity. Such closing breaks higher may well suggest price strength towards 6418, the 200% Fibonacci extension level of the recent price decline.
The material provided here has not been prepared accordance with legal requirements designed to promote the independence of investment research and as such is considered to be a marketing communication. Whilst it is not subject to any prohibition on dealing ahead of the dissemination of investment research, we will not seek to take any advantage before providing it to our clients.
Pepperstone doesn’t represent that the material provided here is accurate, current or complete, and therefore shouldn’t be relied upon as such. The information, whether from a third party or not, isn’t to be considered as a recommendation; or an offer to buy or sell; or the solicitation of an offer to buy or sell any security, financial product or instrument; or to participate in any particular trading strategy. It does not take into account readers’ financial situation or investment objectives. We advise any readers of this content to seek their own advice. Without the approval of Pepperstone, reproduction or redistribution of this information isn’t permitted.
Volatility
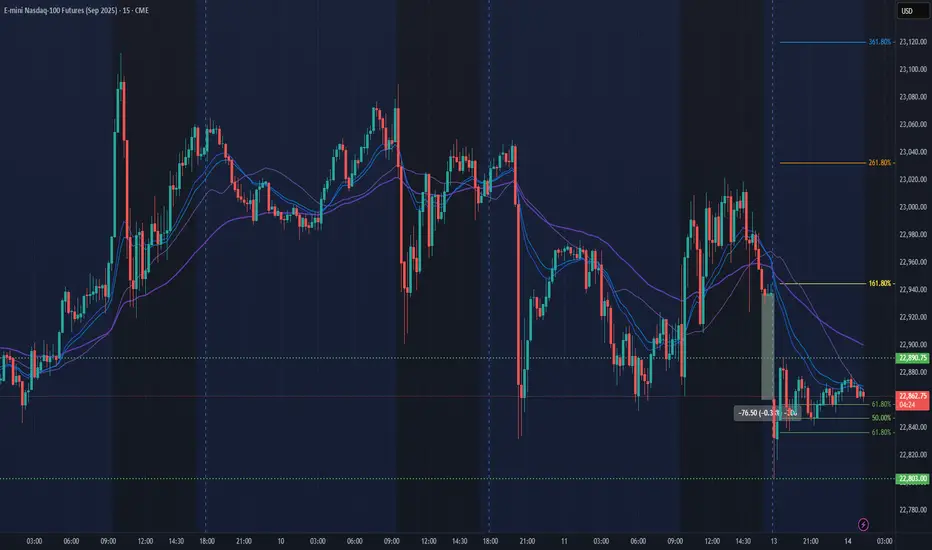
NQ Power Range Report with FIB Ext - 7/14/2025 SessionCME_MINI:NQU2025
- PR High: 22890.50
- PR Low: 22803.00
- NZ Spread: 195.0
No key scheduled economic events
0.33% weekend gap to previous week low, unfilled
Session Open Stats (As of 1:15 AM 7/14)
- Session Open ATR: 289.88
- Volume: 36K
- Open Int: 270K
- Trend Grade: Neutral
- From BA ATH: -1.0% (Rounded)
Key Levels (Rounded - Think of these as ranges)
- Long: 23239
- Mid: 21525
- Short: 20383
Keep in mind this is not speculation or a prediction. Only a report of the Power Range with Fib extensions for target hunting. Do your DD! You determine your risk tolerance. You are fully capable of making your own decisions.
BA: Back Adjusted
BuZ/BeZ: Bull Zone / Bear Zone
NZ: Neutral Zone
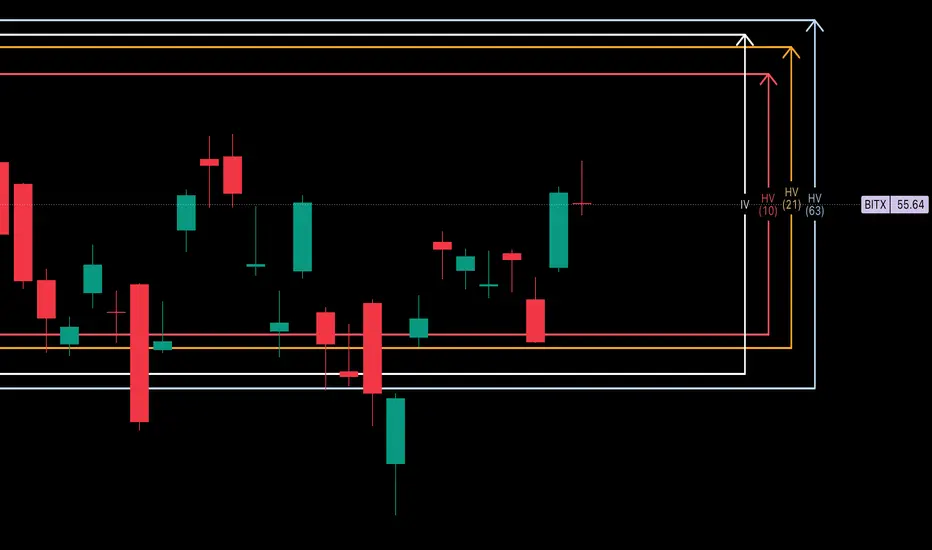
BITx -- Weekly Volatility SnapshotHello Bitcoin community 🤠👾🤑👾🤠
Good morning/Good afternoon, maybe goodnight to you pending where you are in the world!
Nonetheless, I'm glad you found me because here we are going to look over our weekly historical volatility ranges on CBOE:BITX and assess where IV is in perspective to what's trending. Then we will talk targets within my custom adjusted implied weekly ranges.
Entering the week, IV (76.86%) is projecting +17.74% more than what short-term trending markets are showing with HV10 (59.12%) holding a 'strength of IV' of only 76.91%. This is a price differential on the week of -$1.19. Our monthly values with HV21 (71.20%) are hinged slightly below IV, showing a 'strength of IV' slightly more at 92.64%.
In my opinion looking towards this week, IV may be painting the bigger picture of price distribution upwards towards quarterly trends. It is expansive from past weeks and above short-term trending markets with a wider range and with IV percentile slowly creeping up.
If the trend holds that started last week, my price target will be HV63 at $61.07 which draws confluence with the correction impulse wave top of $60.39 -- a price action to implied calculation difference of only +/-$0.69. Fantastic , right?!? This would take BTC approaching new ATHs again. If price action can find quarterly trends we will be seeing a 'strength of IV' of 108.44% -- only slight advantageous over IV premium.
In the end, markets are unpredictably wild and we can only assess and reduce our risk using the tools provided. Always remember your ABCs and to hedge your bias! Come back next week as we recap how the weekly volatility unfolded.
Cheers!
AAPL - Weekly HV/IV PerspectiveGood evening —
I wanted to do one more write up with that being on NASDAQ:AAPL as we enter the week with futures just opening.
HV10 (16.58%) is trending -11.56% below IV (28.14%) showing a weekly price gap differential of -$2.89 on the stated implied move to what trending markets are doing. This current IV value entering the week sits 69% within the sliding year spectrum.
Now, with Apple consolidating in range for almost eight weeks after selling off when it reached its 4T milestone in December of 2024, has now begun advancing back upwards in price. The strength here is obvious and the quality of company is well, Apple.
My price targets on the week is first the upper band of stated IV ($220.58) then moving on towards the upper implied range of HV63 ($225.87). I believe the markets are going to push apple higher while balancing the indices out selling off in other areas. This would start to accelerate HV10, as it is now 91.23% coiled to its yearly lows and needs to unwind. Hopefully with a few short-term trending days increasing we find our regression.
Please come back next week and see how our position and volatility progressed forward.

Weekly Volatility SnapshotGood Evening -- Happy July 4th to everyone
Let us review last week as we look towards the next in anticipation of the trade deal deadline that looms. I had a target on the SP:SPX of $6,253.59 and the weekly high was $6,284.65. The candle on the short week opened at its low of $6,019.21 and closed $6,233.08 making the weekly range +$213.87. This represents closest to HV63 over IV which stated +/-$253.26 and a 'strength of IV' that was 295% . Again the weekly high is above our range target, but my volatility will always be measured close-to-close.
Now as we look towards this week --
IV (13.85%) has shifted upwards slightly with HV10 (7.36%) hinged down and still lowering. In fact, I have bi-weekly volatility as 97.28% 'coiled' to it's sliding yearly low of 4.64% -- HV21 (9.92%) is closer to what IV states with it being 'coiled' 96.61% to it's respective sliding yearly lows.
In my opinion, volatility still has room to consolidate slightly as markets rotate higher. I think we can see upwards $6,327.73, but slowly over the course of the week with the last tariff uncertainty getting out of the way. From there, going into mid July we may need to see a volatility spike. The HV10 range I am watching holds a 'strength of IV' entering this week of only 53% -- this shows the price per move is expensive by almost twice as much.
Till next time, know your ABCs, have a great long weekend, and stay hedge!
CHEERS

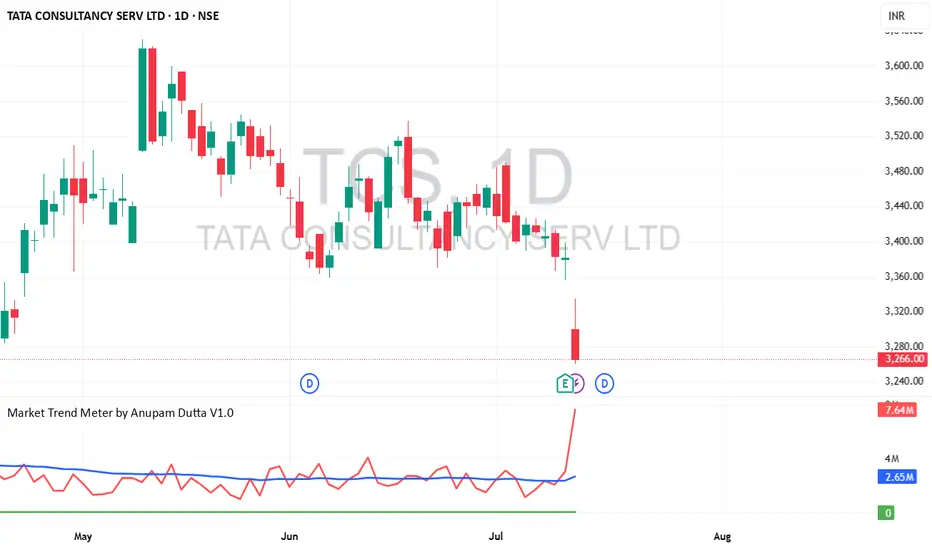
TCS Long Opportunity - Medium-Term Swing Trade📈 TCS Long Opportunity – Medium-Term Swing Trade
🔹 Entry : ₹3266 (Last Close)
🔹 Target : ₹3525
🔹 Qty : Up to 25 shares
🔹 Timeframe : ~6 months
🔹 Estimated ROI : ~16.49% annualized
A moderate-risk swing setup on Tata Consultancy Services . Technically and fundamentally aligned for gradual upside, assuming market conditions stay favorable. Entry near current levels with a well-defined target.
⚠️ Trade only if you're comfortable with the risk of capital loss. Position sizing is key.
CL1! Short Setup – Fading Into Volume Shelf📉 CL1! Short Setup – Fading Into Volume Shelf
🔹 Context:
Price just tapped into a heavy upper volume shelf (68.35–68.50) — the exact area where the prior breakdown started. This zone aligns with rejection highs and the upper edge of the VRVP profile.
📌 Setup Logic:
🔺 Entry: 68.36–68.50 (into supply zone)
⛔ Stop: 68.75 (above liquidity peak)
🎯 Target: 66.78 (prior demand + volume node)
📐 RRR: ~4.0:1
⚠️ Trigger: Do not enter early — wait for rollover of price which it looks like we are getting now.
📊 Why It Matters:
📈 VRVP shows clear upper and lower volume shelves
📛 Price has overextended into a prior rejection zone
🔁 Potential for a mean-reversion leg once we confirm momentum breakdown
📷 See attached chart for full zone layout
🧠 Let me know if you’re entering or watching this one 👇
#CrudeOil #CL1 #FuturesTrading #VolumeProfile #SciQua #OrderFlow

TSLA, Long, 1D✅ TSLA has just broken out of a clear symmetrical triangle pattern, signaling a potential bullish continuation.
Yesterday’s daily candle was a white Marubozu, indicating strong buying pressure and clear dominance by the bulls.
LONG 📈
✅ Like and subscribe to never miss a new technical analysis! ✅

NQ Power Range Report with FIB Ext - 7/11/2025 SessionCME_MINI:NQU2025
- PR High: 23039.75
- PR Low: 23004.50
- NZ Spread: 78.75
No key scheduled economic events
High 200+ range volatility during Asian hours
Session Open Stats (As of 1:35 AM 7/11)
- Session Open ATR: 301.79
- Volume: 48K
- Open Int: 268K
- Trend Grade: Neutral
- From BA ATH: -0.6% (Rounded)
Key Levels (Rounded - Think of these as ranges)
- Long: 23239
- Mid: 21525
- Short: 20383
Keep in mind this is not speculation or a prediction. Only a report of the Power Range with Fib extensions for target hunting. Do your DD! You determine your risk tolerance. You are fully capable of making your own decisions.
BA: Back Adjusted
BuZ/BeZ: Bull Zone / Bear Zone
NZ: Neutral Zone

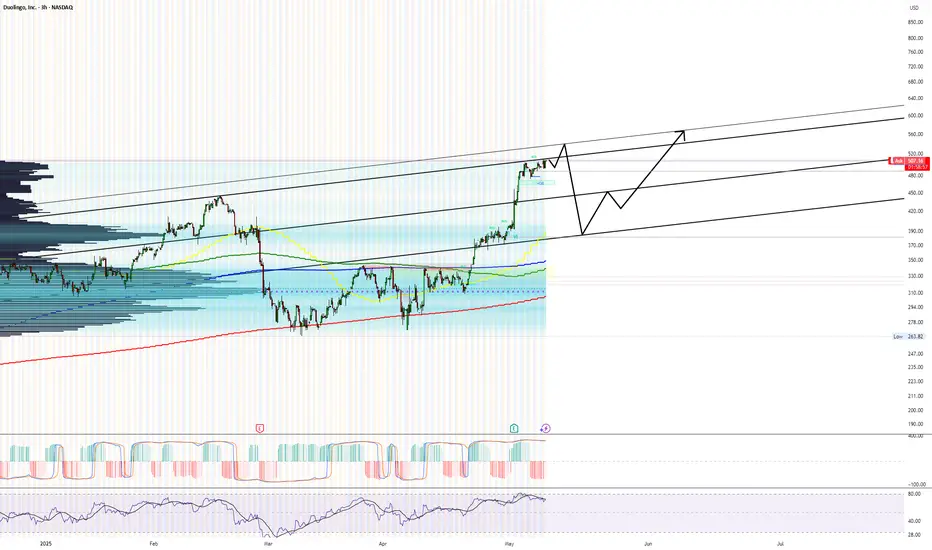
Its A Prime Set Up Guys, May 13th May 13th there will be a press conference with the CEO I think.
All techinals show a sharp fall will occur soon and I bet its the 13th.
Reached the top of the trend line and we are very over extended. Ying and a yang, time for the yang.
See my price path for a rough guess.
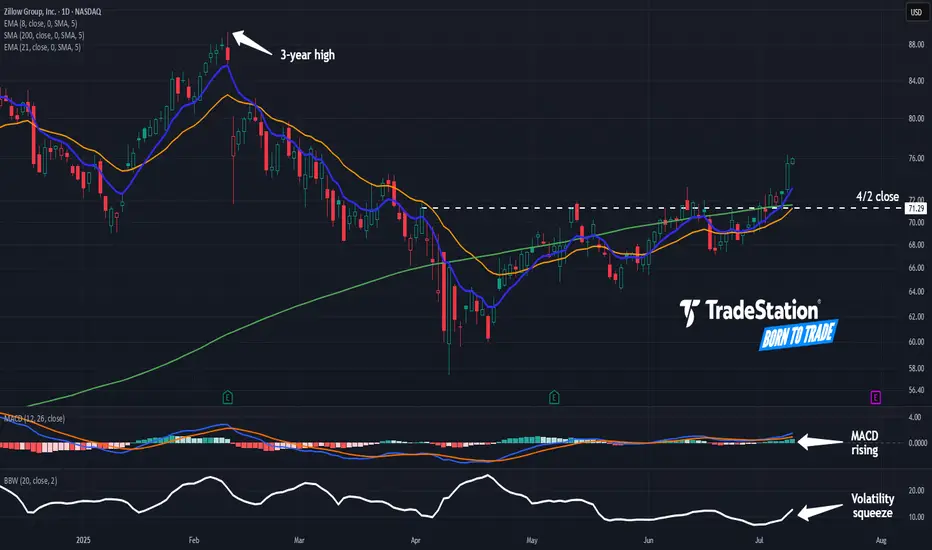
Zillow May Be Coming to LifeZillow has been in a tight range for months, but now it may be coming to life.
The first pattern on today’s chart is the April 2 close of $71.29. Z closed above it last week and is extending the move, which may confirm a breakout.
Second, prices pushed above the rising 200-day simple moving average. That may reflect a bullish long-term trend in the housing tech stock.
Third, the 8-day exponential moving average (EMA) is above the 21-day EMA. MACD is also rising. Those signals may be consistent with short-term bullishness.
Finally, Bollinger Band Width hit a two-year low last week. Could that price compression give rise to expansion?
Check out TradingView's The Leap competition sponsored by TradeStation.
TradeStation has, for decades, advanced the trading industry, providing access to stocks, options and futures. If you're born to trade, we could be for you. See our Overview for more.
Past performance, whether actual or indicated by historical tests of strategies, is no guarantee of future performance or success. There is a possibility that you may sustain a loss equal to or greater than your entire investment regardless of which asset class you trade (equities, options or futures); therefore, you should not invest or risk money that you cannot afford to lose. Online trading is not suitable for all investors. View the document titled Characteristics and Risks of Standardized Options at www.TradeStation.com . Before trading any asset class, customers must read the relevant risk disclosure statements on www.TradeStation.com . System access and trade placement and execution may be delayed or fail due to market volatility and volume, quote delays, system and software errors, Internet traffic, outages and other factors.
Securities and futures trading is offered to self-directed customers by TradeStation Securities, Inc., a broker-dealer registered with the Securities and Exchange Commission and a futures commission merchant licensed with the Commodity Futures Trading Commission). TradeStation Securities is a member of the Financial Industry Regulatory Authority, the National Futures Association, and a number of exchanges.
Options trading is not suitable for all investors. Your TradeStation Securities’ account application to trade options will be considered and approved or disapproved based on all relevant factors, including your trading experience. See www.TradeStation.com . Visit www.TradeStation.com for full details on the costs and fees associated with options.
Margin trading involves risks, and it is important that you fully understand those risks before trading on margin. The Margin Disclosure Statement outlines many of those risks, including that you can lose more funds than you deposit in your margin account; your brokerage firm can force the sale of securities in your account; your brokerage firm can sell your securities without contacting you; and you are not entitled to an extension of time on a margin call. Review the Margin Disclosure Statement at www.TradeStation.com .
TradeStation Securities, Inc. and TradeStation Technologies, Inc. are each wholly owned subsidiaries of TradeStation Group, Inc., both operating, and providing products and services, under the TradeStation brand and trademark. When applying for, or purchasing, accounts, subscriptions, products and services, it is important that you know which company you will be dealing with. Visit www.TradeStation.com for further important information explaining what this means.
NQ Power Range Report with FIB Ext - 7/10/2025 SessionNQ Power Range Report with FIB Ext - 7/10/2025 Session
CME_MINI:NQU2025
- PR High: 23065.25
- PR Low: 23033.25
- NZ Spread: 71.5
Key scheduled economic events:
08:30 | Initial Jobless Claims
13:00 | 30-Year Bond Auction
Session Open Stats (As of 12:35 AM 7/10)
- Session Open ATR: 300.61
- Volume: 20K
- Open Int: 270K
- Trend Grade: Neutral
- From BA ATH: -0.4% (Rounded)
Key Levels (Rounded - Think of these as ranges)
- Long: 23239
- Mid: 21525
- Short: 20383
Keep in mind this is not speculation or a prediction. Only a report of the Power Range with Fib extensions for target hunting. Do your DD! You determine your risk tolerance. You are fully capable of making your own decisions.
BA: Back Adjusted
BuZ/BeZ: Bull Zone / Bear Zone
NZ: Neutral Zone

ETH Just Reached the Floor — This Is the Starting Line.This isn’t hopium, it’s structure.
Using my custom 4 EMA setup, you can see how ETH spent weeks coiling around the thickest dark purple line which I treat as the macro floor. ETH dropped below it briefly, retested it, and now we’re reclaiming that level again.
Whenever these EMAs start to compress and flatten, we usually get sideways chop, pressure build, breakout.
Zoom out and you’ll notice:
• We’re not extended.
• We’re not overbought.
• We’re not in price discovery.
We’re just getting back to the floor after compression.
If this is the top, it’s doing a great job pretending it’s still early.

AAVE prepares for the back-test
After a sharp decline, AAVE formed a textbook spring, signaling that strong buying demand has returned to the market.
The recent bullish leg appears to have completed a 5-wave impulse structure (H4 timeframe), suggesting a high probability that a corrective phase may follow.
Currently, EURONEXT:AAVE is testing the resistance boundary of its ascending channel. I’m looking for signs of an upthrust here, with two primary scenarios in mind:
Scenario 1: If the recent surge to $300 is confirmed as an upthrust, we could see a mild correction back to the $279 area for a support back-test—possibly forming a secondary spring within the rising channel (lower probability).
Scenario 2: If price wicks above $300 but then reverses, I anticipate a back-test at $289, which could set the stage for a new rally to break ATHs (targeting $325) and potentially reach the $370 area.
RSI is approaching overbought territory, but there’s no clear sign of a reversal yet. It’s crucial to watch for divergence signals at this stage.
Key Points:
AAVE is in a strong bullish phase, but a short-term pullback to retest the $279–$289 support zone could offer the optimal entry for the next leg up.
Risk management first: Keep stops tight below $275 to protect capital.

NQ Power Range Report with FIB Ext - 7/9/2025 SessionCME_MINI:NQU2025
- PR High: 22923.00
- PR Low: 22900.50
- NZ Spread: 50.5
Key scheduled economic events:
10:30 | Crude Oil Inventories
13:00 | 10-Year Note Auction
14:00 | FOMC Meeting Minutes
Session Open Stats (As of 12:25 AM 7/9)
- Session Open ATR: 303.33
- Volume: 16K
- Open Int: 270K
- Trend Grade: Neutral
- From BA ATH: -0.8% (Rounded)
Key Levels (Rounded - Think of these as ranges)
- Long: 23239
- Mid: 21525
- Short: 20383
Keep in mind this is not speculation or a prediction. Only a report of the Power Range with Fib extensions for target hunting. Do your DD! You determine your risk tolerance. You are fully capable of making your own decisions.
BA: Back Adjusted
BuZ/BeZ: Bull Zone / Bear Zone
NZ: Neutral Zone

NASDAQ 100 – Is Upside Momentum Still Evident?Tough talk on tariffs at the back end of last week and over the weekend from President Trump ahead of his 90 day pause deadline, which is due to end tomorrow (July 9th), helped to put a small dent in trader sentiment, slightly undermining the recent strong upside momentum seen in the US 100 index.
This led to a sell off from fresh all time highs of 22908 registered on July 3rd to a low of 22600 yesterday evening, as the letters sent by the US administration outlining import tariffs of 25% sent to Japan, South Korea and another 12 nations were unveiled.
However, the moves have been relatively muted since then as traders remain optimistic that there is still time for negotiation to agree trade deals given that the new tariffs won’t go into effect until August 1st, providing a potential further 3 weeks to move things along.
Looking forward, in a relatively quiet week for data and central bank speakers, the next moves in the US 100 index towards the Friday close may be dictated by updates on trade deals between the US and EU, and the US and India, both of which have been reported as moving closer to agreement. Technical trends could also be an important factor.
Technical Update: Is Upside Momentum Still Evident?
Future tariff news has the potential to continue to be a very important sentiment driver for global equities, particularly within the tech sector, which the US 100 index reflects within its constituents.
As a result, it can be useful to assess potential support and resistance levels within the US 100 index that traders may be focusing on to gauge the next possible direction for prices.
Possible Resistance Levels:
Since posting the April 2025 low at 16290, the US 100 index has rallied by over 40% in only a 13-week period. While this has reflected positive sentiment during this time, traders may well now be questioning if this upside momentum can continue, or if it might stall, even leading to price weakness.
As such, being aware of potential resistance levels against which to judge current price strength that might be able to hold and possibly reverse this latest activity back to the downside, may prove important.
Having previously been strong enough to hold recent price strength, the 22908 July 3rd all-time high, may now represent an area where sellers can be found again, and as such, this marks a potential first resistance focus.
However, closing breaks above 22908 might suggest a more extended phase of price strength, with traders then possibly looking to 23429, the upper weekly Bollinger band and on breaks above this, even towards 24482, which is equal to the 38.2% Fibonacci extension of the February to April 2025 price decline, as the next resistance levels.
Possible Support Levels:
Of course, just because a 40% advance in prices has been seen, doesn’t guarantee it will continue and traders may be trying to focus on support levels that if broken on a closing basis over the coming days, might suggest risks of a more extended decline in price.
Looking at the daily chart above, it might be suggested that the first support is currently represented by 22201, the level of the rising Bollinger mid-average. Closing breaks below 22201 could in turn lead to further price declines to test 22053, the 38.2% Fibonacci retracement of May 23rd to July 3rd price strength, even 21787, the deeper 50% retracement.
The material provided here has not been prepared accordance with legal requirements designed to promote the independence of investment research and as such is considered to be a marketing communication. Whilst it is not subject to any prohibition on dealing ahead of the dissemination of investment research, we will not seek to take any advantage before providing it to our clients.
Pepperstone doesn’t represent that the material provided here is accurate, current or complete, and therefore shouldn’t be relied upon as such. The information, whether from a third party or not, isn’t to be considered as a recommendation; or an offer to buy or sell; or the solicitation of an offer to buy or sell any security, financial product or instrument; or to participate in any particular trading strategy. It does not take into account readers’ financial situation or investment objectives. We advise any readers of this content to seek their own advice. Without the approval of Pepperstone, reproduction or redistribution of this information isn’t permitted.

NQ Power Range Report with FIB Ext - 7/8/2025 SessionCME_MINI:NQU2025
- PR High: 22853.50
- PR Low: 22808.50
- NZ Spread: 100.5
No key scheduled economic events
Session Open Stats (As of 12:25 AM 7/8)
- Session Open ATR: 318.85
- Volume: 24K
- Open Int: 269K
- Trend Grade: Neutral
- From BA ATH: -0.8% (Rounded)
Key Levels (Rounded - Think of these as ranges)
- Long: 23239
- Mid: 21525
- Short: 20383
Keep in mind this is not speculation or a prediction. Only a report of the Power Range with Fib extensions for target hunting. Do your DD! You determine your risk tolerance. You are fully capable of making your own decisions.
BA: Back Adjusted
BuZ/BeZ: Bull Zone / Bear Zone
NZ: Neutral Zone

06/30 Weekly Gamma Exposure Outlook🧠 SPX Weekly Outlook — Gamma Breakout + Short Week Setup
The bulls finally broke through after weeks of painful grinding — and they did so with force.
📈 Thursday & Friday brought a textbook gamma squeeze as SPX sliced through the long-standing 6100 call wall , triggering sharp upside acceleration.
We are now firmly in positive Net GEX territory.
🔺 Entire GEX structure has shifted higher.
🎯 New squeeze zone at 6225 , with major call resistance near 6200 .
🔍 What Just Happened?
📊 The 6060–6120 zone acted as a tough resistance range for weeks — until last week’s breakout.
💥 Put skew collapsed , suggesting downside hedges are being unwound.
📉 VIX and IV keep dropping , confirming a shift toward lower-volatility environment .
🧲 Strong Net GEX across expiries created sustained upward dealer pressure → we’re in long gamma mode .
✅ Bullish Bias — But Stay Tactical
We're in a bullish gamma regime , so dips are likely to be bought.
Key pullback zone to watch: 6125–6060 .
🛠️ Strategy Ideas:
• Wait for a 6060–6125 retest before re-entering longs
• Use shorter-DTE bull put spreads or 0DTE gamma scalps above 6130+
• Scale out or trim risk near 6200–6225
⚠️ Risks to Watch
We’re overextended short-term.
🚨 Losing 6130–6125 could spark a quick flush to 6050 .
Bearish signals to monitor:
• IV spike or renewed put buying
• Loss of 6100 = no-man’s land without confirmation
• Consider short-term debit put spreads if breakdown confirms
🗓️ Short Trading Week Note
🇺🇸 U.S. markets closed Friday, July 5 for Independence Day.
This compresses flows into 4 sessions. Expect:
📌 Early week dealer hedging
📌 Possible positioning unwind on Thursday
💡 Weekly Trade Idea — Structure in Place
💼 Setup:
• Put Butterfly below spot
• 3x Call Diagonal Spreads above spot (5pt wide)
• Slight net negative delta , 11 DTE
🎯 Why it works:
• Leverages IV backwardation
• Profits from time decay
• Favors a stable or modestly bullish week
• Takes advantage of horizontal skew (July 11 vs July 14)
💰 Profit Target: 10–20% return on ~$1,730 risk.
Take profits before time decay kills the center valley — don’t overstay. 🏃💨
📌 Final Thoughts:
The 6100 breakout was technically & gamma-structurally significant ,
but big moves often retest before continuing.
Let price breathe.
Stay aligned with gamma exposure profile. 🔄

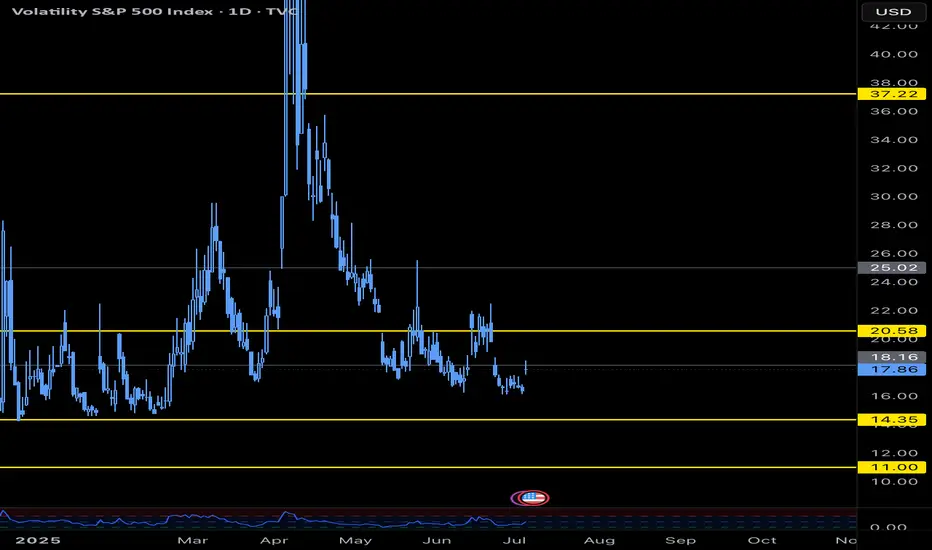
VIX Hits Key Level as S&P 500 Breaks Out – What’s Next?I keep a close eye on VIX levels that consistently matter — and one of those was just tagged:
📍 VIX levels I watch:
11.00 | 14.35 | 18.16 | 20.58 | 37.22
Today, we spiked up to 18.16 and stalled. This is my "in-between" level — not major, but notable — and we’re already seeing volatility slow right at that point.
Meanwhile, the S&P 500 ( SP:SPX ) has broken out to fresh all-time highs.
What I’m watching now:
➜ Will VIX stay below 20.58 and compress further?
➜ Does SPX hold the breakout into early July?
➜Could this set the tone for a melt-up summer?
July’s first half is historically up and a mixed bag in the back half, but the price action and volatility narrative could give us the edge. July is the best month of Q3 traditionally (institutions). Stay focused on the close and the VIX response.
#VIX #SP500 #SPX #volatility #macro #tradingview #DisciplineTrading
Keysight May Be Attempting a BreakoutKeysight Technologies has been stuck in a range, but some traders may think a breakout is coming.
The first pattern on today’s chart is the $165.89 level. It was the intraday high on February 26 as the broader market began a slide to the downside. The technology stock stalled near the same level in late May, even after a strong quarterly report.
KEYS ended above it on Thursday, July 3. It was the highest weekly close since February. (The stock also formed a bullish outside candle.)
Bollinger Band Width narrowed during the period of limited movement. Could that price compression give way to expansion?
Next, the 8-day exponential moving average (EMA) is above the 21-day EMA. Prices have also found support above the 200-day simple moving average, which is gently rising. Those signals may reflect bullishness in the short- and long-term periods.
Finally, KEYS noted increased demand for its network-testing equipment as data centers grow. Could investors come to view it as an overlooked AI play?
Check out TradingView's The Leap competition sponsored by TradeStation.
TradeStation has, for decades, advanced the trading industry, providing access to stocks, options and futures. If you're born to trade, we could be for you. See our Overview for more.
Past performance, whether actual or indicated by historical tests of strategies, is no guarantee of future performance or success. There is a possibility that you may sustain a loss equal to or greater than your entire investment regardless of which asset class you trade (equities, options or futures); therefore, you should not invest or risk money that you cannot afford to lose. Online trading is not suitable for all investors. View the document titled Characteristics and Risks of Standardized Options at www.TradeStation.com . Before trading any asset class, customers must read the relevant risk disclosure statements on www.TradeStation.com . System access and trade placement and execution may be delayed or fail due to market volatility and volume, quote delays, system and software errors, Internet traffic, outages and other factors.
Securities and futures trading is offered to self-directed customers by TradeStation Securities, Inc., a broker-dealer registered with the Securities and Exchange Commission and a futures commission merchant licensed with the Commodity Futures Trading Commission). TradeStation Securities is a member of the Financial Industry Regulatory Authority, the National Futures Association, and a number of exchanges.
TradeStation Securities, Inc. and TradeStation Technologies, Inc. are each wholly owned subsidiaries of TradeStation Group, Inc., both operating, and providing products and services, under the TradeStation brand and trademark. When applying for, or purchasing, accounts, subscriptions, products and services, it is important that you know which company you will be dealing with. Visit www.TradeStation.com for further important information explaining what this means.

NQ Power Range Report with FIB Ext - 7/7/2025 SessionCME_MINI:NQU2025
- PR High: 23028.50
- PR Low: 22943.00
- NZ Spread: 191.25
No key scheduled economic events
First full trading day following long holiday weekend
Session Open Stats (As of 12:45 AM 7/7)
- Session Open ATR: 323.71
- Volume: 33K
- Open Int: 271K
- Trend Grade: Neutral
- From BA ATH: -0.6% (Rounded)
Key Levels (Rounded - Think of these as ranges)
- Long: 23239
- Mid: 21525
- Short: 20383
Keep in mind this is not speculation or a prediction. Only a report of the Power Range with Fib extensions for target hunting. Do your DD! You determine your risk tolerance. You are fully capable of making your own decisions.
BA: Back Adjusted
BuZ/BeZ: Bull Zone / Bear Zone
NZ: Neutral Zone

Weekly Volatility SnapshotGood Morning -- ☀️☀️☀️
What an amazing last full week of June that was as we pulled out of corrective territory and onto new ATHs with the SP:SPX body of its weekly candle moving +3.41% -- bottom to top. The weekly move open-to-close was +$98.40 as that is how I gauge my volatility metrics. This in comparison is closest in value to IV entering the week as it was stating an implied move of +/-$102.08, which was a volatility read of 16.34% -- As you see in reflection of the weekly chart below and within daily candle structure, price action moved upwards all week surpassing quarterly marks. This in turn is raising short-term volatility and lowering monthly averages as we rotate higher.
Here is the weekly price action of the TVC:VIX from a 5m perspective. This is showing the EOW trend break upwards drilling the indices back down -- A healthy pullback after being seemingly over-extended. This happened during the news cycle release of the U.S. and Canada reciprocal tariff disagreement. Hopefully this settles over the weekend and we rotate higher into the 4th of July week.
Now looking towards this holiday week -- We have the SP:SPX IV (13.29%) after melting during the ATHs move previously -3.09% -- This places IV on the sliding yearly spectrum at the 39% down range showing increasing discount in yearly value. Remember, If you form option positions IV affects VEGA 1% at a time and the algos bid down IV in contracting markets as they rotate higher. HV10 (12.46%) has hinged down and still is contractive per IV prediction but, increasing in comparison with a ' strength of IV ' now showing 94% entering this week.
As the TVC:VIX has closed at $16.32 -- I believe that there is still a little room to extend potentially upwards to the HV10 weekly range of $6253.59. Currently, the SP:SPX YTD return is +4.96% with weekly momentum pointing up and room for volatility to still decrease. If this mark is reached it would put the YTD return at +6.52%. Very feasible and realistic being halfway through the year and going into the 4th of July 🇺🇸🇺🇸🇺🇸🇺🇸 Watch as we climb the wall of worries around us. This would in turn decrease short-term volatility more maybe even to a bottoming point and IV would melt during the rotation upwards with the VIX slowly grinding down.
Come back next week as we review what happened within the implied ranges posted and overlook the volatility potentially bottoming and looking towards a VIX spike in the near future.
Remember to know your ABCs and stay hedged against your bias! CHEERS!

Nat Gas; Dip then RipA slight breather as expected for NG prices after such a strong reversal, from the storage report lows on 6/27/2025. Support for NG based on volume looks to be in the $3.55 to $3.65 range, before continuing a move up to $4+. NYMEX:NG1!
