1D Investment Long CounterTrend TradeCounterTrend Trade
- short impulse
+ support level
- unvolumed T1 level
+ below 1/2 correction?!
+ historical volume zone
+ biggest volume 2Sp-
+ weak test
Calculated affordable virtual stop loss
1 to 2 R/R take profit
Monthly CounterTrend
"- short impulse
+ exhaustion volume
+ broken SOS
+ intiative take over"
Yearly no context
Volumespreadanalysis

B Short 1H Aggressive CounterTrend TradeAggressive CounterTrend Trade
- long impulse
+ biggest volume T1
+ exhaustion volume
+ resistance level
+ biggest volume Ut
+ weak test
- below first bullish bar close entry
Calculated affordable virtual stop loss
1 to 2 R/R take profit
1D CounterTrend
"- long imluse
- neutral zone
- volume distribution long
+ exhaustion volume"
1M CounterTrend
"- long impulse
+ volumed interaction bar"
1Y countertrend
"- long impulse
+ volumed T1 level
+ resistance level"

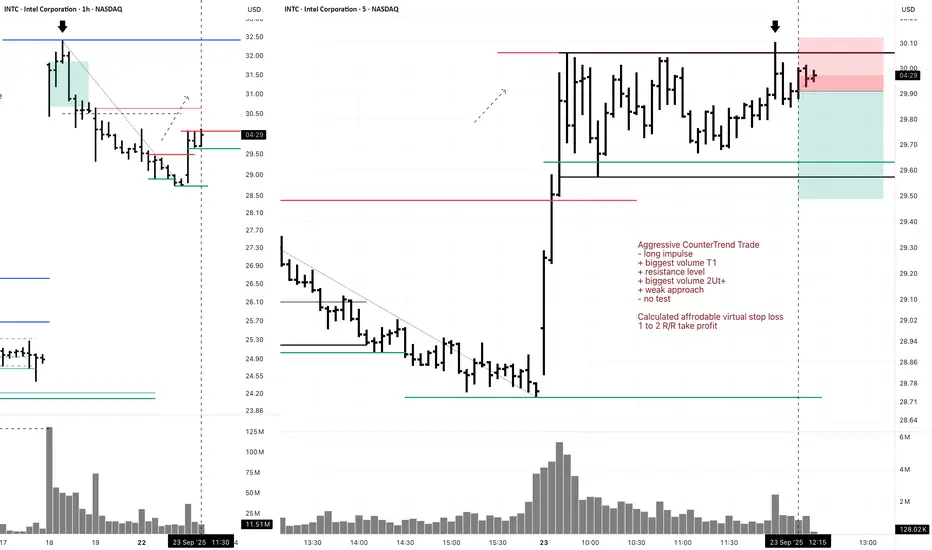
INTC Short 5M Aggressive CounterTrend Day TradeAggressive CounterTrend Trade
- long impulse
+ biggest volume T1
+ resistance level
+ biggest volume 2Ut+
+ weak approach
- no test
Calculated affordable virtual stop loss
1 to 2 R/R take profit
1H CounterTrend
"- long impulse
+ T1 level
+ resistance level
+ 1/2 correction?"
1D CounterTrend
";- long impulse
+ expanding CREEK / TE
+ exhaustion volume
- too high
+ correction to 1/2"
1M Trend
"+ short impulse
+ T2 level
+ resistance level
+ 1/2 correction"
1Y CounterTrend
"- long impulse
+ correction
- 1/2 of impulse
- biggest volume"
TGKA 5M Long Aggressive CounterTrend DayTradeAggressive CounterTrend Trade
- short impulse
+ biggest volume T1
+ volumed 2Sp+ ?
- T2 level
- resistance level
Calculated affordable virtual stop loss
1 to 2 R/R expandable to swing take profit
1H CounterTrend
"- short impulse
+ biggest volume T1
+ support level
+ volumed interaction bar
- reaction bar went lower"
1D Trend
"+ long impulse
+ biggest volume expanding T2 level
+ support level
+ below 1/2 correction
+ volumed interaction bar"
1Y no context

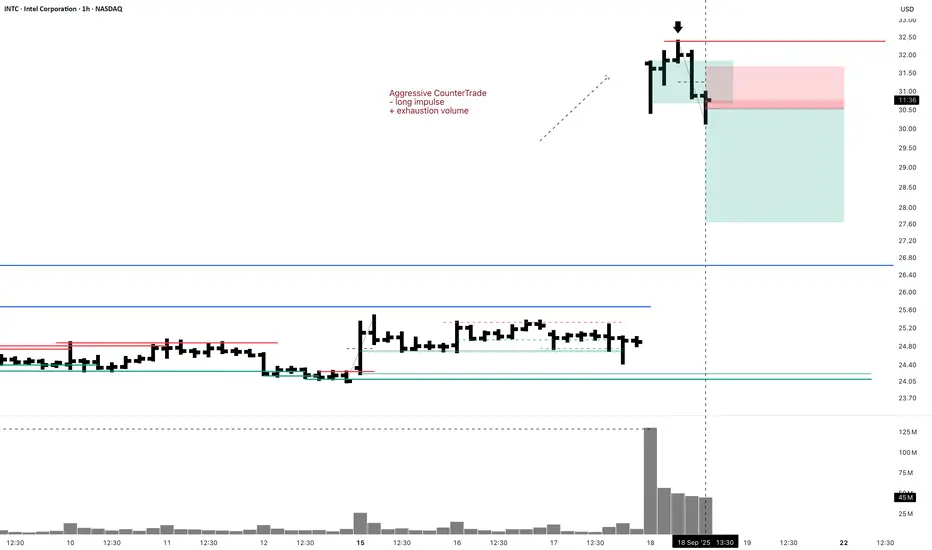
INTC Short Swing 1H Aggressive CounterTradeAggressive CounterTrade
- long impulse
+ exhaustion volume
Daily CounterTrend
"- long impulse
+ expanding CREEK level
+ exhaustion volume
+ too high"
Monthly Trend
"+ short impulse
+ T2 level
+ resistance level
+ 1/2 correction"
Yearly Trend
"- long impulse
+ correction
- 1/2 of impulse
- biggest volume"
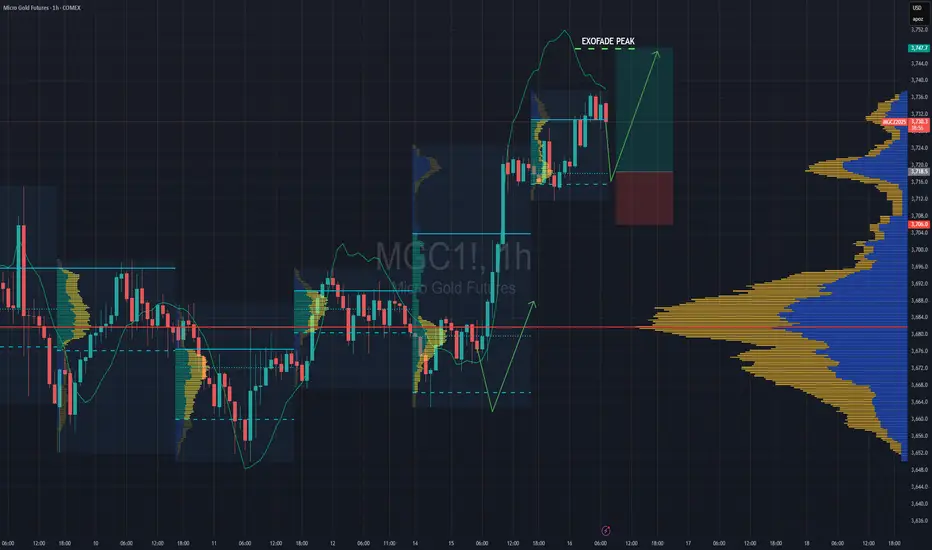
Gold Futures Day Trade Long EntryDont have enough time to go too into details on this one.
-Trade entry is based on Session Volume profile
- LVN on Visible range profile
- Entry at VAL - will likely get triggered during NY session today
- Weekly & Daily VWAP levels
Enjoy !!
KHC ketchup 1H Swing Long Conservative CounterTrend TradeConservative CounterTrend Trade
+ above exhaustion volume
+ long impulse
+ expanding T2
+ support level
+ 1/2 correction
+ biggest volume 2Sp-
- strong test
+ first bullish bar close level entry
Calculated affordable virtual stop loss
1 to 2 R/R take profit
Daily CounterTrend
"- short impulse
+ support level
- unvolumed T1 level
+ below 1/2 correction?!
+ historical volume zone
+ biggest volume 2Sp-
+ test
- price corrected to 1/2 on 1D CT"
Monthly CounterTrend
"- short impulse
+ broken SOS
+ exhaustion volume
+ initiative take over"
Yearly
no context

MOEX 5M DayTrade Aggressive CounterTrend TradeAggressive CounterTrend Trade
- short impulse
+ volumed T1?
+ support level
+ weak approach?
+ biggest volume 2Sp+
+ weak test
+ below first bullish bar close entry
Calculated affordable virtual stop loss
1 to 2 R/R take profit expandable to 1H 1 to 2 after test on 1H
1H CounterTrend
"- short impulse
+ volumed T1
+ support level
+ bar closed above 1D support level
+ volumed manipulation bar closed above T1"
1D Trend
"+ long impulse
+ SOS level
+ support level
+ 1/2 correction
+ volumed interaction bar"
1M Trend
"+ long impulse
- expanding T2
+ support level
+ volumed 2Sp-
+ 1/2 correction"
1Y Trend
"+ long impulse
- weak break
+ neutral zone"

TGKA 1H Swing Conservative Trend TradeConservative Trend Trade
+ long impulse
+ expanding T2 level
+ support level
+ 1/2 correction
+ biggest volume Sp
Calculated affordable virtual stop loss
1 to 2 R/R take profit
Day Trend
"+ long impulse
+ T2 level
+ biggest volume 2Sp-
+ support level
+ 1/2 correction"
Monthly Trend
"+ long impulse
- below 1/2 correction
+ expanding T2 level
+ support level"
No context on Year

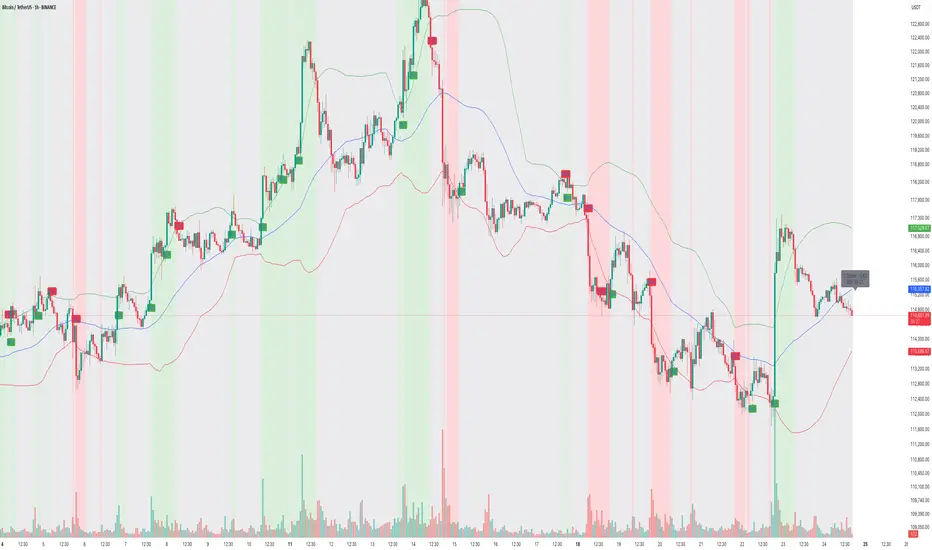
How to Use "Market Anomaly Detector (MAD)" 📊 Market Anomaly Detector (MAD) – Performance Walkthrough
🔑 Core Concept
The Market Anomaly Detector (MAD) is designed to spot both trend continuations and reversals using volatility-adaptive bands and a statistical anomaly filter.
• Trend Signals:
• ✅ Buy → when price closes above the upper (green) band.
• ✅ Sell → when price closes below the lower (red) band.
• Reversal Signals:
• 🔄 Sell → when price falls back below the upper (green) band after a breakout.
• 🔄 Buy → when price climbs back above the lower (red) band after a breakdown.
This dual-layer logic helps the indicator capture clean trending moves while also spotting failed breakouts/breakdowns.
⸻
📉 Z-Score Logic – Detecting Market Craze
The Z-Score filter measures how far price activity deviates from its normal behavior:
• 📈 Z > +1 → Market shows bullish strength / craze.
• 📉 Z < –1 → Market shows bearish strength / craze.
• ⚖️ Between –1 and +1 → Market is in neutral / low-momentum mode.
🔎 Current Snapshot (Weekend Session):
• Z-Score = –0.52 → clearly reflects very low momentum.
• Volume is also weak, as is typical during weekends.
• Despite low activity, MAD still adapts and keeps traders aligned with the actual statistical condition of the market.
⸻
🟢 Bullish Examples
• Captured breakout above 118K → 123K with clear momentum.
• Z-Score crossed +1 confirming bullish craze.
🔴 Bearish Examples
• Detected reversal near 121K → 116K with breakdown signals.
• Z-Score dipped below –1, validating the downside momentum.
⸻
🛠 How to Use
1. Look at band breakouts/breakdowns for trade triggers.
2. Watch Z-Score:
• Above +1 → only take bullish signals.
• Below –1 → only take bearish signals.
• Between –1 & +1 → reduce exposure / trade smaller size.
3. Works best on 15m / 1h / 4h with additional filters (VWAP, volume, S/R).
⸻
🎯 Summary
The Market Anomaly Detector (MAD) combines price bands with Z-Score statistics to give traders a 360° view of both market direction and market strength.
• 📊 Captures trends.
• 🔄 Detects reversals.
• ⚖️ Adapts to low-momentum phases (like weekends).
This balance makes MAD a versatile tool for traders who want to stay ahead of both momentum moves and false breakouts.
GBP/USD – VSA Signals Supply Emerging at 4H Resistance💡 Idea:
GBP/USD recently tested the 1.37–1.3750 resistance zone and showed clear supply signals in VSA terms. The price is rolling over with wide down-bars on increasing volume, confirming professional selling pressure. The pair is likely entering a markdown phase toward deeper 4H support levels.
📍 Trade Setup
Entry: 1.3470–1.3500 (pullback into broken support / minor supply test)
Stop Loss: 1.3575 (above last supply zone)
Target 1: 1.3340 (next 4H support)
Target 2: 1.3180 (major 4H support base)
R:R Ratio: ~1:3
📊 VSA & Technical Reasoning
Supply Bar at Resistance
At 1.37+, wide spread down-bars closed near the lows on ultra-high volume → classical VSA supply bar, confirming professional selling.
Upthrust / Trap Move
The wick above resistance acted as an Upthrust, luring breakout buyers before reversing sharply — a typical Wyckoff distribution signature.
No Demand Rally
Recent small up-bars into resistance came with narrow spread + low volume, showing lack of demand and confirming sellers are in control.
Lower Highs + Breakdown
Market structure has shifted into a downtrend sequence (lower highs & lower lows) aligning with VSA weakness.
Volume Confirmation
Volume on down-bars remains elevated vs. up-bars, validating that supply > demand. This suggests further downside continuation.
📌 Trading Plan
Look to short retracements into 1.3470–1.3500.
Expect price to break 1.34 support on increased supply.
Trail stop aggressively once 1.3340 is tested, targeting 1.3180 as the larger markdown objective.

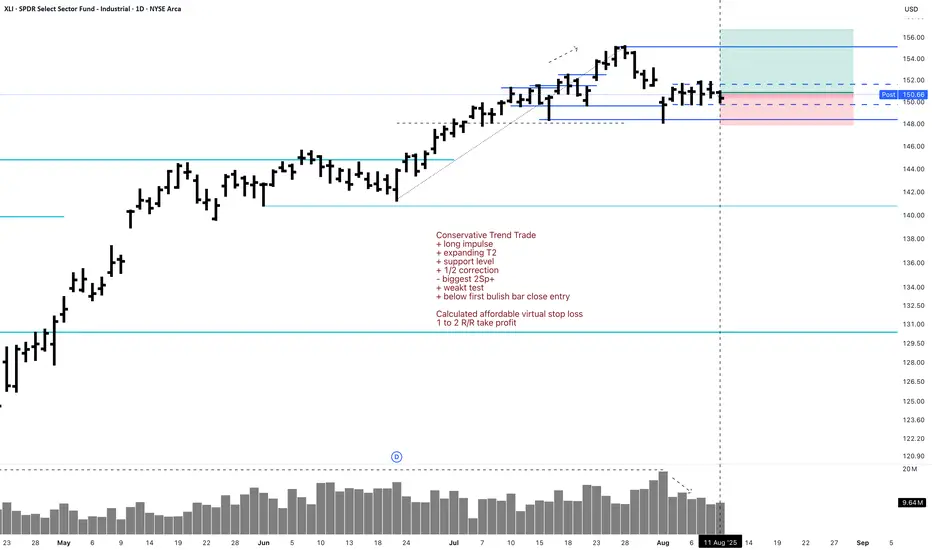
XLI 1D Long Investment Conservative Trend TradeConservative Trend Trade
+ long impulse
+ expanding T2
+ support level
+ 1/2 correction
- biggest 2Sp+
+ weakt test
+ below first bulish bar close entry
Calculated affordable virtual stop loss
1 to 2 R/R take profit
Monthly Trend
"+ long impulse
+ long volume distribution
= neutral zone"
Yearly trend
"+ long impulse
+ neutral zone"
F 1H Long Swing Conservative Trend TradeConservative Trend Trade
+ long balance
+ support level
+ ICE level
+ 1/2 correction
- biggest volume 2Sp-
+ weak test
- above first bullish bar close entry
Calculated affordable virtual stop loss
1 to 2 R/R above 1D T1 take profit
Daily Trend
"+ long impulse
+ neutral zone"
Monthly Trend
"+ long impulse
+ long volume distribution
+ neutral zone"
Yearly Trend
"+ long impulse
+ volumed T2 level
+ volumed 2Sp+
+ 1/2 correction"

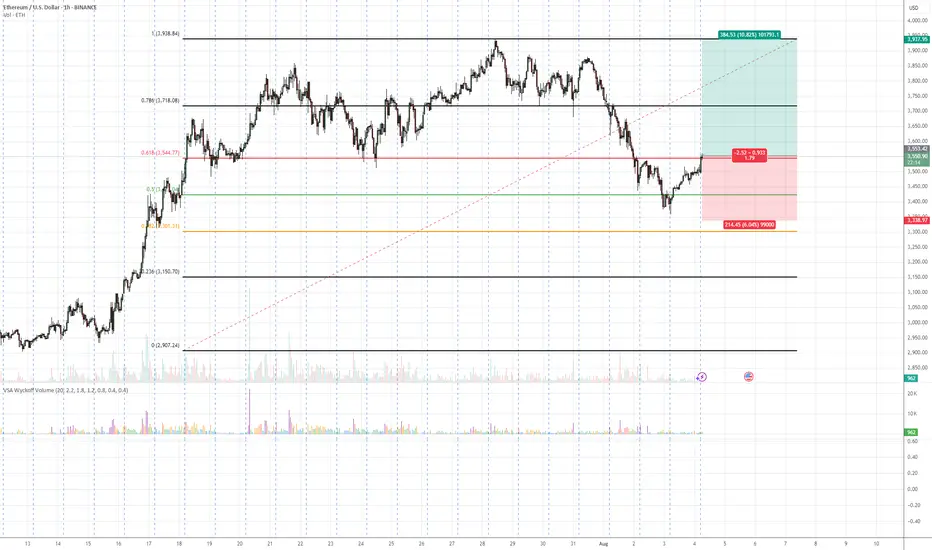
ETH/USDT – Bullish Reversal Potential from Fibonacci Confluence 💡 Idea:
Ethereum is showing signs of demand absorption at a critical Fibonacci support cluster (0.5 – 0.618 retracement). VSA patterns confirm that selling pressure is being absorbed, hinting at a possible markup toward previous swing highs.
📍 Trade Setup:
Entry: Current levels near 3,551
Target: 3,937 (+10.82%)
Stop Loss: 3,338 (below last absorption zone)
R:R Ratio: ~1.79:1
📊 Technical Reasoning (VSA)
1. Stopping Volume at Fibonacci Support
ETH tested the 0.5–0.618 retracement zone from its prior bullish impulse.
Wide spread down-bars on high volume failed to produce significant downside progress, signaling professional buying.
2. No Supply Confirmation
Following the stopping volume, the market printed narrow range candles on decreasing volume, indicating supply exhaustion.
3. Demand Emergence
The recent push above short-term resistance came with increasing volume and wider up-bar spreads, suggesting the start of an accumulation-to-markup transition.
4. Structure & Fibonacci Confluence
Current rally aligns with the Fibonacci golden zone and past structural support.
📌 Trading Plan:
Enter on confirmed breakout above minor resistance with volume expansion.
Scale out partial profits near 3,800 and let remainder ride toward 3,937.
Keep stop below 3,338 to avoid being shaken out by false breakouts.
BTC Balanced Volume Profile BTC is now trading in a textbook D-Shape Volume Profile. In english - Buyers & Sellers are happy to transact here and will stay inside the value area & consolidating sideways until further notice.
Consolidation at POC is a signature of this profile, and one of the easiest and least stressful trade setups because now, your mission, should you chose to accept. Is to fade the Highs (VAH) and Lows (VAL) and avoid the middle unless you love donating money to the market.
I'll have buy limit orders waiting right below the VAL where we have the single prints. It doesn't get any easier than this.
Doesn't mean price cant rip through, but this is always the best entry with less risk, especially when the single prints have not been tested yet..
BINANCE:BTCUSD CME:MBT1!

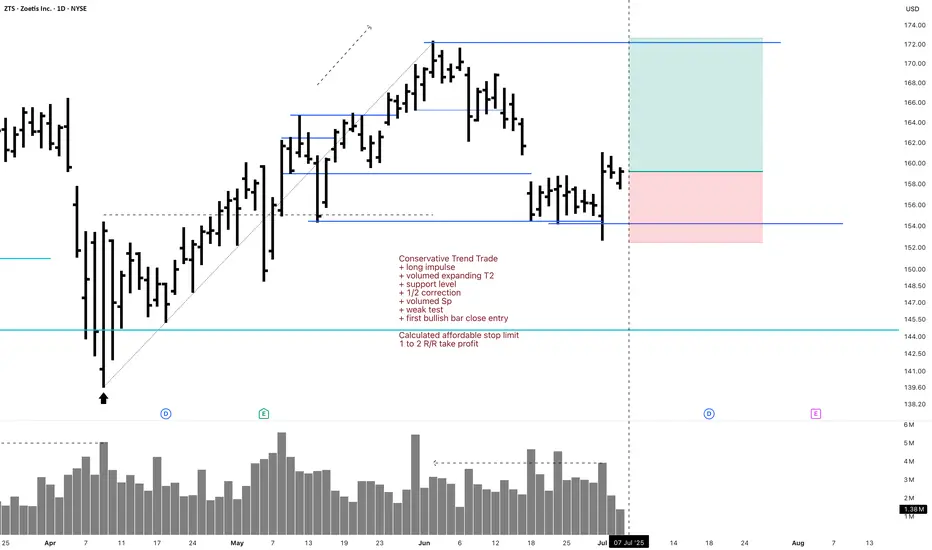
ZTS Investment 1D Long Conservative Trend TradeConservative Trend Trade
+ long impulse
+ volumed expanding T2
+ support level
+ 1/2 correction
+ volumed Sp
+ weak test
+ first bullish bar close entry
Calculated affordable stop limit
1 to 2 R/R take profit
Monthly trend
"+ long impulse
+ ICE level
+ support level
+ 1/2 correction
+ volumed 2Sp
+ weak test?"
Yearly trend
"+ long impulse
- correction"
ZTS 1D Investment Conservative Trend TradeConservative Trend Trade
+ long impulse
+ volumed expanding T2
+ support level
+ 1/2 correction
+ volumed Sp
+ weak test
+ first bullish bar close entry
Calculated affordable stop limit
1 to 2 R/R take profit
Monthly Trend
"+ long impulse
+ T2 level
+ support level"
Yearly Trend
"+ long impulse
- correction"

F 5M Long Daytrade Aggressive CounterTrend TradeAggressive CounterTrend Trade
- long impulse
- unvolumed T1
+ resistance level
+ biggest volume 2Sp-
+ weak test
+ first bullish bar below close entry
Calculated affordable stop market
T2 5M take profit
1H CounterTrend
"- long impulse
- unvolumed T1
+ resistance level"
1D CounterTrend
"- long impulse
- unvolumed T1
+ resistance level"
1M CounterTrend
"+ short impulse
- exhaustion volume
+ T2 level
+ resistance level
- unvolumed interaction bar
- reaction bar looks to close bullish in 6 days"
1Y CounterTrend
"+ long impulse
+ volumed T2 level
+ volumed 2Sp+
+ 1/2 correction
+ weak test"

F Investment 1D Conservative CounterTrend TradeConservative CounterTrend Trade
+ long impulse
- before 1/2 correction
+ expanding T2
+ support level
+ biggest volume 2Sp-
+ weak test
+ first bullish bar close entry
Calculated affordable stop limit
1 to 2 R/R take profit
Monthly CounterTrend
"- short impulse
+ 1/2 correction
- unvolumed T2
- resistance level
+ unvolumed interaction bar"
Yearly Trend
"+ long impulse
+ volumed T2 level
+ volumed 2Sp+
+ 1/2 correction
+ weak test"

Aggressive Trend Trade 1HAggressive Trend Trade 1H
- short trend
+ volumed T1
+ support level
+ biggest volume 2Sp+
Daily Trend
+ long impulse
+ T2 level
+ support level
+ 1/2 correction"
Monthly CounterTrend
"- short balance
+ expanding ICE
+ support level
+ unsuccessful biggest volume manipulation"
Yearly Trend
"+ long impulse
+ 1/2 correction
- below exhaustion volume?
- below SOS"
Will add more when 5M, 1H or 1D will show entry point

A Follow up to: “Adjustments for Better Readings & VSA vs BTC"When a trend approaches its end, we typically observe the formation of a buying or selling climax. That was certainly the case during Wyckoff’s era. Everything he described—market manipulation, signals, footprints—remains relevant today. But you know what that also means: if it's out there, it’s old news.
Yes, this is still happening, but we need to acknowledge that this information is no longer exclusive. And when a method becomes well-known—especially among retail traders—it can be used against them. Wyckoff himself hinted at this: the manipulators can and do use these same technical patterns to deceive. His real message?
“Keep an open mind.”
📉 In our current BTC chart, we’re seeing a textbook example of potential manipulation. A selling climax is visible—normally a sign of trend exhaustion and a bullish reversal. But is that really the case here? Did the downtrend truly end?
On the 1-Hour timeframe, both the RSI and volume indicators suggest otherwise: a bearish continuation seems more likely.
🧱 We're also witnessing a real-time formation of a Double Top pattern, taking shape since June 6. Measured by body candle spreads (excluding wicks), we observe four touches within a key price rectangle. These align with a known candlestick pattern: the Tweezer Top, commonly associated with bearish reversals.
What’s more, all of this is happening within a supply zone—actually three marked zones on the chart. The most recent zone shows signs of offloading pressure, amplified by both the Double Top and bearish candlestick formations.
And I haven’t even touched on the rejection wicks or how bearish volume spikes are gaining strength. That’s where the principle of Effort vs. Result comes in—remember, nothing in the market is free.
📊 In line with our past two posts, note how price action (PA) shows equal highs while RSI diverges, reinforcing earlier signals. The signs are stacking up.
So, the critical question now is:
Are we heading below the $100.718 level for a confirmed Head & Shoulders pattern?
Or is this just a retest before another move?
If this way of reading the market resonates with you and you want to go deeper—whether it’s building confidence or spotting signals before they play out—I work with a small circle of traders sharing TA privately on a daily basis. Feel free to reach out.
Till next time be well and trade wisely!

PLUG 1D Investment Long Aggressive Trend TradeAggressive Trend Trade
- short impulse
+ volumed TE / T1 level
+ support level
+ biggest volume 2Sp-
+ weak test
+ first buying bar close level
Calculated affordable stop limit
1 to 2 R/R take profit
Monthly Trend
"+ long impulse
+ support level
+ T2 level
+ biggest volume reaction bar
= below 1/2 correction"
Yearly CounterTrend
- short impulse

PLUG 1H Long Swing Conservative Trend TradeConservative Trend Trade
+ long impulse
+ 1/2 correction
+ volume zone
- strong approach
+ ICE level
+ support level
+ volumed Sp
Calculated affordable stop limit
1 to 2 R/R take profit
Daily Trend
"- short impulse
+ volumed TE / T1 level
+ support level
+ biggest volume 2Sp-
+ weak test"
Monthly Trend
"+ long impulse
+ support level
+ T2 level
+ biggest volume reaction bar
= below 1/2 correction"
Yearly CounterTrend
- short impulse
Will add more after successful test on 1H and / or after test completes on 1D.
