Gold Trade Setup🕰 Weekly Structure
Gold is still holding a bullish tone overall, with higher-timeframe demand zones supporting the structure. Momentum favors continuation as long as demand levels are respected.
📉 Daily View
Price recently broke structure (BOS) and confirmed buyers stepping in. The daily demand zone is aligned with the 4H block, adding confluence for bullish continuation.
⏱ 4H Breakdown
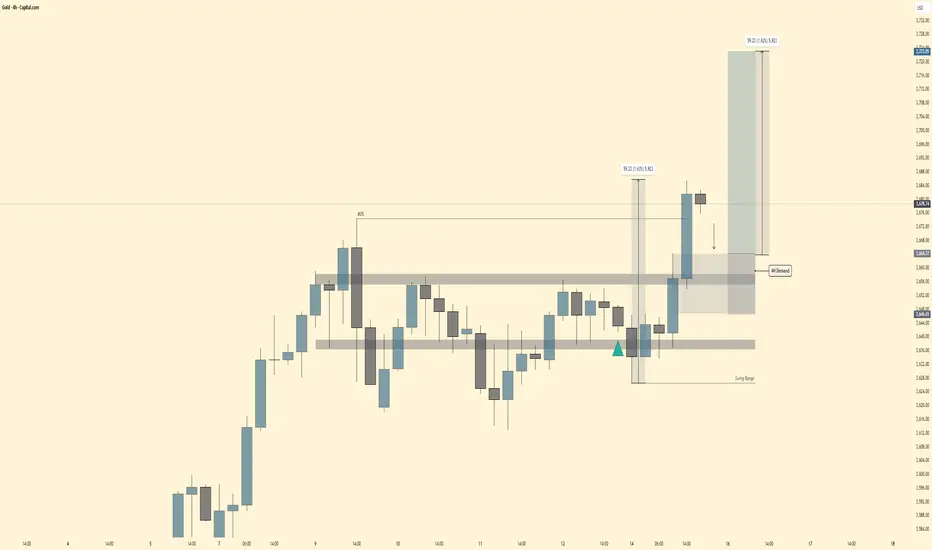
Price tapped into 4H demand around 3660–3670.
Clean rejection with a strong impulsive leg breaking above resistance.
Swing range remains intact with liquidity swept below before the move higher.
Upside target zone sits near 3730s, offering a solid risk-reward (around 1:6).
🔍 Outlook
Short-term pullbacks into 4H demand (3660–3680) = potential buy entries.
As long as demand holds, mid-term outlook remains bullish toward 3730+.
Failure to hold demand would re-open downside back into the swing range (~3640–3620).
Bias : ✅ Short-term pullback → Mid-term bullish continuation.
Volume
AUDJPY SELL TRADEUsing my adaptation to smart money concepts and technical analysis I predict the fall pf audjpy...that's all...

BBFL LongSince this is a relatively new stock, not much data is available for complete technical analysis. However, here is what I can analyze:
BBFL closed at 52.40 PKR after testing 53.00 PKR intraday.
Strong bullish candle with good volume after weeks of sideways movement → looks like a breakout attempt.
Short-term MAs (10, 20, 50 SMA) are clustered around 48–50 PKR and price is now trading above all of them → bullish crossover zone forming.
100 SMA (~49.56) also reclaimed.
200 SMA (~50.66, black line) is very close — the stock just closed above it for the first time in many months. This is a major bullish signal if sustained.
Noticeable spike in today’s candle compared to average days → confirms strength of breakout.
Immediate resistance: 55 PKR (psychological + prior congestion).
Next resistance: 60 PKR (previous support-turned-resistance).
Major resistance zone: 65–70 PKR (historical supply area).
Strong support: 48–50 PKR (now backed by multiple MAs). Below 47, weakness resumes.
Possible Next Targets:
If BBFL holds above the 200 SMA (50.66) with volume:
Target 1: 55 PKR
Target 2: 60 PKR
Target 3: 65–70 PKR
Target 4: 88 PKR (Previous all-time high)
Target 5: If breakout above 88, next technical target = ~136 PKR
If rejected from 55 and falls below 48, price could slip back toward 45–42.
This is not a buy / sell call, just my personal opinion

SEP 15, 2025 | XAUUSD | 6th SignalIn technical analysis, maintaining the right order of priority is crucial to avoid information noise:
1️⃣ Main Trend
The overall trend remains bullish, supported by higher lows and strong demand zones. The upward structure is intact as long as price holds above 3633.
2️⃣ Key Price Zones
- PW VAH: 3654 – Acting as immediate resistance and potential breakout zone.
- PW POC: 3645 – Key balance level, showing strong buyer absorption.
- PW VAL: 3633 – Strong support tested in the Asian session.
3️⃣ Price Action
Price has broken above the POC 3645 and is now consolidating near 3652–3655, creating a potential retest setup. This zone overlaps with PW VAH, strengthening its role as a decision point.
4️⃣ Candlestick Patterns
Recent candles show rejection of downside moves with wicks absorbing selling pressure, suggesting buyer strength is still dominant.
5️⃣ Trading Plan
✅ Buy 3652–3655 on retest confirmation, with stops below 3645.
🎯 Targets: 3665 – 3675 – 3700.
👉 If you find this analysis useful, don’t forget to hit like 👍 and drop a comment 💬 to support us in delivering even better insights!

Tesla - Forecast (Before and After)🕰 Weekly View
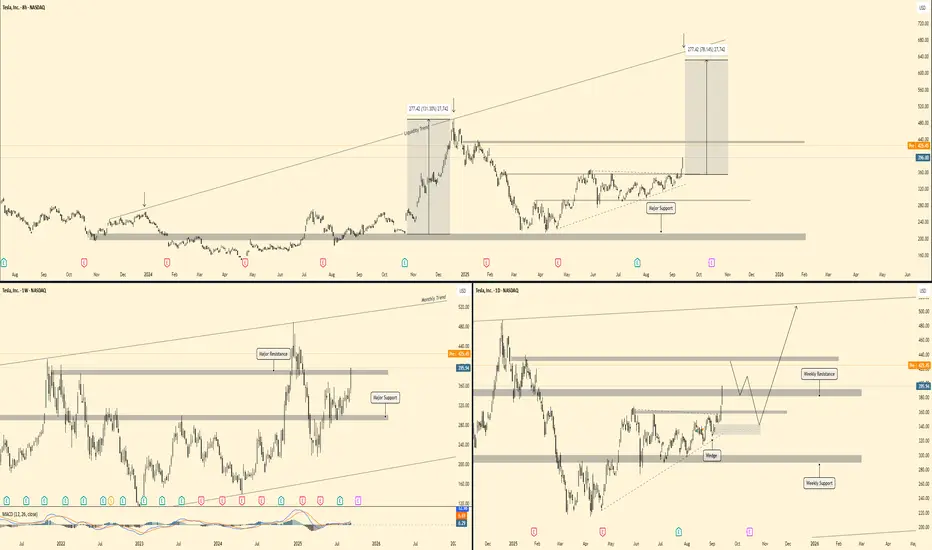
Price is holding above major support at 325–340 and pushing into weekly resistance around 420–440. The broader monthly trend points higher, with upside liquidity aligned toward the 500–520 zone.
📉 Daily Structure
Resistance: 420–440 supply zone.
Support: 325–340 demand zone, with a secondary base near 280.
Price has broken from a wedge formation and is now testing overhead supply, with potential to retest support before continuation.
⏱ 8H Breakdown
Tesla has been trending steadily upward off major support. Clean structure shows momentum building. A breakout and retest scenario could drive price toward 500+ targets, while failure at 420–440 could cause a pullback into 360–380 support.
🔎 Outlook
Scenario 1 → Retest support (360–380) before continuation higher.
Scenario 2 → Clean breakout above 440 accelerates into 500–520 zone.
Bias : Bullish continuation → mid-term target 500+.
AUD/CAD Support at 0.9170 – Buyers Ready to DefendAUD/CAD has a key support at 0.9170, created by a heavy volume cluster where buyers accumulated longs during a pause in the uptrend. This zone aligns with the beginning of a fair value gap, making it a strong technical confluence. On a pullback, I expect buyers to defend this area, creating a solid long opportunity.

USD/CHF Resistance at 0.7992 – Heavy Volume Zone Short SetupUSD/CHF is approaching a key resistance at 0.7992, formed by a heavy volume cluster where sellers previously built large short positions before driving the market sharply lower. This level marks clear institutional activity and acts as a strong supply zone. If price pulls back, we expect sellers to defend it again, making 0.7992 a high-probability short entry.

USD/CAD Resistance at 1.3879 – Vol Profile & FVG ConfluenceUSD/CAD has a key resistance at 1.3879, confirmed by a weekly D-shaped Volume Profile and a strong volume cluster where sellers previously stepped in. The aggressive selloff created a fair value gap, signalling institutional activity. If price pulls back to this level, sellers may defend it again, offering a solid short opportunity.

XAUUSD | London Plan | SEP 15, 2025In technical analysis, maintaining the right order of priority is crucial to avoid information noise:
1️⃣Main Trend
The overall trend remains bullish. The supporting trendline from last week is still intact, showing that buyers are in control.
2️⃣ Key Price Zones
-PW VAH: 3654
-PW POC: 3645
-PW VAL: 3633
Price is currently hovering around the POC 3645, which also aligns with the trendline. This is an important zone to monitor for reactions.
3️⃣ Price Action
During the Asian session, price tested the PW VAL zone at 3632–3635 and bounced upward, confirming strong support. Currently, price is retesting the POC, with potential to break and retest for continuation to the upside.
4️⃣ Candlestick Patterns
Candles forming around the trendline and POC indicate strong buying absorption and rejection of downside moves, providing favorable signals for the bullish scenario.
5️⃣ Trading Plan
- Buy 3643–3646: when price breaks above POC and retests.
- Buy 3632–3635: at PW VAL, where the Asian session bounce already confirmed buying pressure.
Target: 3665 – 3675.
Signals. Discipline. Profits
👉 If you find this analysis useful, don’t forget to hit like 👍 and drop a comment 💬 to support us in delivering even better insights!

Both Side NQ for the week of 15-20/09/2025NQ will retrace a bit lower just to continue higher. If we reach the 24500 I can see having a bearish close the last two day of the week.
Always remember, Caution, Patience and Risk!
GL!
If you like the content give me a follow on X!
Check Bio. Cheers!

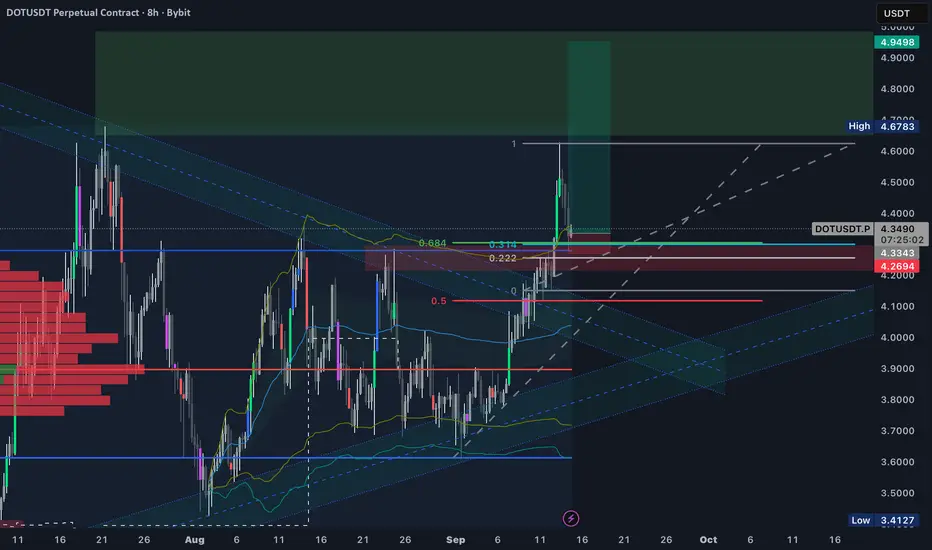
DOT at a decision point: breakout or just a stop hunt?DOT is currently attacking a new high, but the question is whether this move is a true breakout or just a liquidity grab.
This time I’m looking for a quick long setup.
My main zone of interest is 4.25–4.31.
This area lines up with multiple previous highs, which I now consider potential new support. It also includes:
• the 0.314–0.222 retracement from the latest pump,
• the 0.684 level (inverse of 0.314 from the bottom),
• the highest anchored VWAP line.
On top of that, divergences on RSI (14) and MACD (12:26) suggest price could push higher.
We’ve already tested the triangle breakout, so I believe that phase of interest is over. From here, price may dip slightly lower, but it doesn’t have to. A ~3% move against the position is acceptable.
I’m already in the trade.
If DOT retests the 4.25–4.31 zone, I see it as a strong buying opportunity.
Target: At least a new local high around 4.70, where I’ll take my first partial profit.
AVAV | Great Investment Medium Term | LONGAeroVironment, Inc. engages in the design, development, and production of multi-domain robotic systems and related services for government agencies and businesses. It operates through the following business segments: UnCrewed Systems, Loitering Munitions Systems, and MacCready Work segments. The UnCrewed System segment focuses primarily on small UAS products designed to operate reliably at lower altitudes in a wide range of environmental conditions. The Loitering Munitions Systems segment focuses primarily on tube-launched aircraft that deploy with the push of a button, fly at higher speeds than small UAS products, and perform either effects delivery or reconnaissance missions, and related support services including training, spare parts, product repair, and product replacement. The MacCready Works segment focuses on customer-funded research and development in the areas of HAPS, robotics, sensors, software analytics, data intelligence and connectivity. The company was founded by Paul B. MacCready, Jr. in July 1971 and is headquartered in Arlington, VA.

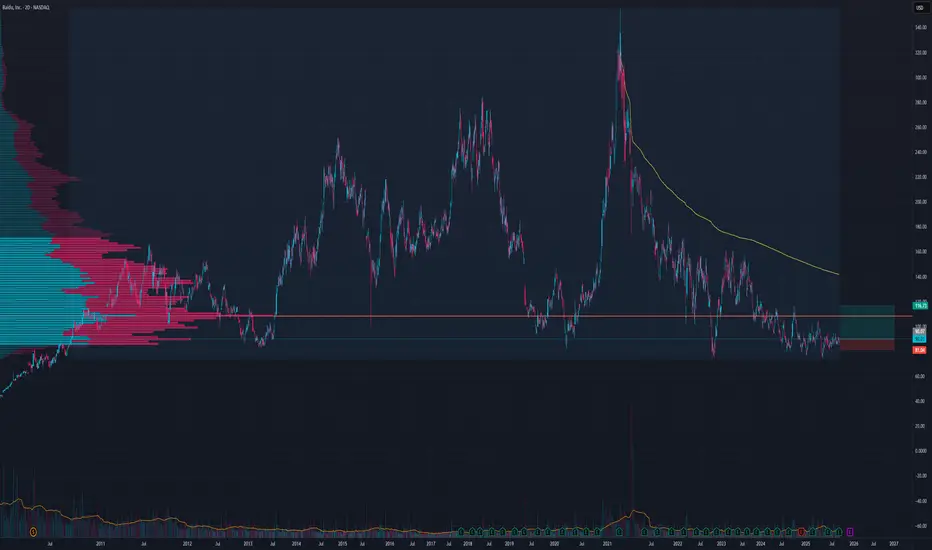
IBM | The Trend Is Your Friend | LONGInternational Business Machines Corp. is an information technology company, which engages in the provision of integrated solutions that leverage information technology and knowledge of business processes. It operates through the following segments: Software, Consulting, Infrastructure, Financing, and Other. The Software segment combines hybrid cloud platform and software solutions to help clients become more data-driven, and to automate, secure, and modernize their environments. The Consulting segment focuses on integrating skills on strategy, experience, technology and operations by domain and industry. The Infrastructure segment offers solutions for hybrid cloud and is the foundation of the hybrid cloud stack. Infrastructure is optimized for infusing AI into mission-critical transactions and tightly integrated with IBM Software including Red Hat for accelerated hybrid cloud benefits. The Financing segment refers to the client and commercial financing, facilitating IBM clients' acquisition of IT systems, software, and services. The company was founded by Charles Ranlett Flint and Thomas J. Watson Sr. on June 16, 1911 and is headquartered in Armonk, NY.

LRCX to 117LRCX is bouncing beautifully out of the anchored VWAP channel. I am risking down to VWAP and just below the 0.618 retracement, targeting 117 dollars to the upside.

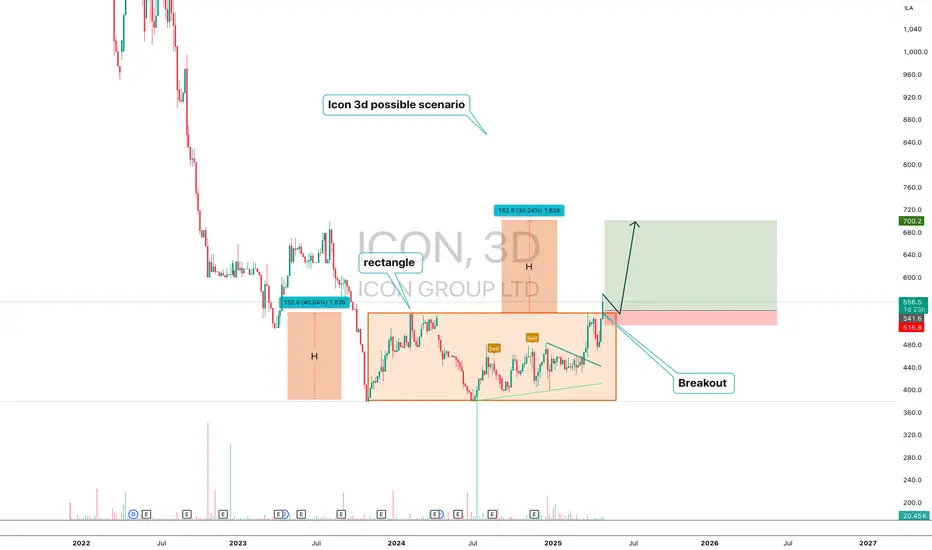
ICON — Breakout from Rectangle with H Projection Targeting $700ICON (3D) — Technical Structure Analysis
ICON has broken out from a prolonged horizontal rectangle pattern ($380–$540). The move activated a measured move structure with two H-sized waves. The first H was completed. The second H projects a move to the $700 area.
Key points:
-Confirmed breakout from range
-First H = 153 pts, completed
-Second H = 162 pts, targeting $700
-Price holding above breakout zone ($515–$541)
ICON has moved out of accumulation and entered trend expansion. As long as the support holds, the scenario remains valid. The technical model targets the $700 area.
VTI 1D: breakout on the daily within a long-term weekly uptrend On the daily chart, VTI (Vanguard Total Stock Market ETF) has broken through the key $303.5 resistance level with strong volume. This breakout occurs within a larger weekly uptrend channel, highlighting a continuation of the long-term bullish structure.
Volume profile shows a clear path ahead: $321.7 (1.272 Fibo) and $345 (1.618 Fibo). The golden cross (MA50 crossing MA200 from below) further supports the bullish case.
Fundamentally, VTI represents the entire U.S. equity market - large to small caps - and benefits from economic resilience, declining inflation, and passive inflows. It’s a logical macro play for trend continuation.
Tactical plan:
— Entry by market or after retest $303.5
— TP1: $321.7
— TP2: $345
— Invalidation below $300
The whole market breaking out? That’s not noise — it’s the signal.

POISON. RWA. Arbitrum.Poison multichain DeFi with decentralized synthetic RWA, sir - you can trade Stock, Commodities, ETF on the Blockchain
No custody. No middlemen. No regulatory drag.
Just 24/7 access to global equities - gud, really
Poison price is moving within the global descending channel and current entry point is the second lowest in history with enormous growth potential given the Arbitrum RWA's adoption and RobinHood come into it

BIDU Long TradeSeems good here, buying at market on Monday but prefer lower to flat price
SL at 81
TP at 116.73
Liquidity Voids: Where Price Runs Through Empty Space█ Liquidity Voids: Where Price Runs Through Empty Space
Big moves don’t just “happen”, they happen because either buyers or sellers step aside and let price run.
A liquidity void is what’s left behind when that happens: an area on the chart where price traded with very little volume, leaving a ‘hole’ in market participation.
This is not just another fair value gap. A typical FVG can form on normal volume during strong momentum. A liquidity void specifically signals a displacement under thin conditions, meaning the move was too easy, and price often comes back to check that area later.
█ What Exactly Is a Liquidity Void?
Think of the order book as a ladder of bids and asks. Normally, price moves step by step as orders fill at each level. But when there aren’t enough orders (low liquidity), price jumps levels and that jump is your void.
On a chart, it shows up as:
A large, one-directional candle with very small or no wicks overlapping neighbors.
Little or no volume relative to the move’s size (thin participation).
Price displacement that looks almost “too clean” — no hesitation, just a straight run.
These clues tell you price didn’t just move on heavy buying/selling, it moved through empty space.
⚪ Liquidity Void Detector
Use this free Liquidity Void Detector indicator to spot liquidity voids. It signals when the market makes a relatively sharp move on comparatively low volume, helping you spot these voids in real time.
█ Why Low Volume Matters
⚪ Not All Gaps Are Voids
A fair value gap can form on high participation, think of a breakout candle with heavy volume and institutional backing. That’s an accepted price move.
⚪ Voids Are Different
A liquidity void happens when the market skips prices because there was no one there to trade. It’s an inefficient move that the market often wants to revisit and “fill in” once participation returns.
⚪ Volume as the Filter
When volume is below its own average (or below a trend baseline), it tells you this wasn’t a “healthy” move, it was a thin-book displacement.
█ How Traders Use This
⚪ Mark the Zone
Draw the high and low of the candle(s) that created the void. This is your “inefficiency zone.”
⚪ Wait for the Return
Voids often act like magnets. Price often reverses and retests or fills the void, but it can just as easily slice through the zone once revisited, as thin liquidity offers little resistance.
█ What Research Show
Academic studies on price gaps find that immediate fills are rare, but the probability of fill rises over time. Downward voids (panic selling) fill faster on average than upward voids.
Crypto traders track CME Bitcoin gaps and report over 80–90% eventually get filled, but timing is unpredictable.
Volume-adjusted strategies outperform simple gap-filling because they focus on inefficient moves, not every gap. The key is filtering for thin participation.
█ Bottom Line
Liquidity voids are not just gaps, they are evidence of skipped prices under low participation.
They tell you where price moved “too easily,” leaving behind unfinished business.
Learn to filter for low-volume displacements, mark those zones, and watch how often price comes back to rebalance them. This turns a random candle into a predictive level, one that can guide your mean reversion trades or act as a support/resistance flip in trending markets.
-----------------
Disclaimer
The content provided in my scripts, indicators, ideas, algorithms, and systems is for educational and informational purposes only. It does not constitute financial advice, investment recommendations, or a solicitation to buy or sell any financial instruments. I will not accept liability for any loss or damage, including without limitation any loss of profit, which may arise directly or indirectly from the use of or reliance on such information.
All investments involve risk, and the past performance of a security, industry, sector, market, financial product, trading strategy, backtest, or individual's trading does not guarantee future results or returns. Investors are fully responsible for any investment decisions they make. Such decisions should be based solely on an evaluation of their financial circumstances, investment objectives, risk tolerance, and liquidity needs.

MU - POTENTIAL 52-WEEK HIGHMU - CURRENT PRICE : 118.89
The share price rises almost 111% from the bottom of 07 April 2025 to the high of 26 June 2025. Then the stock starts to pullback. It retraces at Fibonacci golden ratio of 38.2%. Last Friday the stock rises and closed as a bullish LONG WHITE CANDLE with high volume - indicating strong buying interest from investors/traders.
This bullish scenario is also supported by some other indicators such as :
1) Price above 50-days EMA
2) Price closes above ICHIMOKU CLOUD (KUMO)
3) RSI reading at 58.95 (above 50 considered bullish)
4) Price is trading near 52-week high level
With all the evidence mentioned above, now may considered as a buying opportunity. 1st target should be one- or two-dollar below the actual 52-week high resistance level.
ENTRY PRICE : 115 - 119
TARGET : 128 and 135
SUPPORT : 108

TLT Long Here or CloseI expect TLT to rally this summer since rate cuts are more likely then not
TP1 91
TP2 96

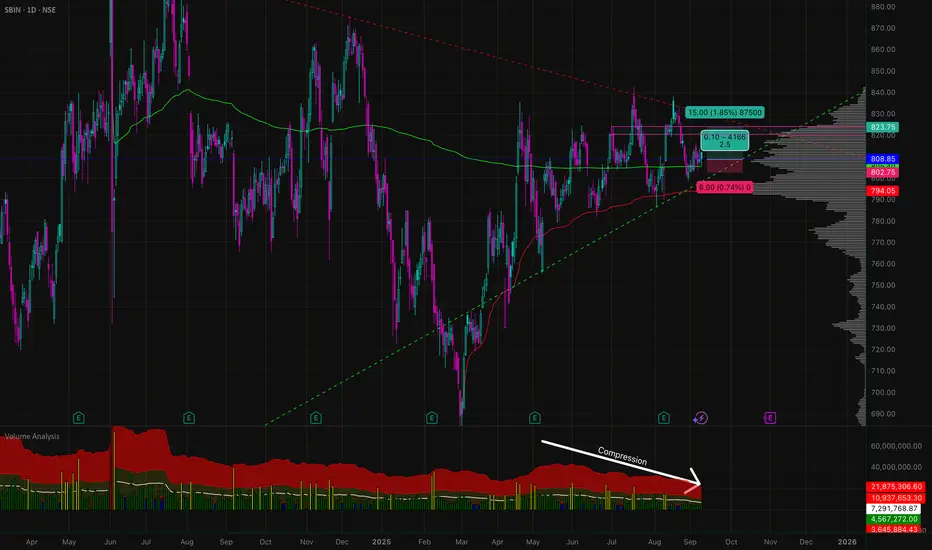
A nice 2.5:1 Risk:Reward available on a very stable security.It's State Bank of India. Can be considered relatively stable.
VSA Getting compressed. Ready to release.
Green VWAP from All time high of Jun 24.
Red VWAP from Swing low of March 25 since when the stock has stayed bullish.
With overall trend supporting, one can plan a simple 1 month position trade with 2.5:1 risk to reward ratio.
Only a study, not an advice.
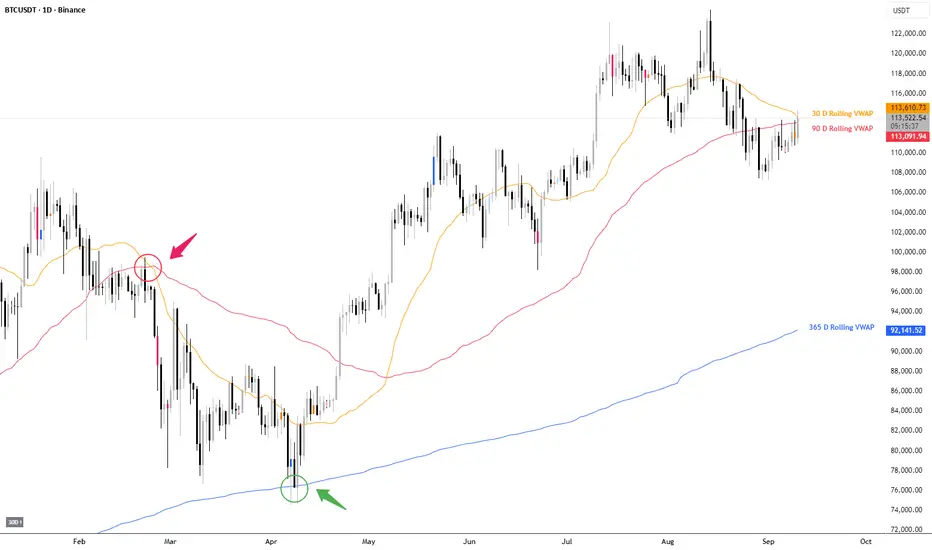
BTC Daily – Auction at VWAP BalanceBTC is testing a key auction battleground where the 30-day rolling VWAP (short-term value) and the 90-day rolling VWAP (quarterly value) are converging.
In February (red circle), the 30D VWAP slipped under the 90D VWAP — a sign that the short-term auction was no longer able to sustain bids above intermediate value. This imbalance triggered a liquidation move, pushing price down toward the 365D VWAP (yearly value).
In April (green circle), buyers defended the 365D VWAP, treating it as a long-term fair value anchor. That defense re-initiated the rally and reset the auction higher.
Today, the market is once again probing this value overlap zone between the 30D and 90D VWAP. The outcome will define whether short-term participants can accept higher value or whether rejection sends price back into deeper balance.
Auction scenarios to monitor:
Acceptance above 113.6K → short-term value migrates higher, opening path for continuation towards 119-120K.
Rejection here → signals that buyers are unwilling to accept higher value; price may rotate lower toward 103-106K, with the 365D VWAP (92K) acting as the deeper fair value magnet.
In auction terms, BTC is in price discovery mode at overlapping value areas .
Watch for where acceptance forms — that’s where the next directional conviction will emerge.