Bunge Breaks Out of Head & Shoulder with Volume SurgeHead & Shoulder Breakout -
Bunge (BG) has recently broken out of a Head & Shoulder pattern .
This breakout indicates a potential continuation of bullish momentum.
Volume Confirmation -
The breakout was supported by a strong surge in volume on the last trading day .
Rising volume adds conviction and reliability to the breakout.
Support Trend Line Break -
The stock has also broken out of the support trend line .
This trend line was formed during the previous Inverse Head & Shoulder pattern formation .
A breakout from this structure gives additional confirmation of strength.
Price Target -
Based on the breakout and pattern analysis, the next upside target is projected at 73.9 .
Technical Confluence -
Breakout from a major pattern (Head & Shoulder).
Volume surge confirming buying interest.
Breakout from trend line formed during earlier Inverse H&S.
All these factors combine to strengthen the bullish outlook.
Volume

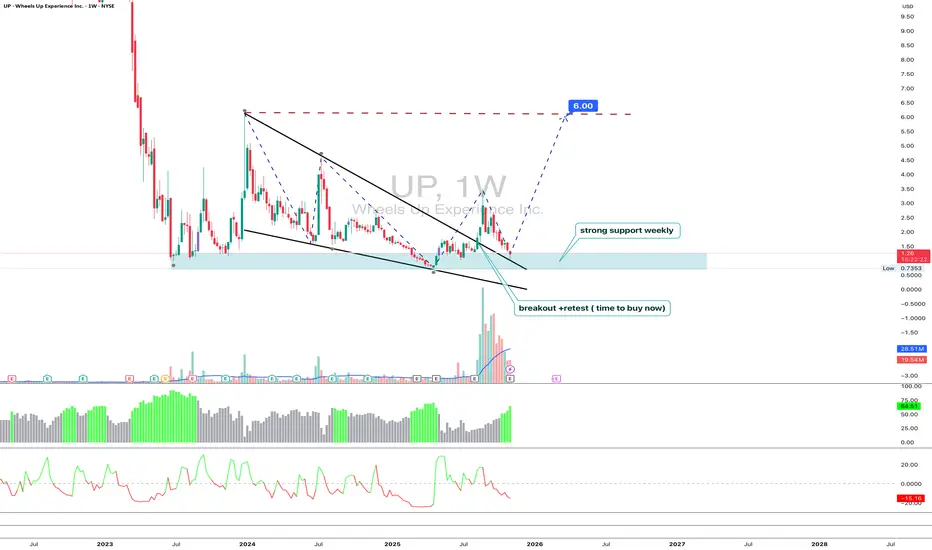
UP 1W-business jet without autopilot, but the runway looks clearTechnically, Wheels Up (UP) broke out of a long falling wedge and returned to the wide demand zone around $1.00–$1.30, where weekly support has formed. Volume expansion and bullish divergence signal that accumulation is taking shape. As long as price stays above $1.05, the structure remains constructive with initial upside targets at $1.60 and $1.80, while a breakout above $2.00 could open the door toward $6.00.
Fundamentally , the company continues its transformation after the liquidity crisis and strategic partnership with Delta Air Lines. Management has shut down unprofitable low-margin programs, refocused on high-yield corporate and frequent-flyer clients, and introduced a leaner “asset-light” model by outsourcing part of its fleet to partner operators. Q3 2025 results showed revenue near $185 million with solid gross bookings growth and improved operational efficiency - 99 % flight completion and 89 % on-time performance mark the best metrics since restructuring began. Losses and negative cash flow remain, but cost discipline is improving, and the Delta integration is slowly turning into a real commercial synergy. If corporate demand keeps strengthening and free cash flow moves toward breakeven, UP may turn into a rare small-cap comeback story in the aviation sector.
Tactically , the plan remains simple - hold above $1.05, look for movement toward $1.60 and $1.80, take partial profits near $2.00, and re-enter on retests around $1.20–$1.30 if volume confirms. A weekly close below $0.95 would invalidate the bullish scenario.
The market has heard “we’re taking off” before but this time, there’s at least a real runway under the wheels.
Nasdaq reversa 6-11-25Sellers were absorbed in that area, and the Nasdaq will likely reverse from this point in the coming days.
If it breaks through the supply zone, the trend could turn bullish in the next few days.

DXY Analysis — Tracking Dollar Strength This WeekThe DXY has cleared buy-side liquidity and closed below the Point of Control, signaling potential weakness in the dollar. I’m expecting continued selling on USD pairs (USDCAD, USDJPY) while looking for buying opportunities on EURUSD, GBPUSD, NZDUSD, and AUDUSD. Overall bias: bearish on the Dollar Index.

AMGN Long TradeThis will likely pump over 300$
Its pushing over vwap now and 320$ seems like a decent tp area
TP1 304$
TP2 320$
TP3 344$

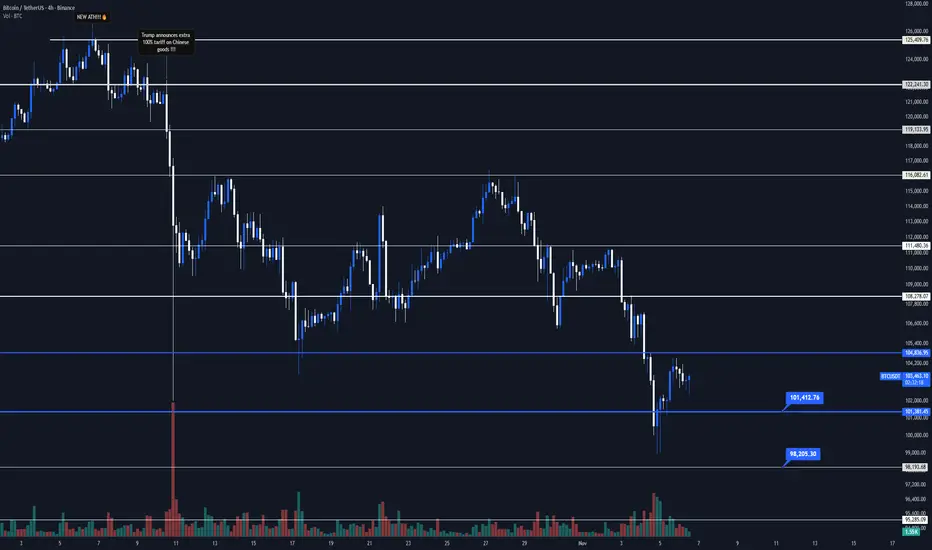
Learn how to short Bitcoin without a sense of guilt in 4 minutesIn such conditions, where bearish momentum has heavily tipped the scales in the crypto market, traders often face a subtle psychological challenge known as “the sense of guilt” when opening short positions.
What does that mean?
After opening long positions repeatedly, our minds become conditioned to believe that shorting somehow goes against our values — even our trading “ beliefs .” This mental association can cause us to miss clear market opportunities, hesitate to enter trades, and fall into a cycle of mental paralysis and indecision.
But indecision isn’t always about fear — fear of liquidation, panic, or haste. Sometimes, it hides behind those very beliefs and rigid patterns of thought, making us feel guilty for taking trades we haven’t opened in months. These biases quietly cloud our judgment, preventing us from viewing the market with clarity and flexibility.
Today, we’re diving right into that — identifying and dismantling our biases and mental rigidities, a skill every skeptical and self-aware trader must develop.
Now, shifting to the 4-hour timeframe — let’s take a closer look at the candles and volume.
The LWC (this 4H structure) is completely bearish, and the MWC also turned bearish after breaking below the 104,000 support.
Analyzing the waves: the first bearish wave had a smaller drop and a larger correction, while the second wave extended lower with more force — signaling strengthening bearish momentum. Volume confirms this: it spikes during drops and fades during corrections, which now look so weak and low-volume they’re practically meaningless.
The down candles are large and decisive, with short shadows — a clear sign of seller dominance and conviction. In contrast, the buyers’ candles are small and hesitant, almost as if begging the sellers for mercy.
Altogether, it paints an obvious picture: Bitcoin’s daily correction phase has begun. Ignoring that is exactly the kind of mental rigidity rooted in the “sense of guilt” buried deep in our conditioning.
Of course , I’m not saying upside is impossible — maybe Bitcoin suddenly jumps 10% with a single green candle. That’s fine. We’ll simply take the stop on our shorts and open longs when the setup shifts.
But on the other hand, refusing to adapt means missing numerous valid setups — trades the market is literally handing us.
The choice is yours, and you need to make it today.
Your short trigger could be the break of 101,381.45 support, or whatever entry your personal strategy defines. The point is simple: trade in the direction of the trend.
If this idea managed to soften some of your mental rigidity and prepare you for the market’s new conditions, don’t forget to boost this Idea.
Now get outta here.
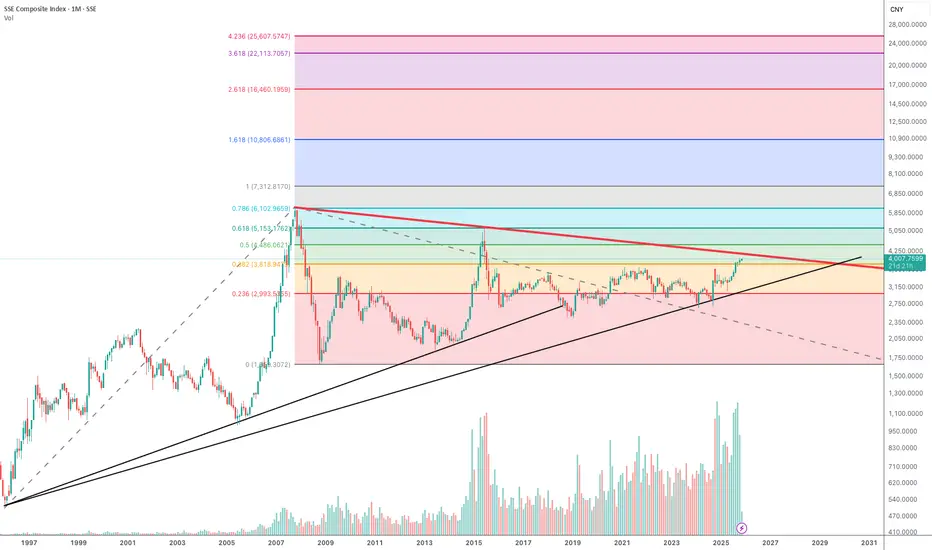
China exHKOnce the SSE Comp. is breaking its 18 year-downtrend, the index could quickly approach completely different levels...
#ARPAUSDT #1D (ByBit) Chuvashov's fork breakoutARPA did a V-shaped recovery with great increase in volume and about to regain 200MA support.
Golden cross seems around the corner, looks very likely to rally mid-term.
⚡️⚡️ #ARPA/USDT ⚡️⚡️
Exchanges: ByBit USDT
Signal Type: Regular (Long)
Leverage: Isolated (2.0X)
Amount: 4.6%
Entry Targets:
1) 0.02233
Take-Profit Targets:
1) 0.03456
Stop Targets:
1) 0.01743
Published By: @Zblaba
$ARPA BYBIT:ARPAUSDT.P #1D #DeFi arpanetwork.io
Risk/Reward= 1:2.5
Expected Profit= +109.5%
Possible Loss= -43.9%
Estimated Gaintime= 1-2 months

XAUUSD 15-Minute Chart Minor-Grade Short Entry Strategy XAUUSD 15-Minute Chart Minor-Grade Short Entry Strategy
Entry level around 4018 USD, stop-loss placed at 4053 USD.
1st target around 3940 USD: partial close (50% position), trail stop.
2nd target around 3870 USD: further partial close (50% of remaining), trail stop.
3rd target around 3800 USD: additional partial close (50% of remaining), trail stop.
Let the residual position run with progressive partial closures and stop trailing.

Bitcoin: Sellers Pushed the Price Below the RangeThe price tested the 50% level of the monthly range (100,353)
Hello, traders and investors!
This analysis is based on the Initiative Analysis (IA) method.
On the daily timeframe, the market remains in a sideways range, and the seller initiative managed to push the price below its lower boundary.
The price also interacted with the 50% level of the monthly trading range — 100,353.
These two factors may trigger buying activity and a potential return of the price back into the range.
Within the seller initiative, we can see four seller candles with increasing volume, with the highest volume at the bottom — the IC candle.
To look for buying opportunities, the price needs to return into the range.
Absorption of the seller’s IC candle would be a good sign to start looking for long setups.
Nearest key levels on the daily timeframe:
— Lower boundary of the range — 102,000
— High of the seller candle that broke the lower boundary — 107,299
If we look at the 1-hour timeframe, there’s also a nearby level at 107,672, which corresponds to the 50% level of the hourly trading range.
If buyers start to move, it will be important to watch how they handle the 107,299–107,672 zone.
Wishing you profitable trades!

Kraken Robotics (TSX-V: PNG) - Swing TradeSwing Setup
PNG.TO
— Swing Trade Breakdown
Kraken Robotics (TSX-V: PNG) is a Canadian marine technology company developing sonar and underwater robotics systems used in defense and offshore energy. The stock has exploded off its 52-week lows, driven by strong order flow and renewed interest in small-cap defense tech. It’s now showing a clean momentum setup with defined support and resistance levels for swing traders.
📊 Fundamentals
Kraken trades at roughly 92× earnings, far above the small-cap tech average (20–30×), meaning growth expectations are already baked in. The price-to-book is around 14×, showing limited book value support.
On the positive side, ROE sits near 17% with debt-to-equity at only 0.3, so leverage is low. However, free cash flow is still negative (~-13 M CAD) and the company relies on reinvestment for growth. Cash reserves around 33 M CAD provide a liquidity cushion.
Overall, Kraken is a high-growth, high-valuation play — decent profitability but no margin for execution mistakes.
📈 Trends & Catalysts
Revenue has climbed roughly 30% YoY (to about 90 M CAD), while EPS turned modestly positive (~0.06 CAD). That growth has investors rotating into the name, but negative operating cash flow remains a concern.
Recent catalysts include:
• New contracts in sonar and subsea battery systems
• Expanding demand from naval and defense clients
• Broader rotation into small-cap tech and defense innovation plays
Main risks: valuation stretch, execution in complex defense contracts, and persistent negative FCF.
🪙 Industry Context
Marine robotics is a small but rapidly growing niche. Over the past year, PNG has surged more than 200%, massively outperforming the TSX Tech Index. Sentiment has shifted bullish after years of stagnation, and the stock remains a micro-cap momentum magnet — but prone to sharp corrections.
📐 Technical View
PNG is trading near 5.69 CAD, well above its 50-day SMA (~5.00) and 200-day SMA (~3.50) — confirming a strong uptrend.
Momentum cooled after a sharp run, with RSI2 at 1.94, resetting from short-term overbought conditions.
The 5.50–5.60 CAD zone is now acting as support (former breakout base), while 7.40 CAD marks the key resistance at the recent high. Volume spikes during rallies suggest institutional accumulation — but expect volatility.
🎯 Trade Plan
I’m watching for a pullback entry around 5.50–5.70 CAD, which aligns with the 20-day EMA and prior consolidation range.
Stop-loss sits near 5.00 CAD, just below structural support.
Initial target is 7.40 CAD, offering roughly a 1.2:1 R/R, extendable toward 8.00+ CAD if momentum continues.
Alternatively, a breakout above 6.70 CAD on strong volume could trigger a momentum continuation setup for active traders.
🧠 My Take
Kraken is in a confirmed uptrend with strong sector tailwinds and visible contract growth. Valuation is aggressive, but momentum remains intact. This is a high-beta swing trade, not a long-term hold — I’m looking for a disciplined entry near support or a confirmed breakout, keeping risk tight and respecting volatility.
Bias: Bullish above 5.50 CAD, targeting 7.40 CAD+
Invalidation: Close below 5.00 CAD

AMGN | Healthcare STRONG | LONGAmgen, Inc. is a biotechnology company, which engages in the discovery, development, manufacture, and marketing of human therapeutics. The company was founded by William K. Bowes, Jr., Franklin Pitcher Johnson, Jr., George B. Rathmann, and Joseph Rubinfeld on April 8, 1980 and is headquartered in Thousand Oaks, CA.

HOW-TO: Ranger in TradingViewChart patterns and ranges are essential in technical analysis, helping traders identify potential support/resistance zones, volatility expansions, and reversal points. However, manually detecting daily or weekly ranges can be time-consuming and subjective. In this post, we describe how to effectively use the Automatic Range Detection feature inside the ZenAlgo - Ranger indicator, which calculates VWAP-based ranges and standard deviation lines automatically to save time and improve accuracy.
Using the Range Detection Feature
Add the Indicator : Access the ZenAlgo - Ranger and add it to your chart. It works on any timeframe up to 4H for optimal performance.
Key Settings :
Show Today's VWAP Range : Enabled by default. This displays the current day's range based on VWAP ±2.0 standard deviations (core range).
Show Previous Day's Range : Toggle to view historical daily ranges (up to 70 days back).
Show Monday Range : Activates weekly-like ranges derived from Monday's data (shiftable forward for projection).
Standard Deviation Lines : Customize visibility for ±3.0 to ±10.0 (and halves like ±0.5, ±1.5). Highlighted lines (e.g., ±5.0, ±10.0) use solid styles for emphasis.
Monday Range StdDev Lines : Extended up to ±40.0 for advanced volatility analysis.
Box Transparency : Adjust for visual clarity (0-100%).
Tip : Start with defaults – today's range in teal, previous in gray, Monday in yellow/blue – and tweak based on your asset's volatility.
The indicator uses a locked 1-min VWAP calculation for precision, incorporating buy/sell volume delta from 4H data to color ranges dynamically.
Range Detection Overview
ZenAlgo - Ranger detects and plots:
Daily Ranges : VWAP-centered core (±2.0 std) with extensions via std dev lines. Supports up to 50 previous days.
Monday (Weekly Projection) Ranges : Special ranges from Tuesday's data (representing Monday's VWAP), extendable up to 30 weeks. Includes core levels (25%, 50%, 75%) and extreme std devs (±40.0).
Half StdDev Lines : For finer granularity (e.g., ±2.5, ±3.5).
Volume Delta : Integrated buy/sell volume calculation for each range, helping identify bullish/bearish bias.
Return Labels : Automatically labels entries back into the range (e.g., "dS" for daily short return above RH).
Detection relies on VWAP and std dev thresholds – higher std lines indicate potential overextensions.
Examples
Here are some practical examples on BTCUSD (see chart snapshots below):
Daily Range in Action : The red box shows today's VWAP range (±2.0 std). Notice how price bounces off the midrange (MID) acting as resistance.
Previous Ranges for Context : Gray boxes overlay past days. In a trending market, price often respects these as dynamic S/R – e.g., breaking below a previous RL signals strength.
Monday Range Projection : Yellow core with blue borders. Shift forward to project weekly volatility. The 50% midline often acts as equilibrium.
StdDev Extensions : ±5.0 (solid) and ±10.0 lines for extreme targets. Useful in high-vol assets like crypto.
Tips
Validate ranges with volume delta for bias confirmation.
Use on intraday charts; combine with other indicators for entries.
For volatile markets, enable higher STDs on Monday ranges.

Bitcoin (BTC/USD) Market Analysis | November 2025The overall bias remains unchanged from the previous outlook. After BTC touched the 103,500 level on Oct 17, 2025, we saw a brief bullish push toward the 116,329 resistance zone.
However, price was rejected three times, and the daily candle never closed above this level — confirming it as a strong supply zone.
🔹 The rejection aligns perfectly with the 50% Fibonacci retracement, adding solid confluence to the bearish move that followed.
🔹 BTC has now returned to the key area of interest between 104,700 – 90,000, which stands as the final zone to defend for any long-term bullish continuation.
A clear break and daily close below 90,000 would likely invalidate the bullish structure and open the door for deeper downside movement.
#Bitcoin #BTCUSD #CryptoAnalysis #PriceAction #TechnicalAnalysis #Fibonacci #SupportAndResistance #TradingView #CryptoMarket #SwingTrading #MarketUpdate

EURUSD: Buyers not yet activeDaily range continues as seller initiative completes; potential buyer move toward 1.1820
Hey traders and investors!
This analysis is based on the Initiative Analysis (IA) method.
EURUSD is currently in a sideways range on the daily timeframe.
The seller initiative has reached its target, and now a buyer initiative is projected, with a target at 1.1820.
However, the weekly timeframe target sits much lower — at 1.16082.
So far, we don’t see active buying; candle volumes are declining.
It’s possible that meaningful buying will only start from the 1.14463 level.
Wishing you profitable trades!

ALUMINIUM trend may push it towards ATH the script is trading less than 10% away from ATH .
7 Days healthy consolidation already took place
the stock is trading with healthy volumes .
hindalco too trading healthy

PSU internal money shift likely?psu bank in strong trend and now with strong results and momentum
the selling volume a day ago and buying volume today show a different story for this script .however a short sell may trigger below 870 for 830 and 810 & 785 target areas .

ASO LongASO range trade with extra targets if it continues.
Enter now or on pull back/test as close to 51 as possible.
Price reclaiming range from historic levels.
3 Weeks of rising volume on the breakout.
Trend line break out.
Appears to be bull flagging on the level. If you zoom in on daily it appears to getting ready to on the process of testing the flag breakout and/or horizontal level.
MACD been positive for two weeks now.
Price above 50 and 200 weekly ma's.
TP1 - top of range
TP2 - .886 fib
TP3 - 1.272 fib

USD/CHF: Support at 1.7989 | Heavy Volume Zone + FVG ConfluenceUSD/CHF formed a strong support at 1.7989 where buyers built long positions before a sharp rally. The level aligns with both a heavy volume zone and a small fair value gap. I’m waiting for a pullback to this area to go long, expecting buyers to defend it again.

USD/CAD Rejection Setup: Strong Support at 1.3899USD/CAD formed a strong support at 1.3899 based on a classic Rejection Setup. Buyers rejected lower prices, confirmed by a heavy volume zone and a small fair value gap. I’m watching this level for a pullback to go long, expecting buyers to defend it again.

EUR/USD: Sellers Building Short Positions at Resistance 1.1613A strong resistance has formed on EUR/USD at 1.1613, confirmed by a heavy volume zone where sellers built short positions before a sharp sell-off. If price pulls back to this area, those sellers will likely defend it again. I’m watching this level for short trades.

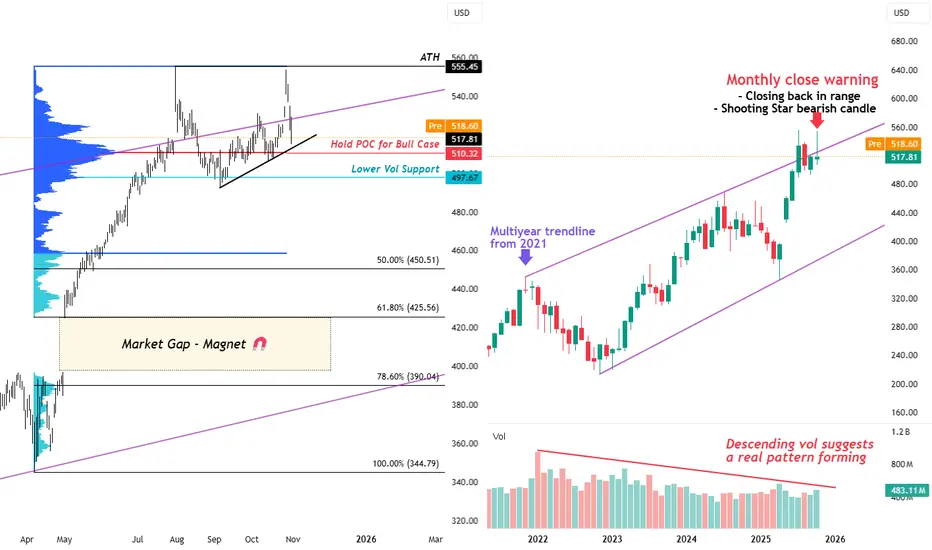
Warning: Microsoft closes BACK under Multiyear Range TrendlineMicrosoft has printed a significant bearish candle in October, and this is a major red flag for technical traders.
This candle not only aligns with a Shooting Star formation — a classic bearish reversal signal — but also closes back under a MULTI-YEAR rising trendline that’s been in play since 2021.
On the monthly timeframe (right chart), we can clearly see a rising channel forming over the past few years. The descending volume adds weight to this structure, suggesting true consolidation or distribution, not just a pause in trend.
📉🐻 Bias: Bearish - Monthly Rejection Candle
Unless buyers step back in soon, the risk of a deeper correction grows.
MONTHLY TIMEFRAME CONTEXT
Shooting Star rejection right at prior channel top
Closing back inside range after brief breakout attempt
Volume trending lower since 2021 — confirms pattern maturity
Interpretation: This kind of rejection after a breakout attempt usually signals exhaustion. Unless volume reverses sharply, the next few months could retrace toward mid-channel support (Around VAL at 50% Fib retracement).
DAILY TIMEFRAME ANALYSIS
MSFT’s recent volume profile highlights $510.32 as the point of control - price with the highest recorded traded volume.
Hold above $510–518 → bulls can still grind higher along the rising trendline
Break below $510 → opens room to test $497.67 (~$500 psychological support)
Below that, we enter the deeper retracement zone:
50% Fib at $450.51 → midpoint of the 2024–2025 rally
61.8% Fib at $425.56 → aligns with top of mid-2025 market gap
78.6% Fib at $390.04 → confluence with multiyear lower trendline, potential 2026 projection target
Market structure note: Losing the Point of Control (POC) at $517.81 would confirm the short-term trend shift and make the $450–$425 zone a strong liquidity magnet.
Closing Thoughts:
Microsoft’s fundamentals have started flashing caution too — not because growth is gone, but because expectations are stretched.
Last quarter’s cloud and AI segments still showed strength, but CapEx guidance surged, margins tightened, and investors didn’t love the tone of the forward outlook. Add to that a hawkish Fed backdrop , slowing enterprise spend, and rotation out of mega-cap tech, and you’ve got a setup that could easily unwind a bit of premium.
For now, it’s a “wait and see” moment — if bulls can defend $510 and the broader market stabilises, this may just be a cooling-off phase. But if we keep closing under the multiyear trendline, that’d confirm a shift from momentum to mean reversion, and the next few months could get interesting.