BB | BlackBerry Is About To Pop | LONGBlackBerry Ltd. engages in the provision of intelligent security software and services. It operates through the following segments: Cybersecurity, Internet of Things (IoT), and Licensing and Other. The Cybersecurity segment includes the brand Cylance, BlackBerry Spark, AtHoc, and SecuSUITE. The IoT segment focuses on software licenses, support, maintenance, and professional services. The Licensing and Other segment involves the intellectual property licensing arrangements and settlement awards. The company was founded by Michael Lazaridis, James Laurence Balsillie, and Douglas E. Fregin on March 7, 1984 and is headquartered in Waterloo, Canada.
Volume

Bullish on LACThe stock has been down on decreasing vol. The last two days, vol were dry up. It also failed to break down. A good risk: reward:
Stop below 6.37.
First target is 9.10 to fill the gap.

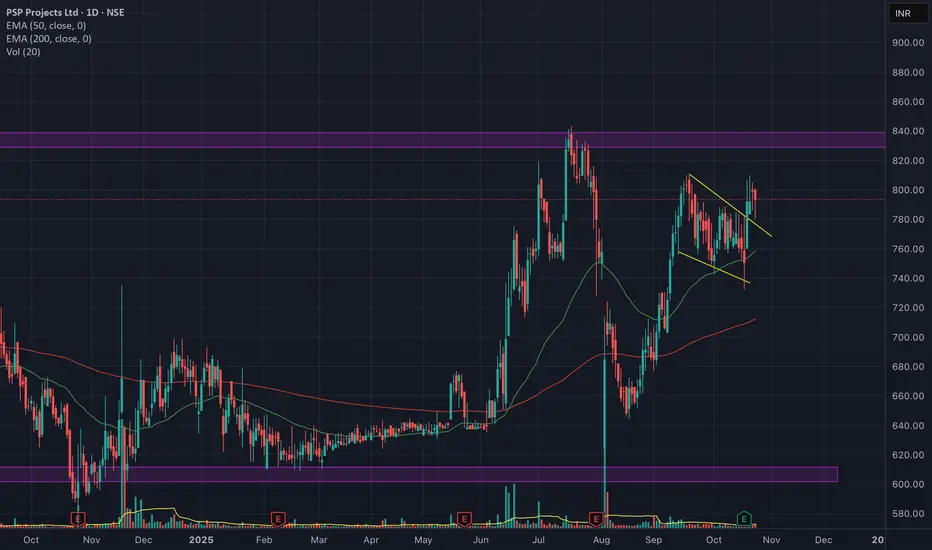
Pole n Flag pattern break out, getting ready for upside.This stock has given break out of pole n flag pattern on weekly and daily timeframe. Volumes are also supporting chart and candle patterns. Stock is moving within range, any close above 800 on daily timeframe, can test higher side of the range I.e. 845.
XAUUSD 15-Minute Small-Scale Swing Trade - Short PositionXAUUSD 15-Minute Small-Scale Swing Trade - Short Position
- Enter short position directly around the current price of 4140 USD, with stop-loss set at 4165 USD.
- First target: Take profit around 4070 USD; close half of the position and trail the stop-loss to lock in gains.
- Second target: Take profit around 4000 USD; close all remaining short positions and exit with full profits.

IBRX consolidating at $2.3 with volume confirmationThe share price has tested and been holding steady around/above ~2.3 for all of 2025. Volume is showing a very obvious increase over time as shares are being consolidated at this level. Price is due for a reversal. How high? My conservative guess is it will reach at least $6.7 before the end of its upward trend.
Don't know much about the company, just going off the chart.

Nekkar at 10 Year High at 12 - Danske Bank with BUY rating at 18Nekkar weekly chart
Huge sell transaction in september 2024 has taken a long time to absorb, but the stock is finally presenting a bullish movement to the upside that could breach the 10 year high point at around 12 NOK.
Danske Bank recently published BUY recommendation with tp 18 NOK.

ETH 1h chartCRYPTOCAP:ETH 1H Chart
Ethereum showing a clear market structure shift.
After a liquidity grab and CHoCH, price respected the 1H FVG and confirmed a bullish BOS, signaling potential continuation to the upside.
If price maintains above the FVG zone, ETH could look for higher targets in the short term.
#ETH #Ethereum #Crypto #PriceAction

BTC 4h LONGCRYPTOCAP:BTC 4H Chart
Bitcoin breaking out from a falling wedge structure — a classic bullish reversal pattern.
Momentum indicators turning positive, confirming a potential trend shift.
📈 Entry: Upon breakout confirmation
🎯 TP1: 113K
🎯 TP2: 116K
🛡️ Stop-loss: Below 109K
If the wedge breakout holds, we could see a strong continuation move toward the upper targets.
#Bitcoin #BTC #Crypto #TradingView

Gold buyers showing signs of activityHi traders and investors!
This analysis is based on the Initiative Analysis (IA) concept.
Daily Timeframe
We can see that volume is starting to appear from the buyer zone located at the base of the last buyer initiative.
Yesterday’s seller activity didn’t bring any visible result — the candle closed inside the previous one.
Still, this leaves hope that there is a buyer active in this area, and we may soon see a move from their side.
1-hour timeframe
On the 1-hour timeframe, a sideways range has formed.
The buyer initiative currently has a target at 4127 — let’s watch how this movement develops.
Inside this initiative, we now have a key seller bar - IC on the chart, which was absorbed by the buyer.
There has already been a first attempt of a rebound from this buyer zone, and it’s currently unfolding. We’ll see how it plays out.
If the first attempt fails, we can look for local long opportunities from the support level around 4065 or 4004.
Wishing you profitable trades!

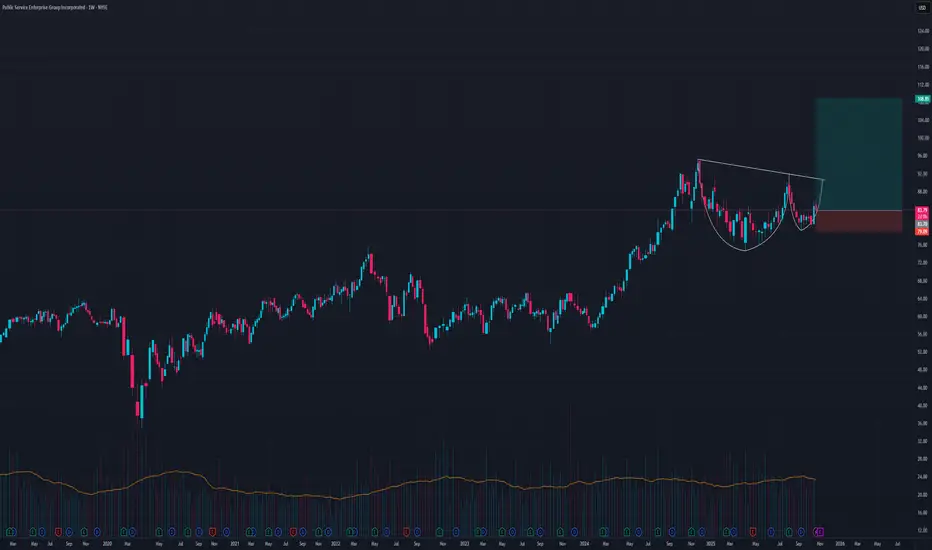
Long Trade Cup and Handle pattern on PEGWe might SFP the SL at $79 depending on the upcoming earnings report
But I think it more likely there will be a rally to new ATH
Safer SL at $74
TP around $108
Rising Broadening Wedge BreakdownBTC.D broke down from a two and a half year long rising broadening wedge pattern on high volume. The re-test flushed out leverage traders and low caps (including equities) are now ready to perform better than high caps, at least as long as BTC.D keeps falling. Let's use the fear and make good gains in the coming weeks/months. Just give it a little bit time. Timing + Patience = Key!

Gold’s Correction: The Calm Before the Next Wave🟡 Gold’s Correction: The Calm Before the Next Wave 🟡
The golden bull just took a breather — and this chart screams opportunity, not panic.
After tagging the $4,380 high, XAUUSD has retraced cleanly to the 0.618 Fibonacci zone (~$3,995), right at the heart of strong historical demand.
We’re now seeing:
✅ A tight falling channel forming a classic bullish flag
✅ Heavy volume node at $4,000 acting as support
✅ RCI oversold across all timeframes — the last time this happened, gold ripped nearly $400.
💬 My read:
The weak hands are selling. Smart money is quietly loading.
As long as $3,990 holds, the risk/reward here is golden.
🎯 Targets
First breakout: $4,165 (Fib 0.786 / channel top)
Next wave: $4,380 retest
Extension: $5000 if momentum confirms
🛡️ Stop: Below $3,880
💰 Reward potential: 3–4x
🚀 Accumulating here before the breakout.
Gold’s next leg could be the one everyone wishes they hadn’t missed.
#Gold #XAUUSD #Commodities #Fibonacci #RCI #VWAP #TechnicalAnalysis #BuyTheDip #TrendTrading #SmartMoney

QUBT - All MAs Pointing North!QUBT - CURRENT PRICE : 21.32
Technical Analysis Summary
Trend Analysis: The 20-day SMA is sloping upward, indicating short-term bullish momentum. Both the 50-day EMA and 200-day EMA are also trending higher, confirming that the medium- and long-term trends remain positive. Price is trading above all key moving averages, reinforcing a healthy uptrend structure.
Momentum Indicator (RSI): The RSI (14) is currently around 56, which is within the bullish territory (above 50). This shows positive momentum and room for further upside before entering overbought conditions.
Volume Analysis: Recent up-moves have been accompanied by rising volume, suggesting that the buying interest is supported by strong participation from investors.
Ichimoku Cloud: The price is above the Ichimoku Cloud, confirming the bullish sentiment and strong price structure. Chikou Span is above candlesticks and cloud further strengthening bullish outlook.
ENTRY PRICE : 21.20 - 21.40
FIRST TARGET : 25.00
SECOND TARGET : 28.00
SUPPORT : 18.00

The 3 Parts Of The Rocket Booster Strategy The the three parts are simple to remember.
Let me tell you a story.
I still remember the time I broke up with my girlfriend.
I got "Rocket Stocks" by M. Kratter.
I studied that book everyday for about 50 days!
It was not easy.But I wanted to master this skill.
I was deeply sad.
She said "Lubosi am helping you."
WTF - 😡
Well I am now stuck no cash , no hope and no love.
I studied as if this will help me.This was before the pandemic hit the peak months of lockdowns.
Am telling you it was a beast.
Two months pass by this year I start streaming.
I say a small prayer,
" God help me help your people learn how to trade."
Boom 🤯!!!
The Rocket Booster Strategy is boosted.
What is the boost?
20 Day Moving Average.
The price should be below the 20 SMA.
It was right there in our faces and I missed it.
Not only that the price should Touch the support.
Or else it's called a "Random" pattern.
The 3 Parts:
🚀Price above the 50 SMA
🚀Price above the 200 SMA
🚀Price touching support (50 SMA)
🌟 Bonus 🌟
*** Make sure price below 20 SMA
*** High Volume
*** 40 - 60 RSI indicator
That's it 😅
Trade safe.
Rocket boost this content to learn more.
P.S.
The high volume + Earnings Report provides a powerful catalyst.
Disclaimer ⚠️ Trading is risky please learn about risk management and profit taking strategies.
Also feel free to use a simulation trading account before you use real money.

XAUUSD (Gold) 1-Hour Timeframe Swing Trading - Long PositionXAUUSD (Gold) 1-Hour Time frame Swing Trading - Long Position
Wait for a pullback on the smaller time frame to find a long entry opportunity.
- Entry Level: Around 4100 USD.
- Stop-Loss Level: Set at 4047 USD.
- First Target Level: Look for around 4200 USD; reduce position size by half and trail the stop-loss.
- Second Target Level: Look for around 4310 USD; reduce position size by half again and trail the stop-loss.
- Third Target Level: Look for around 4450 USD; reduce position size by half once more and trail the stop-loss.
- Let the remaining position run freely, continuing to reduce position size and trail the stop-loss as the trade progresses.

Nokia ($NOK): The Most Underestimated Comeback Story in Tech Inf6G Leadership & Strategic Relevance
Nokia is already positioning itself as a major player in 6G development, with research partnerships across the EU, U.S., and Japan.
2 Strong Core Business
Despite macro headwinds, Nokia’s Network Infrastructure and Cloud & Network Services divisions continue to grow. The company is maintaining profitability even through currency and tariff pressure.
3 Valuation Gap
The market values Nokia at a fraction of its peers like Ericsson or Cisco, even though its tech portfolio is equally deep. Trading near $5.5, the stock looks undervalued based on long-term earnings potential.
4 Financial Stability
Nokia holds solid cash reserves, low leverage, and generates consistent free cash flow.
5 Catalysts
Major new contracts in 2025-2026
Possible tailwinds from stronger EUR/USD
Investor re-rating once margins improve

Double Fakeout on GoldHi traders and investors!
This analysis is based on the Initiative Analysis (IA) concept.
Gold has corrected by 6.5% from its peak and so far shows no signs of recovery.
On the 1-hour timeframe, the market is in a sideways range.
First, there was a false breakout below the lower boundary, and then a false breakout above the upper boundary of the range.
Now the seller has broken through the lower boundary of the sideways range, and the price has dropped below the 50% level of the daily buyer initiative.
At the base of the last buyer initiative on the daily timeframe, there is a buyer zone between 4058 and 3944 — a good area to look for potential trade setups.
Wishing you profitable trades!

Test Xrp/USd Trade with Cnagda Pure Price actionHello friends, many of my friends who use this indicator asked me if I use it, so I recorded this video for them so they could learn how to use volume to make good trades.
The sole purpose of making this video was to teach trading based on volume, but my voice recorder wasn't working, so I couldn't guide you live.
Now, let's talk about the trade. If you look before the first entry, you'll see that the last hour's bar was bearish, and when we took the trade, it was a Doji, which meant the market was in a dilemma. However, if you look at the volume status on the dashboard, the volume didn't reach the level of a large bullish bar, which means manipulation was underway. The market was moving upward without volume, so it was bound to fall.
But this trade didn't close, and we didn't make the expected profit. This happened because the market trend had changed, and a support zone had already formed there. Our indicators already told us that the market could reverse from here for a while.
As I've tried to explain with the cursor.
In the second trade, the dashboard below had already given a bullish signal, and you can also see this in the volume status. Volume is increasing with a bullish bar, so a scalp entry is possible here.
If you have any questions, please ask.

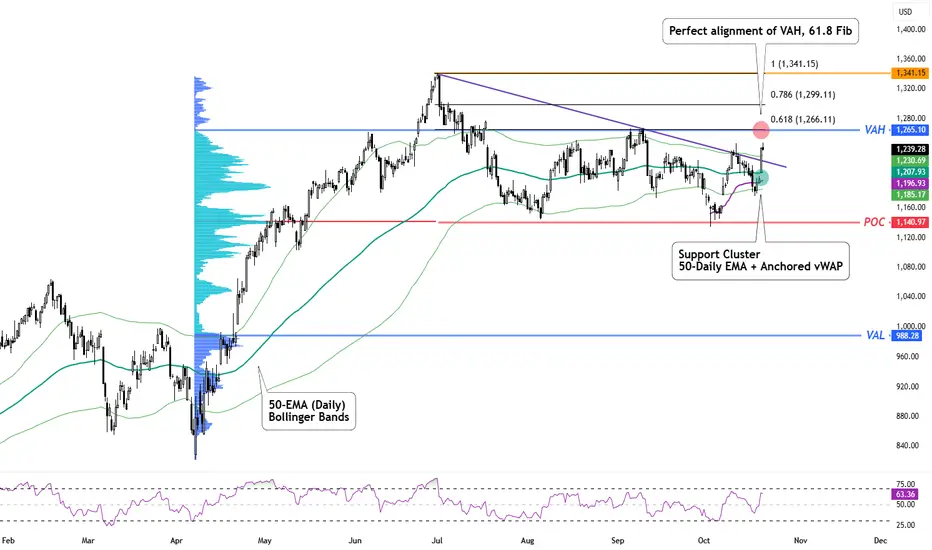
NFLX Earnings Today - Levels to WatchNetflix (NFLX) releases its Q3 earnings today, and sentiment is leaning bullish.
Analysts expect revenue around $11.5 billion (+17% YoY) and EPS near $6.96, supported by optimism around its ad-tier and paid-sharing model.
🌿 This signals growth.
For Q2 2025, Netflix posted revenue of about $11.08 billion, up roughly 15.9% YoY.
For Q3 2025, analysts are projecting around $11.51 billion in revenue, up ~17% YoY.
However, expectations are already high, meaning even a solid report might not trigger a strong rally unless guidance impresses .
Watch these levels:
$1,265 - Strong alignment of 61.8 Fib Resistance + Value Area High of April Rally
$1,196 - $1,207 - Cluster of Daily 50-EMA + Anchored vWAP of its recent mini rally
Overall bias: bullish but cautious — momentum favours the upside, but guidance and ad-tier results will decide if this breakout has real legs.
Draganfly Inc. (DPRO) — Swing Trade🏢 Company Snapshot
Draganfly Inc. (Ticker: DPRO on TSX/CSE) develops and supplies unmanned aerial vehicles (drones) and associated data-analysis systems, catering to public safety, agriculture, industrial inspection and defense sectors. The thematic driver: escalating demand for Western-compliant drone platforms and recent contract news in the defense segment.
📊 Fundamentals
P/E: N/A (company is unprofitable).
P/B: ~14.7× (from one data source) versus industry norms far lower.
Debt/Equity: 0 (virtually no debt, per recent balance sheet).
ROE: negative (loss-making).
Dividend Yield: 0% (no dividend).
Summary: High valuation with minimal profitability but strong balance sheet (low debt) and speculative growth stance.
📈 Trends & Catalysts
Revenue growth: Forecast for ~ +70–80% YoY in some reports, albeit off a small base.
EPS trend: Still in the red and not yet profitable; margin pressure remains.
Balance sheet: Cash rich, debt light — gives operational flexibility.
Fintel
Catalysts: Defense-contract wins (NDAA-compliant drone supply), drone market growth, potential sector rotation into aerospace/defense.
Risks: Very high valuation, execution risk in growth, dilution potential (past funding rounds), speculative nature.
🪙 Industry Overview
Weekly: Up (recent bounce from low base) — e.g., one-month ≈ +41% per one chart.
Monthly: Up strongly (short-term momentum).
12-month: Up significantly (100%+ in one year) but from low base, highly volatile.
Sentiment: Bullish, given thematic tailwinds in drones/UAS and recent momentum, yet tempered by speculative fundamentals.
📐 Technicals
Price ≈ C$11.98
50-SMA ≈ C$9.09 (above trendline) → price well above 50-SMA, indicating strong uptrend but non-trivial pullback risk.
RSI(2): 5.88
Pattern: Strong run-up from the ~$5–6 range into ~$14, now consolidating/pulling back. Support coming into play.
Support: C$11.18 – C$10.38
Resistance: C$13.58 – C$15.18 major zone.
🎯 Trade Plan
Entry Zone: C$12.10-$12.50 (ideally on pullback into support zone)
Stop Loss: C$9.50 (below support)
Target: C$17.85
Risk/Reward: ~ 1:2
Alternate setup: If price breaks above C$15.20 with volume, consider continuation entry targeting C$18+.
🧠 My Take
DPRO offers a high-risk/high-reward swing setup: it carries a speculative valuation and remains unprofitable, but the drone/defense theme is active and price action shows momentum. The most actionable way in is via a pullback into the C$12 support zone, which affords a favorable risk/reward before the next leg higher. A break below support would invalidate the bias.

GBP/USD: Two Strong Buyer Zones – Supports at 1.3268 & 1.3352On GBP/USD, I’m watching two key supports. The first, at 1.3268, formed at the base of a new uptrend where strong buyers accumulated long positions. The second, at 1.3352, combines a heavy volume cluster within the uptrend and a Price Action setup, a former resistance turned support. Both levels mark important buyer zones likely to trigger bullish reactions if retested.

EUR/USD: Strong Buyer Zone at 1.1561 – Key Long-Term SupportOn EUR/USD, a significant volume cluster formed at 1.1561 before a strong bullish move began. This zone marks where institutional buyers accumulated long positions and drove the price higher. If the market pulls back to this level, it’s likely to act as strong support, as those buyers will likely defend their positions again. I’m watching this area for a potential long opportunity.

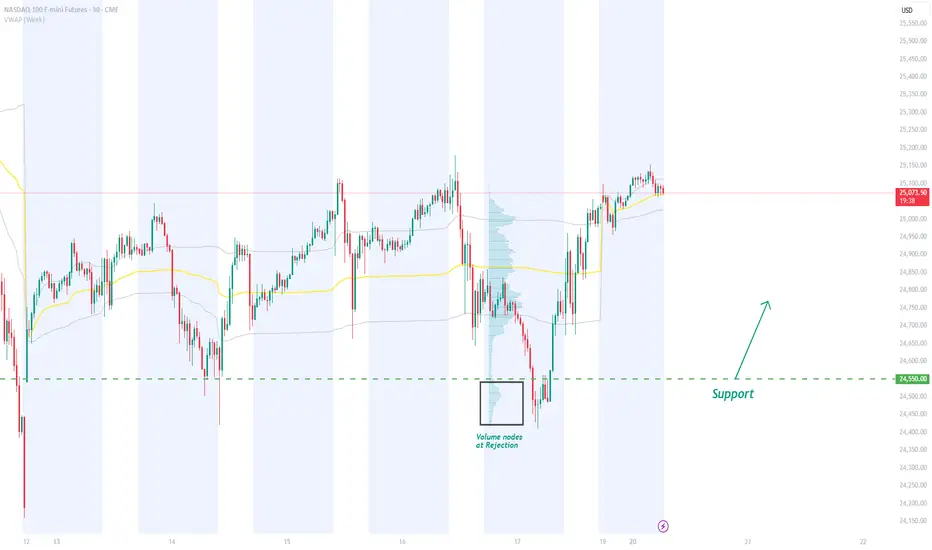
NQ Rejection Setup @ 24,550 | Strong Support Formed on D-ProfileThe NQ formed a D-shaped Volume Profile on Friday, signaling temporary balance between buyers and sellers. A strong rejection of lower prices created a significant volume cluster and a Fair Value Gap at 24,550. I’m watching for a pullback to this level for a potential long entry.