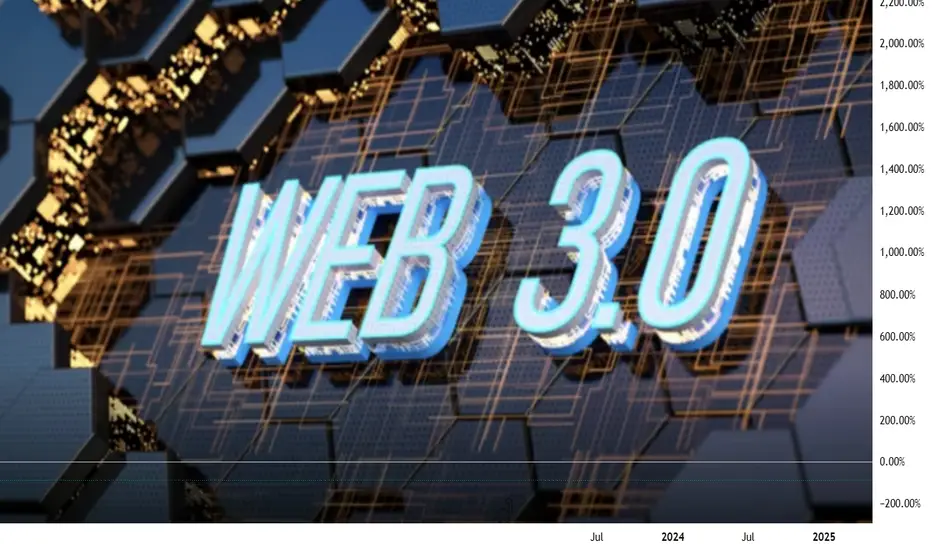
EduFi: The Next Big Web3 Vertical? Why LGCT Is Betting on ItIn the rapidly evolving Web3 landscape of October 2025, EduFi—blockchain-powered education finance—is emerging as the next major vertical, blending decentralized finance (DeFi) with accessible learning opportunities. With the global education market valued at $6 trillion and student debt exceeding $1.7 trillion in the US alone, EduFi promises to disrupt traditional systems by offering tokenized credentials, micro-credentials, and AI-driven personalized learning. Legacy Token (LGCT), the utility token of the Legacy Network ecosystem, is positioning itself at the forefront, integrating gamified education with blockchain rewards to empower 500,000+ users worldwide. This article explores EduFi's potential, LGCT's role, market drivers, and trading insights. Data as of October 9, 2025—position for EduFi's ascent.
The Rise of EduFi: Democratizing Education Through Web3
EduFi leverages blockchain to address key pain points in education: high costs, credential verification, and access barriers. By tokenizing diplomas, courses, and funding, it enables peer-to-peer lending, fractional ownership of educational assets, and earn-while-learn models. Platforms like EduFi.tech and Open Campus are pioneering this, with EduFi.tech offering Shariah-compliant financing for Omani students and Open Campus launching EDU Chain on Arbitrum Orbit for consumer-facing EduFi apps.
LGCT, the multi-chain utility token of Legacy Network, powers a gamified education app with over 500,000 downloads in its first three months. Users earn LGCT for completing modules, lessons, and mini-games, converting them to cash or using for premium content. Priced at $1.93 with a $193.88M market cap, LGCT is listed on exchanges like Gate.io and KuCoin, emphasizing "market-resistant utility" through buyback-and-burn mechanisms and MiCA compliance. The token's fixed 300M supply and vesting schedules ensure scarcity, while its integration with Ethereum, BSC, VeChain, and Polygon supports cross-chain flexibility.
Why fresh? EduFi aligns with Web3's user-owned data ethos, solving a $1.7T student debt crisis. In 2025, 30% of global education spending could shift to blockchain, per Deloitte, with AI-Web3 convergence creating autonomous DAOs for learning. Legacy Network's app, with 1,400+ lessons, rewards users for milestones, fostering engagement. On-chain metrics show LGCT volume doubling despite market dips, up 70% in bear phases, signaling strong 2025 prospects.
LGCT's Bet: Gamification and Real-World Utility in EduFi
Legacy Network's LGCT token is betting big on EduFi by gamifying learning, where users earn tokens for educational achievements, redeemable for real-world value. The app focuses on personal growth, with over 500,000 downloads globally, becoming a go-to self-improvement tool. LGCT's multi-chain design (Ethereum, BSC, VeChain, Polygon) enables seamless payments for subscriptions and in-app purchases, with a portion of revenue used for buybacks and burns to drive scarcity.
Key facts: LGCT's 24-hour trading volume hit $7.83M, with a fully diluted valuation of $547.99M. The token's market-resistant design ties demand to education use cases, not speculation, with 16.8% APY staking rewards. In Q3 2025, LGCT's volume doubled, rising 70% during downturns, indicating resilience. The ecosystem's AI-driven personalization tailors lessons to goals, integrating Web3 for credential verification and funding.
EduFi's appeal: It solves access issues, with 65% projected growth in blockchain education by 2026. Legacy Network's MVP, hackathons, and university courses have empowered 2M+ users, positioning LGCT as a bridge between learning and earning.
Market Implications: EduFi's $100B Potential
EduFi could capture 10% of the $6T education market, or $600B, with Web3's $153B TVL providing liquidity. LGCT's listing on Bitpanda and Gate.io boosts visibility, with AI-Agent layer in Whitepaper 2.0 enabling autonomous DAOs for education. Sentiment is 71% bullish, correlating 0.7 with ETH, as 40% of hedge funds eye AI-Web3 convergence.
Risks: Regulatory hurdles (MiCA compliance) and scalability (bridge exploits, 5–7% dips). Forecasts: LGCT at $5–$10 by end-2025, driven by 900M Telegram users and EduFi adoption.
Trading Signals: RSI and MACD
Based on April 2025 uptrends:
LGCT ($1.93): RSI at 58 (bullish). Bullish MACD (+0.12)—target $2.50 (30% upside). Fibonacci support at $1.70, resistance at $2.10. On-chain: volume +70%.
ETH ($4,500): RSI at 58. Bullish MACD (+0.12)—target $5,200 (15% upside). Fibonacci support at $4,200, resistance at $4,760.
Overall: RSI 58 signals momentum—long at supports for 15–30% Q4 gains. Risks: regulatory news (5–7% dip); hedge with USDC.
How to Profit from EduFi's Rise
AI Alerts: Monitor RSI >60 for entries (e.g., LGCT at $1.70), targeting 10–15% yields on ecosystem updates.
On-Chain Tracking: Watch TVL ($5B) and whale activity (+15%) for rally signals.
Portfolio Strategy: Allocate 20–30% to LGCT, hedge with USDC at RSI >70 for 15% Q4 returns.
Education: Study gamified learning mechanics and practice via demo platforms.
Conclusion: EduFi's Web3 Takeover
EduFi is the next big Web3 vertical, solving $1.7T debt with tokenized learning and LGCT's gamified ecosystem. With 65% growth projected and LGCT's resilience (70% rise in downturns), traders can target $9.89 long-term. RSI 58 and bullish MACD signal 15–30% Q4 gains—position for EduFi's $100B potential.
What's your EduFi play? Comment below!
#EduFi #Web3Education #LGCT #TON #CryptoTrends
Volume
$COIN viction Trade: Weekly Up, Daily Tight
NASDAQ:COIN
Summary
NASDAQ:COIN exhibits a textbook “expand → break → retest → coil” progression. A broad weekly megaphone that developed through 2024 continued into 2025 with a June ’25 breakout; price subsequently reached ~$445 (megaphone resistance) in July ’25 and then retraced in an orderly fashion, holding above 2023’s ceiling. Since that pullback, ranges have narrowed and participation has declined while price consolidates above $280—behavior consistent with constructive acceptance before a potential next leg higher.
Market Structure and Setup
The primary structure is defined on the weekly chart: an expansionary megaphone that retested prior highs. Tactically, the daily chart shows a controlled pullback, retest, and subsequent coil. This multi-timeframe alignment—higher-timeframe trend with lower-timeframe acceptance—creates favorable conditions for measured moves and for risk to be defined against transparent levels rather than discretionary judgment.
Fibonacci-Based Upside Roadmap
Anchoring to the 2024–2025 impulse advances, 1.618 extensions cluster around ~$580 (Sep ’24 → Dec ’24 leg) and ~$650 (Oct ’23 → Mar ’24 leg). These are not short-dated “targets” but conditional waypoints: they remain operative if the current consolidation resolves higher and the weekly uptrend reasserts.
Microstructure: Short Consolidations as Future Magnets
In sustained advances, brief, tight candlestick compressions often function as “price memory,” attracting subsequent retests and liquidity. COIN’s February 2024 bull-flag pause—formed mid-run—has been revisited multiple times since, underscoring how such compressions act as magnets in later price action. The present tight band atop $340–$370 should be viewed in similar context: it is both a potential near-term launchpad and a likely reference zone for future pullbacks as supply and demand re-balance around it.
Execution Plan
Accumulation is favored on constructive behavior within $290–$330 (retest followed by a higher low on the daily). For risk management, tactical invalidation sits below ~$280; for participants keying off weekly structure, a wider ~$250 stop aligns with the higher-timeframe shelf. If momentum resolves first, additional entries are reasonable on a clean break-and-hold above local range highs, using the reclaimed shelf to maintain tight risk. From a successful breakout, staged distribution into ~$580 with reassessment into ~$650 allows the position to self-finance while respecting the possibility of momentum fatigue.
Invalidation Criteria
A daily close back below ~$280 would indicate the near-term reclaim has failed and the base requires more time. A weekly close beneath ~$250 would challenge the integrity of the larger expansionary structure. Either signal warrants standing aside and allowing the chart to reset.
Fundamental Linkages
Coinbase’s revenue remains acutely sensitive to crypto price trends and realized volatility. When BTC/ETH trend and trading activity broadens across spot and derivatives, COIN’s top line typically expands with the cycle. The U.S. regulatory backdrop has moderated relative to the prior year—removing one overhang—yet policy risk persists and can shift rapidly. In effect, the technical setup has a plausible fundamental tailwind when the broader crypto complex trends and trades.
Key Risks
Crypto beta: A broad risk-off in digital assets will likely transmit to COIN regardless of technical posture.
Policy/regulation: Adverse enforcement actions or new rules could impair volumes, product breadth, or take rates.
Competition: A prospective Kraken IPO would arm a major U.S. competitor; Robinhood’s continued crypto build-out pressures economics during quieter tapes.
Operational/security: Exchange businesses carry ongoing operational and cybersecurity risks; incidents can compress multiples abruptly.
Conclusion
The market disclosed intent with the June breakout; current price action is testing sponsorship. Provided COIN continues to accept above $280–$330 and the ongoing coil resolves upward, the $580 → $650 roadmap remains credible. The operative plan is to trade the daily in the direction of the weekly, treat the former resistance shelf as the line in the sand, and require the chart to confirm strength before pressing exposure.
Not financial advice. Just charting things out. Let’s see what happens. Please adapt levels, sizing, and risk controls to your own process and constraints.

Parag Milk Diwali 2025 pick 2: Premiumisation play Parag Milk Foods Premiumisation & Strategy
Parag has increasingly shifted towards value-added and premium products rather than just commodity milk to drive better margins
The company operates multiple brand tiers addressing different consumer needs: core everyday dairy, high-nutrition and health & wellness, and premium farm-to-home offerings
Product & Brand Portfolio
Gowardhan — traditional dairy staples such as cow ghee, paneer, curd/dahi, and flavoured milk, positioned as a trusted heritage brand
Go — focused on cheese, yoghurt, UHT milk, and other processed dairy variants such as cheese spreads, targeting niche premium consumers
Pride of Cows — premium single-origin and farm-to-home line offering whole and fat-free milk, paneer, ghee, and curd, emphasizing freshness and traceability
Avvatar — health and nutrition brand focused on whey protein and protein supplements made from 100% vegetarian whey
Other smaller lines include flavoured milk (Topp Up), dairy beverages, buttermilk, and lassi
Geographical Footprint & Supply Chain
Manufacturing facilities located in Manchar (Maharashtra), Palamaner (Andhra Pradesh), and Sonipat (Haryana)
Milk procurement network covers Maharashtra, Andhra Pradesh, Karnataka, Tamil Nadu and nearby regions through village-level collection centres and farm partnerships
Pride of Cows available in select metros including Mumbai, Pune, Surat, Delhi, Ahmedabad, and Bangalore through direct-to-home and premium retail channels
Premiumisation & Business Moves
Value-added products form an increasing share of revenue as Parag focuses on higher-margin categories like whey protein, cheese, and premium milk
Investments in lactose and whey processing plants enhance vertical integration and by-product value capture
Strengthened focus on branding, traceability, ethical sourcing, and freshness to appeal to premium urban consumers
Expanding presence in modern retail and e-commerce while deepening reach in Tier II and Tier III cities to capture aspirational demand for premium dairy products

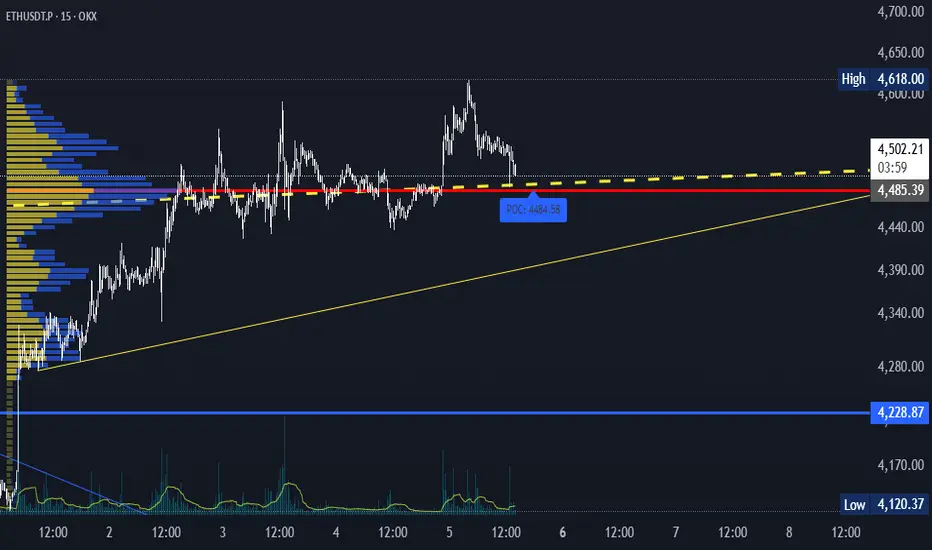
ETH long to 4506The Bearish Candlestick and Volume aren't strongdecline cannot continue cannot continue
so Long now to 4506

Netflix Buy Alert!! The Rising 3 Soldiers Candlestick Patterns I did my first stream about two days ago.I was so sacred and nervous.
"This is a public stream, I better make sure I know what am talking about. I better make sure I show the pips my very best setups for trading."
I tell you I was super depressed because I want to be a good trading leader.
So I have been grinding trying to make sure I perfect my trading strategy and system and skills.
Because I want to show you the best of the best trades I can find.
No more just forex...or stocks I just want to be a great
technical analyst.
So today I did another stream and I had one person watching me trade live.
If you watch me trade analysis live you will really enjoy it 👍😊
It was an awesome stream.This is my business goal to become a streamer.
But am hoping for more viewers tomorrow.
Look at Netflix NASDAQ:NFLX
It's
Above the 50 MA
Above the 20 EMA
Above the 200 EMA
Notice the rising 3 soldiers 🟩🟩🟩Bullish candlestick patterns?
Notice how the last green candle
Gaps up? In green 🟢
The candlestick patterns are your confirmation of entry.
Netflix also has an earnings report coming soon.
This makes it's a perfect candidate for what Tim Sykes calls an earnings winner.. according to his book penny stock guide.
They are rumours that Netflix will partner with Warner Music to make movies based on it's artists such as Bruno Mars.
This report hasn't been confirmed yet.
Do you see how pop culture is linked to the financial markets? Like I told you yesterday?
This is a great stock to trade and ride the 🚀.
Rocket Boost This Content To Learn More.
Disclaimer ⚠️ Trading is risky please learn about risk management and profit taking strategies.Also feel free to use a simulation trading account.

Stock Influencers + 3-Step Rocket Booster Strategy Some days back there was a superstar actress that did an advertisement
For this company.
It was full of nice imagery,but then this ad caused that big Gap up you see
To the left of this chart?
This famous actress, Sydney Sweeney, 👖caused that gap 🤔
Influence is a big part of the financial markets.Maybe you are thinking
Becoming a trader means
You old school and you won't roll with the "latest" pop trends.
But that won't be the case.
Infact trading and pop culture are very much related.You will be shocked.
Just check the breakingnews tab below the price on tradingview.
Financial markets will always be a part of pop culture. Why?
Because entrepreneurs and investors always work together.
Remember that I actually noticed that one of my followers comes from the Andrew tate community.
Yes man, 😊 am a mini - influencer in the financial markets.
So this skill is not a small thing rich people will value your knowledge the moment you master trading.
This pattern follows the 3 Step
Rocket 🚀 Booster Strategy:
👉The price has to be above 50 EMA
👉The price has to be above 200 EMA👉The price should gap up
That last step you can clearly see on the chart.
And what I love about this chart is that the support is clear. From the appearance of the gap.
This gives you confidence that the price wont go lower.
Liquidity is above 500K volume
The price is "sitting" on the 50 EMA.
I need to document this strategy because I want a 🔥 fire trading system that works.
Join me on this trading journey to discover a powerful trading system.
Disclaimer ⚠️ Trading is risky please learn about risk management and profit taking strategies.Feel free to use a simulation trading account before you use real money.

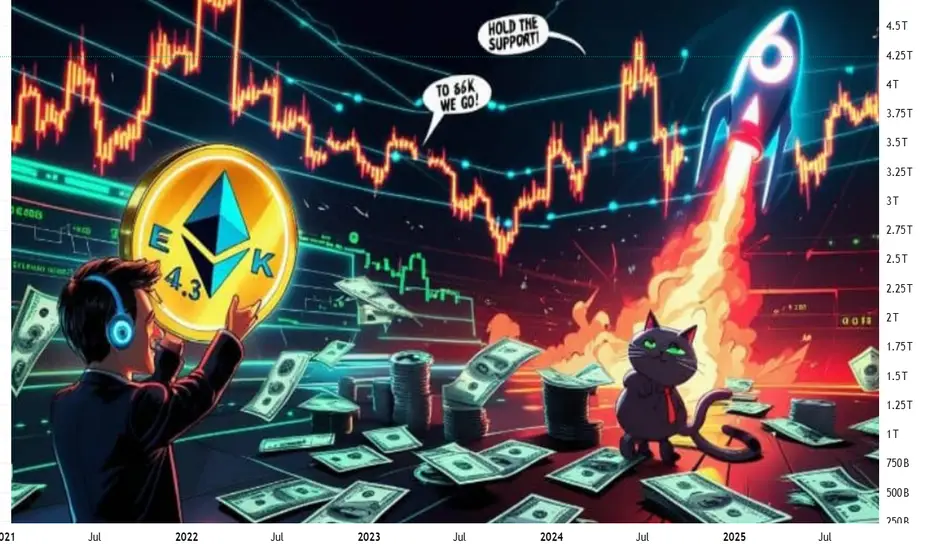
Ethereum Price Prediction: Samsung Staking and BitMine Treasury In October 2025, Ethereum (ETH) is poised for significant growth, driven by major catalysts like Samsung’s integration of ETH staking in Galaxy devices and BitMine Immersion’s massive treasury holdings. With ETH trading at $4,500 after a 23% rally, these developments signal strong demand, potentially pushing prices to $10,000 by year-end. Samsung’s partnership enables staking for over 200 million users, while BitMine’s 2.83 million ETH ($13.4 billion) underscores institutional confidence. This analysis explores these drivers, price predictions, and trading strategies for investors. Data as of October 7, 2025—position for ETH’s next surge.
Samsung Staking: Empowering 200M+ Users
Samsung’s integration with a major crypto platform allows Galaxy device owners in the US to stake ETH directly via a mobile wallet, offering zero trading fees and 5–7% APY. Targeting 200 million+ users, this feature simplifies staking, boosting retail adoption. Early data shows 75 million users gaining crypto access, with projected Q4 staking inflows of $500 million. This democratizes ETH participation, enhancing network security as the staking queue grows to 475,000 validators. The surge in retail staking could lift ETH prices by 10–15%, correlating 0.7 with Galaxy device sales.
BitMine Treasury: $13.4B ETH Holdings
BitMine Immersion Technologies holds 2.83 million ETH ($13.4 billion), the second-largest crypto treasury, with a recent $821 million purchase. Controlling 5% of ETH’s supply, BitMine’s strategy leverages immersion cooling for efficient mining and staking, signaling strong belief in Ethereum’s upgrades like Pectra. This reduces liquid supply, amplifying price sensitivity. Corporate treasuries, alongside $75.2 million net ETF inflows in September, support ETH’s price floor during corrections, with on-chain data showing a 15% increase in whale holdings.
Price Prediction for 2025: $4,685–$10,000
Analysts project ETH ranging from $4,685–$4,900 by mid-October, with bullish targets up to $10,000 on staking and treasury demand. Samsung’s 200M user base and BitMine’s holdings could drive a cup-and-handle breakout to $7,500. Futures open interest hit $61 billion, signaling momentum. Risks include regulatory delays or unstaking pressure (475,000 validators), potentially capping gains at $5,000. A 40% upside to $7,500 by Q4 is likely if adoption persists, with a 0.8 correlation to Nasdaq.
Trading Signals: RSI and MACD
Analysis uses RSI for momentum and MACD for trends, based on April 2025 uptrends:
ETH ($4,500): RSI at 58 (bullish above 55). Bullish MACD crossover (+0.15)—target $5,200 (15% upside). Fibonacci support at $4,200, resistance at $4,760. On-chain: Staking inflows +$500M.
LDO (staking proxy, $2.20): RSI at 60. Bullish MACD (+0.12)—target $2.50 (20% upside). Fibonacci support at $2.10, resistance at $2.40.
Overall: RSI 58–60 signals momentum—long at supports for 15–25% Q4 gains. Risks: Unstaking (5–7% dip); hedge with BTC.
How to Profit from ETH Demand
Capitalize on ETH’s catalysts:
Track Signals: Monitor RSI >60 and MACD crossovers for entries (e.g., ETH at $4,200), targeting 10–15% yields.
On-Chain Analysis: Follow staking inflows and treasury holdings via explorers for rally signals.
Portfolio Strategy: Allocate 20–30% to ETH, hedge with USDC at RSI >70 for 20% Q4 returns.
Education: Study staking mechanics and practice trades via demo platforms.
Conclusion: Ride ETH’s Surge
Samsung’s staking and BitMine’s $13.4B treasury fuel ETH’s rally, with $10,000 in sight for 2025. Track signals for breakout gains.
What’s your ETH price target? Comment below!
#EthereumPrice #Staking #CryptoTreasury #MarketTrends #CryptoInvesting
BNBUSDT — Bullish consolidation ahead of resumed uptrendThe bullish consolidation in BNBUSDT that I’ve been watching has begun to resolve in the market’s favor. Price action is coiling after two consecutive white spinning-top candles, a pattern that signals indecision but also a readiness to resume the prior trend when confirmed. The move has occurred on heavier volume concentrated in the current price area, and the pair sits roughly halfway between two key Fibonacci retracement levels — a location that commonly precedes a corrective bounce rather than a full trend reversal. Trend Strength sits just above zero, suggesting a fragile bullish bias rather than conviction.
Viewed on a slightly wider timeframe, BNBUSDT is grinding inside a shallow range that resembles a consolidation brick; the path of least resistance still leans toward the upside provided the short-term structure holds. Conventionally, the presence of consecutive indecisive candles on increased volume near mid-Fibonacci territory combined with a mildly positive momentum indicator favors a corrective rebound rather than an extended sell-off.
Key short-term levels to monitor on the way up are the 38.2% Fibonacci retracement as the likeliest target for the initial bounce, with a secondary cap at the 50% retracement if buyers show enough follow-through. Beyond those, a return toward prior highs remains plausible, though that area will present a zone of elevated resistance and will need clear volume-backed breakout confirmation to be trusted.
RSI and other momentum readings are consistent with a measured recovery rather than an impulsive surge, so expect the move to unfold over the coming 2–3 weeks. If the market fails to sustain above the 38.2% level and momentum turns down, the alternate scenario would be a continuation of the consolidation or a deeper retracement toward the lower Fibonacci boundary.
Short summary:
Setup : consolidation with two white spinning-top candles, heavier volume locally, price midway between two Fibonacci levels, Trend Strength slightly > 0.
Base case : corrective bounce to 38.2% (primary) — up to 50% (maximum) — then continuation higher toward prior highs (resistance zone).
Timeframe : ~2–3 weeks.

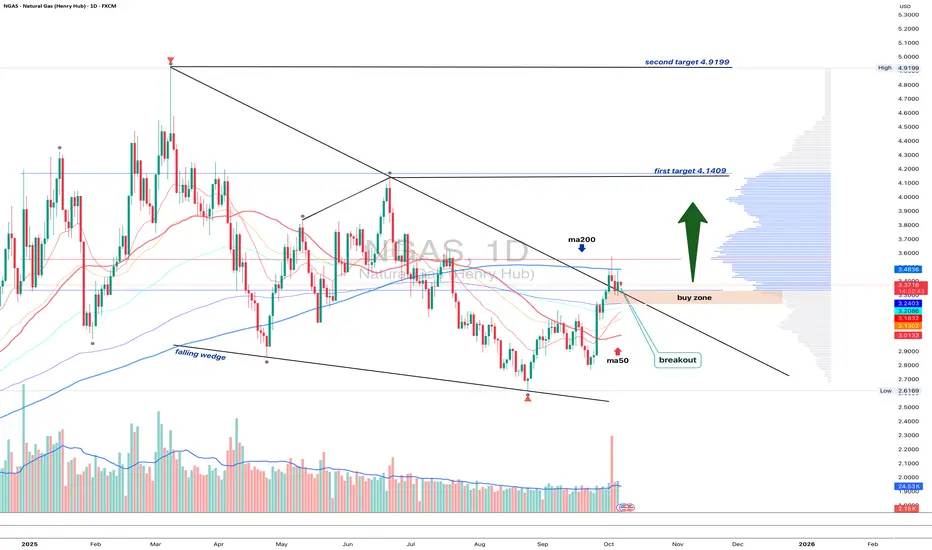
NGAS 1D - bulls waiting for the green lightOn the daily chart, Natural Gas has broken out of a falling wedge, but price remains below the MA200, while EMA still hovers above it - a mixed signal showing short-term hesitation within a longer-term downtrend.
The 3.10–3.20 buy zone remains key - that’s where the retest area aligns with short-term support. If buyers can reclaim the EMA and push above the MA200, the next upside targets are 4.14 and then 4.92.
Volume on the breakout supports growing bullish interest, while fundamentals - like rising seasonal demand - may soon add more fuel to the move.
Tactically , watch how price behaves near MA200. Once EMA flips back on top, momentum could accelerate fast. Until then, the market’s like a gas burner waiting for that click - ignition pending
Short Idea On Sugar (SB1!)Based On :
- Markov state still in bearish regime
- VP and Avwap levels
- Supply zone

EUR/JPY: Could This Demand Zone Spark the Next Bullish Move ?Price is testing a high-volume node at 173.450, where:
The AVWAP is acting as dynamic support
The Volume Profile shows strong accumulation
According to pattern analysis (based on historical data), similar setups delivered:
→ 8 wins out of 10 trades (80% win rate)
Not a guarantee — just a signal worth watching.
This is not financial advice. Past performance ≠ future results.

NQ 30-Min: Heavy Volume Zone Support at 24,680At 24,680, there’s a key support where buyers aggressively stepped in after sellers failed to push lower. This heavy volume zone marks the start of a new uptrend, and if price pulls back, I expect buyers to defend this area again with a strong reaction upward.

GBP/USD 30-Min: Gap Fill & Volume Resistance SetupAfter an opening gap, a heavy volume zone formed just behind it at 1.3475, aligning with a fair value gap. I’m waiting for a pullback to this level — when the gap fills and price reaches the start of that volume zone, I expect a reaction downwards. This resistance is strong enough to hold even if it takes a few days to trigger.

EUR/USD 30-Min: Gap + Volume Profile ResistanceAfter a gap up, a heavy volume zone formed just behind it at 1.1737—also last week’s POC. I’m waiting for a pullback to this zone to short, expecting a strong reaction once the gap fills, as this area aligns with the fair value gap and major resistance.

Continuation of the previous idea based on the Harmonious EnergyThe consolidation phase is coming to an end. The market structure is gradually moving into the next stage of the energy cycle, where a new flow direction is forming.
At the moment, I am observing a continuation of the energy movement with a noticeable manifestation of buyer strength. The key focus is on price behaviour near the resistance level — this is where it will become clear whether buyers will be able to maintain control and continue the upward momentum, or whether the market will enter a redistribution phase.
According to the GPE concept, this moment reflects the transition from balance to energy release — when the accumulated potential turns into real movement.
📌 Observation: price reaction to resistance and confirmation of the flow's strength.
💬 If you have any questions or would like to discuss the idea in more detail, I am always open to dialogue.

October 6 - October 10 2025For this week, my bias is neutral/leaning bearish, however I will not fight the trend if my technical indicators give clear bullish signals. I believe the government will stay shut down for a while, as both parties are at an impasse and the administration will use the shutdown as an opportunity to advance its agenda against the federal workforce and non-aligned spending programs, rather than make concessions early on. Unless the opposition is willing to abandon its position with little to no gain, the possibility of this ending soon remains low in my view. Official economic data is currently on hold, so for the time being the stock market is operating with little fundamental basis and as a result, technicals could carry more weight.
1. Macro
Data from the Federal Reserve is currently delayed or on an indefinite hold, making the Real Yield of bonds ambiguous. Regardless, not much has changed since last week. The Dollar is starting out slightly above average but still flat - which should continue since there will be no policy changes or inflation data during the shutdown.
Yields have remained relatively flat but the 10Y yield is rising at a faster pace than the 3M yield, which can be seen on the bottom left chart that shows the spread. I’m not reading into the technicals too much here, however it will be important to see if this makes a higher high (spread widening, 10Y rising and/or 3M falling) or a lower low (spread tightening/inverting). Neither would be a particularly good sign but the former would likely be better received than the latter when it comes to stocks. As with the dollar, I think yields will remain relatively flat for the same reasons, which will prevent bond-market moves from being a driver.
My sentiment on commodities is roughly the same. Gold continues to rally, Oil may be in a downtrend, Copper ripped higher, and Corn stayed flat. Aside from Gold, I do not see anything on the charts of these commodities to provide a clear indication of a change in the growth or inflation outlook.
2. FX
Nothing new and worthy of note here. Yield spreads in the US and Britain (Black, Red) remain tight compared to elsewhere, but the higher yield may be a tailwind keeping the dollar steady. Over the past three months, the dollar has performed sightly better proportionately compared to other currencies, however it is still down significantly on the Year.
3. Risk
The top left chart is the option-adjusted spread of High Yield and Investment Grade corporate bonds indexed to 100. I’m not seeing an upside movement developing here yet (risk-off signal). On the middle chart, S&P Futures continue to significantly underperform Gold, fueled by the Gold rally and S&P making incremental gains. On the top right, I am starting to track the $NQ1!/YM1! spread to see how the mega caps are performing against companies in more traditional industries. Here it is clear that ever since the market bottomed in April, Nasdaq has been significantly outperforming the Dow Jones, however it appears this spread is set to tighten - either by Dow rising while Nasdaq stays flat/falls or Nasdaq falling proportionately more than Dow.
Notice how the Nasdaq/Dow curve started to flatten around the same time that Gold started to significantly outperform the S&P. I think this is an indicator that growth stocks will see pressure in the near future, and that we may currently be seeing rotation into safer sectors . This is evident in the outperformance of Industrials, Financials, Healthcare, and Utilities compared to growth sectors like Tech last week.
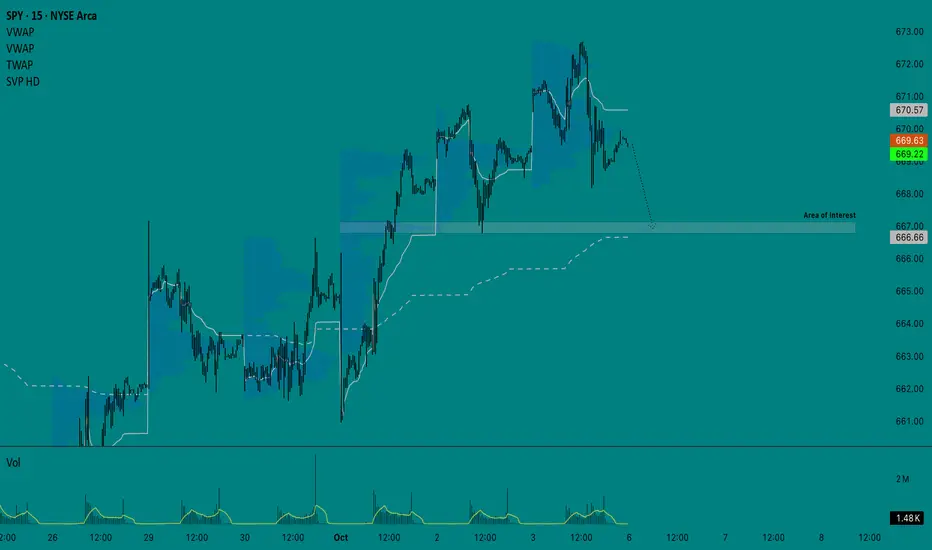
4. Options Chain
Gamma flip-flopped last week, making options data a misleading indicator unless you’re really in the know. With little fundamental backing, I expect dealers will assert more control than what is typical. Friday ended with most of the calls on volume getting taken out while paying some puts. Heading into this week, gamma on AMEX:SPY should keep the price from rising above $672 or falling below $665 on Monday .
5. Bias
I’m going to split these screenshots up to make it easier to see what I’m looking at.
On my technical indicator chart, last week’s Weekly CVD (black) did not see a strong directional movement, although it remained below the zero line for most of the week, suggesting order flow favored the sell side despite the price reaching new ATHs.
Anchored OBV also suggests that last week was a battle between both sides.
Line break is great as a momentum indicator and has been flipping between both sides since October 1st. CME_MINI:ES1! will need to make a new ATH and break above the resistance and close on the 1h timeframe to print a bullish bar, so right now I think the momentum is more to the downside.
On Renko, which is my main chart, taking a purely technical read using the Wyckoff Method, I think this structure is bullish overall unless we see a swift move to the bottom of the range. Otherwise, it is fairly likely that we will at least see a pull back into the range. VWAP is set to Monthly to show we’re still above but could see a trend shift in the monthly frame of reference by breaking below it. How the price respects this range will be important to watch.
Lastly, when looking at the 4h chart on VIX, it appears to be coiling although it has remained mostly flat. VIX is outperforming its on volatility and the volatility of bonds, suggesting that any spikes are not part of larger risk-off positioning yet.
——————
My overall interpretation for this week is that although the Macro side remains roughly unchanged, I still retain my bias that the market is positioning for disappointing growth and clearly continues to show a preference for gold over stocks (heavy hedging). The absence of data reports due to the shutdown that could have validated these concerns (notably payrolls) have allowed dealers to assert more control over the price. For this reason, I will keep a close eye out for any changes and will adjust if the technicals on my Bias chart support a bullish position, but for now my near-term short target is to move back down to $666 .
Trading idea based on the Harmonious Energy Flow (HEF) conceptAt the current stage, there is a clear manifestation of buyers’ strength, even though the market environment is changing rapidly without any significant price movement. This forms a state of consolidation, where energy is being accumulated for the next impulse.
According to the HEF concept, consolidation represents a transitional phase — the market is searching for balance before initiating a new wave of directional movement. My current expectation is focused on the moment of breakout from consolidation, when the market will reveal the true side of strength.
📌 Main focus: observing how buyers maintain their advantage within this narrow structure and waiting for a signal confirming the exit from balance.
If you find my charting approach interesting, you are welcome to connect and discuss further. I’m open to communication and collaboration.
Would you like me to refine this version for maximum stylistic alignment with TradingView’s publication tone (slightly shorter, more analytical, and visually structured)?
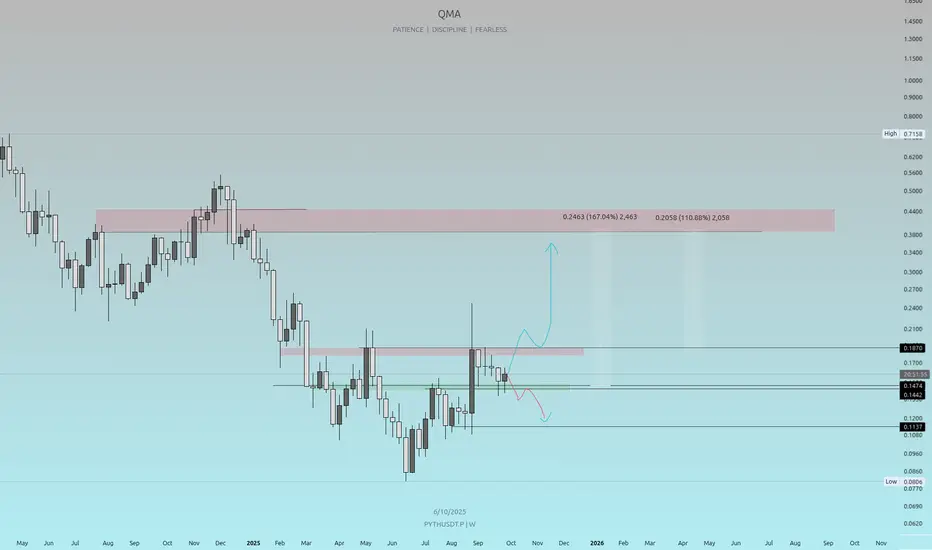
PYTHUSDT Weekly Analysis Is PYTH breaking out for a strong move up or gearing for a correction? This analysis identifies key levels to watch for high-probability entries and exits.
Price Levels to Watch:
Resistance Zone: $0.44–$0.50 (major supply area)
Intermediate Resistance: $0.1870
Current Price Support: $0.1445
Support Zone: $0.1137
Scenarios:
🔵 Bullish: Break and hold above $0.1870 could trigger a move to $0.44+. Possible gains over 100%!
🔴 Bearish: Failure to hold $0.1445 support may lead to retest of $0.0860 region.
Why This Setup?
Clear supply/demand zones highlight significant trader interest.
Weekly timeframe support/resistance for swing trading opportunities.
Focus on patient, disciplined entries with risk management
Wyckoff Distribution schematicsThis count is based on my assumptions so anything can happen not a trading or financial advice just for educational purposes only kindly do your own ta thanks trade with care good luck.

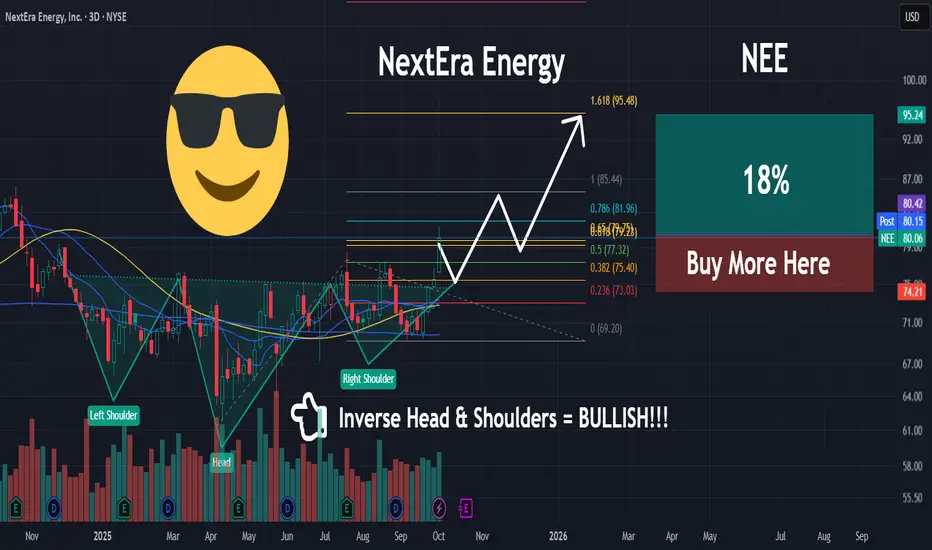
NEE | Utilities STRONG | LONGNextEra Energy, Inc. engages in the provision of renewable energy. It operates through the following segments: FPL and NEER. The FPL segment involves the generation, transmission, distribution, and sale of electric energy in Florida. The NEER segment produces electricity from clean and renewable sources, including wind and solar. The company was founded on December 28, 1925 and is headquartered in Juno Beach, FL.

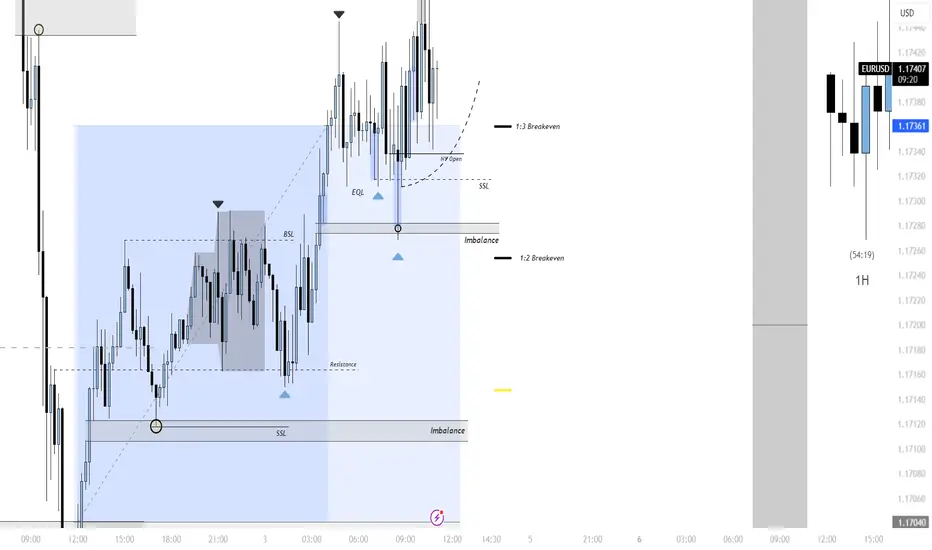
Absence of Institutional Liquidity: Retail Liquidity DrivenThis trade played out cleanly by following the institutional narrative of orderflow and liquidity. Price first dropped into a key demand zone where bullish orderflow emerged, reclaiming imbalance and holding structure. Liquidity was engineered through sweeps of equal lows (SSL/EQL), confirming buyers’ strength before expansion. The move higher was driven by the natural draw on liquidity resting above equal highs and into the Supply + POC zone, providing a clear target. Risk was managed with 1:2 and 1:3 breakeven levels after imbalance mitigation and the New York open alignment, locking in profits while allowing room for continuation. In short, the win came from combining demand absorption, liquidity sweeps, imbalance fills, and auction flow logic to anticipate where institutions would drive price next.
NVS Bullish Continuation LongThis looks super bullish
If we get a flat to lower open tomorrow, would be a good market entry
Best entry price around 110-108
TP1 133
TP2 154
This is a longer term play I would not expect this to play out in a couple weeks
