NZD/USD updateThis is my updated position in NZD/USD
Still waiting...
Most money is made by sitting on your hands
Waiting

SEACERA - Seeking New Direction Above MA200SEACERA - Just recently broke out from MA200 with widening Bollinger Band, MACD & RSI both still in their bullish trajectory. We anticipate the stock is now trying to complete its consolidation formation within the symmetrical triangle drawn in the chart, any chance to breakout shall unleash fresh bullish momentum towards 0.315, support observable at MA200/ 0.245. Please note: PN17 counter is highly risky to trade.

NTPM - Technical Rebound & Testing for BreakoutNTPM - Bullish candle with substantially strong buying interest, affirming the stock support at MA50/ 0.415, indicators are pointing for further upside. Further trading interest shall propel the stock towards MA200. Any chance to breakout from MA200 will generate stronger momentum for the stock. Next resistance at 0.49.

Gold weekly plan (September 2019 )Now Gold can go both side.
After Market open we will see direction again with two criteria.
Important zone is 1517-1520 , I will open position after market show
Left Strong bullsih bias.
If Gold can stand upper 1517-1520 zone and break Green line we will follow to next res.
*** invalid when drop below red line.
Right - Bearish bias
Weekly TF : Shooting star
Lower TF : Double top + Descending triangle + Break down and finish retest trendline.
Target
- 1508
- supp. zone 1495-1505 ( 1502.2)
- 1483
- 1475 or hit Dot Trend line
**************************************************************************************
After two chart , you will see Gold , have many signal to drop.
for retracement (but Long trem trend still bullsih.)
Gold can go to new high ? maybe because of Trade war , news ,....
but no one can congfirm , I only trade when see which direction is more possibility to win.
It depend on yr stategy (day trade or ...) to trade.
Wait till market move after that I will follow again

USDCAD - Waiting for Reversal PatternHi Traders!
The market was just moving up for the recent candles.
Now it reaches the next resistance level.
We expect the market to pull back.
We recommend to sell with a risk-to-reward ratio of 1 to 4.5.
But wait for the reversal pattern :)!
Thanks and good luck!

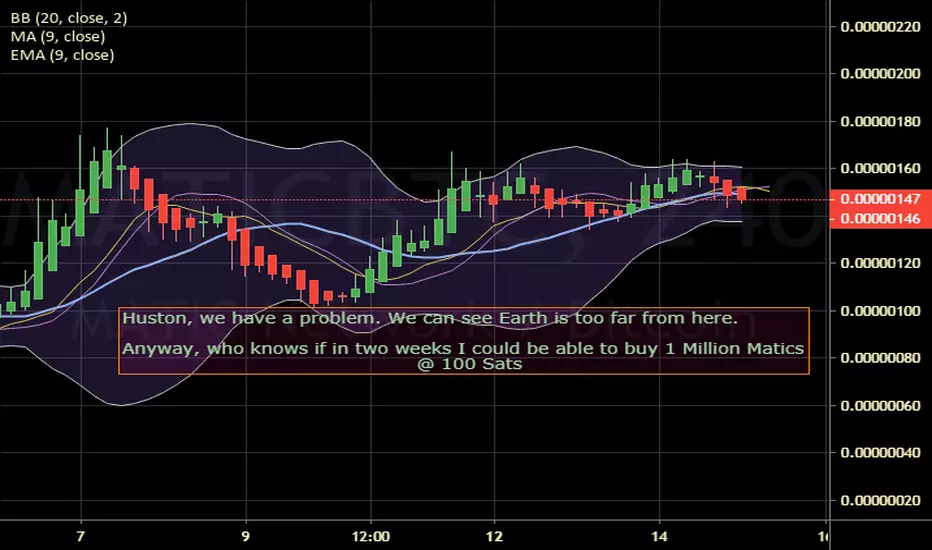
I am waiting for my good luck So far so good, it look like if Matic price is waiting for my good luck to work out as first wished,
and I might be able {in a couple of weeks} to buy my ONE MILL Matic by the end of this month. ...
Hoping that by DEC. 2020 I will have enough profit there as to say Good bye for a while.
This is what I like about The Market:
It doesn't matter how much you hope or wish for,
the bloody thing will go its own way.


All it means is: That the money coming in is less than the bulk going out, with MATIC... it is impossible to predict anything, it seems to dance at its own music at this low levels.
AUDUSD waiting signalAUDUSD pulling back to the support zone it did not break before shooting up
If it breaks that zone, the signal becomes invalid.


GBPJPY waiting for breakoutflag partten has been formed, a breakout will be a confirmation for a buy or sell

USDJPY waiting BUY signalTendency => upwards
USDJPY loosing its momentum after it has reached its resistance zone and therefore going back to re-test the support zone before shooting up
Stoch confirming that USDJPY has been overbought

Why are you failing? part 3 Money ain't a thangHave you ever had one of those days where everything was going right? You waited for the right setup, you had great position size, and everything went perfect.You made some great money and you feel so good about yourself. You start to think you’re a genius.You start doing the Mcgregor walk and screaming money ain’t a thang.This then leads you on into breaking all the rules like not waiting for the right setups! After that win you start telling yourself well what if I can do this at every hour I would be rich in no time.This can kill your trading account ,and over trading could be one of the reasons why you may be failing.
Quote: "If investing is entertaining, if you're having fun, you're probably not making any money. Good investing is boring." -George Soros
Trader Essentials from Amazon
1. amzn.to -Tylenol Extra Strength Rapid Release (LOL)
2. amzn.to -Encyclopedia of Chart Patterns
3. amzn.to -Apple MacBook Pro
4. amzn.to -OLLY Goodbye Stress Gummy,


Waiting signal on EURNOKif the EURNOK manages to break its major resistance zone at 9.87311 then it will be a buy until its previos major resistance zone at 10.03895
or if it is rejectecting that level and giving any reversal sign then we can sell.

Waiting sell signal on EURNOKThe EURNOK shows that is it on a downtrend on daily timeframe
Therefore I am expecting it to touch the outer trendlin since the inner trendline has been broken meaning it is going to re-test on the resistance
zone at 1.74046 and should make a touch on the outer trendline.

Let it fall - on a day chart we are bearish
- currently we see a sideways market
-we could get a bounce off the support line
- Market turned at this level previously
- Circle market in blue is an area of interest.
- Things to look into would be CADJPY as these pairs act the same to an extent
Check out the analysis of CADJPY

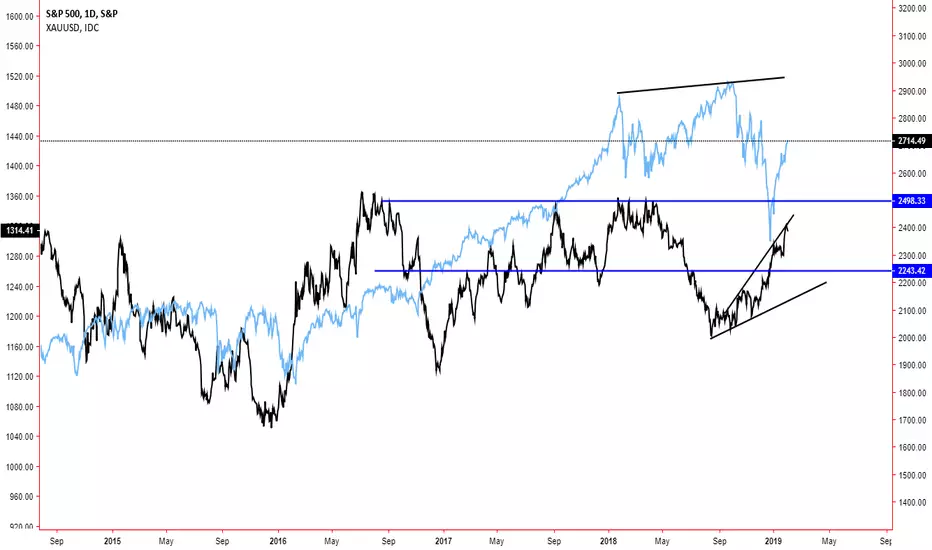
SPX Vs. Gold. Comparison If SPX is moving higher, i will be looking at a Short position in gold.
The same apply to the the declining price of the SPX, i will be looking for call positions for gold.
Levels to look for here is the 1350-1360, 1280 - 1300.
Right now, i see a fall in risk appetite, and therefore a rise in gold. Waiting for the right timing to enter a long position on gold. The price could rise for the SPX to test the highs, before we could see downturn. While gold prices could also decline to 1280, before moving upward.
Will update when the time is coming :)
Also look for the US10Y. A falling Yield indicates more influx of money to the bond market and less for the stock market.

The Loonie in troubleIn this screencast I show how waiting for a key position in the market is good idea. As I always say, 'Stalk 90% trade 10%'.
The CAD - often referred to as 'the Loonie' (not by me) has been in some trouble across many currency pairs. I'm not interested 'why'. All I care is where the trend is going and key areas of opportunity and probability.
As strange as it sounds, not trading is actually a winning strategy. So for newtraders especially, don't feel that if you're not in a trade that you're missing something. You are actually wise.

EURJPY Anticipating further downfallWaiting for the test of support and fib. if it breaks, wait for hour candle to close first and assess best entry point.

