EURUSD Long As the war escalated over the weekend market gapped during Asia session invalidating our initial forecast. (Linked Idea). Looking for the long on EURUSD.
WAR

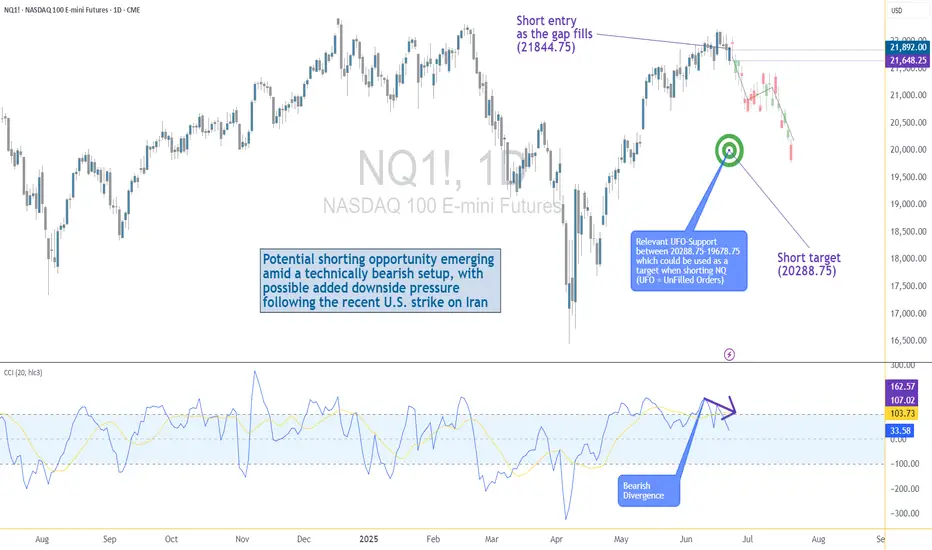
US–Iran Conflict Triggers a Potential Nasdaq Bearish Setup🟣 Geopolitical Flashpoint Meets Technical Confluence
The U.S. weekend airstrike on Iranian nuclear facilities has reignited geopolitical instability across the Middle East. While broader markets often absorb news cycles quickly, high-beta assets like Nasdaq futures (NQ) tend to react more dramatically—especially when uncertainty meets existing technical vulnerability.
Monday’s session opened with a notable gap to the downside, reflecting immediate risk-off sentiment among futures traders. While the initial drop is being retraced intraday, historical patterns suggest that such gap-fills can often serve as ideal shorting zones—particularly when other bearish signals confirm the narrative. The backdrop is clear: this is no ordinary Monday open.
🟣 Bearish Divergence on CCI Builds the Case
From a technical standpoint, the setup gains weight through a clear bearish divergence on the Commodity Channel Index (CCI) using a 20-period setting. While prices recently pushed higher, momentum failed to follow—an early indication that buyers may be running out of steam. This divergence appears just as price approaches the origin of Friday’s gap, a level that frequently acts as a resistance magnet in such contexts. This confluence of weakening momentum and overhead supply aligns perfectly with the geopolitical catalyst, offering traders a compelling argument for a potential reversal in the short term.
🟣 Gap Origin: The Line in the Sand
The origin of the gap sits at 21844.75, a price level now acting as potential resistance. As the market attempts to climb back toward this zone, the likelihood of encountering institutional selling pressure increases. Gap origins often represent unfinished business—zones where prior bullish control was suddenly interrupted. In this case, the added layer of global tension only strengthens the conviction that sellers may look to reassert dominance here. If price action stalls or rejects at this zone, it could become the pivot point for a swift move lower, especially with bearish momentum already flashing caution signals.
🟣 Trade Plan and Reward-to-Risk Breakdown
A potential short trade could be structured using 21844.75 as the entry point—precisely at the gap origin. A conservative stop placement would rest just above the most recent swing high at 22222.00, offering protection against a temporary squeeze. The downside target aligns with a prior UFO support area near 20288.75, where demand previously showed presence. This sets up a risk of 377.25 points versus a potential reward of 1556.00 points, resulting in a reward-to-risk ratio of 4.12:1. For traders seeking asymmetrical opportunity, this ratio stands out as a strong incentive to engage with discipline.
🟣 Futures Specs: Know What You’re Trading
Traders should be aware of contract specifics before engaging. The E-mini Nasdaq-100 Futures (NQ) represent $20 per point, with a minimum tick of 0.25 worth $5.00. Typical margin requirements hover around $31,000, depending on the broker.
For smaller accounts, the Micro Nasdaq-100 Futures (MNQ) offer 1/10th the exposure. Each point is worth $2, with a $0.50 tick value and much lower margins near $3,100.
🟣 Discipline First: Why Risk Management Matters
Volatility driven by geopolitical events can deliver fast gains—but just as easily, fast losses. That’s why stop-loss orders are non-negotiable. Without one, traders expose themselves to unlimited downside, especially in leveraged instruments like futures. Equally critical is the precision of entry and exit levels. Acting too early or too late—even by a few points—can compromise an otherwise solid trade. Always size positions according to your account, and never let emotion override logic. Risk management isn’t a side-note—it’s the foundation that separates professionals from those who simply speculate.
When charting futures, the data provided could be delayed. Traders working with the ticker symbols discussed in this idea may prefer to use CME Group real-time data plan on TradingView: www.tradingview.com - This consideration is particularly important for shorter-term traders, whereas it may be less critical for those focused on longer-term trading strategies.
General Disclaimer:
The trade ideas presented herein are solely for illustrative purposes forming a part of a case study intended to demonstrate key principles in risk management within the context of the specific market scenarios discussed. These ideas are not to be interpreted as investment recommendations or financial advice. They do not endorse or promote any specific trading strategies, financial products, or services. The information provided is based on data believed to be reliable; however, its accuracy or completeness cannot be guaranteed. Trading in financial markets involves risks, including the potential loss of principal. Each individual should conduct their own research and consult with professional financial advisors before making any investment decisions. The author or publisher of this content bears no responsibility for any actions taken based on the information provided or for any resultant financial or other losses.
Review and plan for 24th June 2025Nifty future and banknifty future analysis and intraday plan.
This video is for information/education purpose only. you are 100% responsible for any actions you take by reading/viewing this post.
please consult your financial advisor before taking any action.
----Vinaykumar hiremath, CMT

Beyond the Headlines - Gold Outlook June 16-20, 2025Beyond the Headlines: Gold's Ascent Amidst Global Shifts & Key Technicals 🌐🚀
Everything about the last week can be found here:
OANDA:XAUUSD 💰📈
We all know what's going on, I believe. Israel struck Iran 💥, and this conflict will likely take a bit before things cool down. 🥶
---
## Geopolitical News Landscape 🌍📰
### Israel / Iran
Since June 12, Israel launched "Operation Rising Lion," targeting Iranian nuclear sites like Natanz and Esfahan – over 128 killed, Iran claims. 🇮🇷 retaliated with missile and drone strikes on Haifa and Tel Aviv, killing at least 10. 🚀
**Outlook:** 🔥 Tensions are spiraling. Without urgent mediation, full-scale regional war remains a real risk. 💣
### India / Pakistan
Since the May ceasefire, few clashes have occurred. However, both navies increased readiness, signaling potential escalation at sea. 🚢
**Outlook:** ⚖️ Peace is fragile. A strategic dialogue is key to avoiding a renewed border or maritime conflict. 🙏
### Gaza Conflict
Between June 7–15, Israeli strikes killed at least 41 Palestinians, including 8 near an aid center in Rafah. Over 55,000 total deaths, and famine is looming. 💔
**Outlook:** 🆘 Gaza remains a humanitarian catastrophe. Global pressure for access and a ceasefire must intensify. 🕊️
### Russia / Ukraine
June 13–15: Russia returned the bodies of 1,200 Ukrainian soldiers in a rare POW swap gesture. 🤝 Fighting remains intense in Sumy and Toretsk; Russia hit a major oil refinery. 🏭
**Outlook:** 🕊️ While symbolic moves continue, no peace is in sight – battlefield outcomes will shape diplomacy. ⚔️
### U.S. - China Trade War
The U.S. hiked tariffs to 55% on key Chinese goods. 🇺🇸🇨🇳 responded with 10% on U.S. imports. Talks yielded a partial truce, but military-use rare earths remain unresolved. 💻
**Outlook:** 🔧 Tech remains the battleground. Without progress on critical materials, the trade war may deepen. 📉
### Global Trade War
The OECD revised global growth downward due to rising tariffs from the U.S. targeting 🇨🇳, 🇲🇽, 🇨🇦. Global trade volume is expected to shrink by 0.2–1.5%. 📉
**Outlook:** ⛓️ Supply chain disruption is spreading. Global trade will stay under pressure without coordinated policy. 🌍➡️🌍
### Trump vs. Powell
Trump labeled Powell a "numbskull" for not cutting rates, suggesting he might "force something" if re-elected. 🗳️ The Fed maintains policy independence ahead of a critical June decision. 🏛️
**Outlook:** ⚔️ Political pressure on the Fed is mounting. Expect more friction as the election cycle heats up. 🔥
### U.S. Inflation
CPI rose 2.4% YoY in May (from 2.3%); Core CPI held steady at 2.8%. Monthly growth was modest at 0.1%. Key rises were seen in healthcare and vehicle prices. 🚗🏥
**Outlook:** Inflation is stable but sticky. 🚦 The Fed will likely hold rates steady until clearer disinflation signals appear. 📊
---
## Technical View 📐📈
### Market Structure:
Gold shows a clear **bullish market structure** with higher highs and higher lows. ⬆️ Recent price action suggests we're in a strong uptrend with institutional buying pressure. 🏦
### Key Levels:
* The chart shows a significant low around the **$3,245 area** (marked as "Low") which could act as a key institutional support level. 💪
* The current high near **$3,446** represents a potential institutional resistance zone. 🛑
* Look for potential **order blocks** around the **$3,380-$3,400 range** where price consolidated before the recent breakout. 🧱
### Fair Value Gaps (FVG):
There appear to be several gaps in the price action during volatile moves, particularly during strong rally phases. These could act as future support/resistance areas. 📉📈
### Gann Analysis:
The price movement shows strong adherence to Gann principles:
* The rally from the low follows a steep angle, suggesting strong momentum. 🚀
* Key Gann angles would place support around the **$3,300-$3,320 zone**. 📐
* The current price near **$3,436** is testing natural resistance levels based on Gann square calculations. 📏
### Fibonacci Levels:
From the significant swing low to the current high:
* 23.6% retracement: ~$3,395 📉
* 38.2% retracement: ~$3,370 📉
* 50% retracement: ~$3,345 📉
* 61.8% retracement: ~$3,320 📉
The golden ratio levels suggest key support on any pullback would be around the **$3,370-$3,345 zone**. ✨
### Institutional Levels:
* **Weekly/Monthly Levels:** The **$3,400** and **$3,450** areas appear to be significant institutional levels based on round numbers and previous price action. 🏦💰
* **Smart Money:** The accumulation pattern before the breakout suggests institutional participation. 🧠💡
### Cycle Timing:
Based on the timeframe (appears to be 30-minute bars from May 26-June 15):
* We're seeing approximately **3-week cycles** in the major moves. 🗓️
* The current rally phase appears to be in its mature stage. 🌳
* The next potential cycle turn could be approaching, suggesting caution for new longs at current levels. ⚠️
---
### Trading Considerations:
* Watch for rejection at current levels near **$3,446**. 📉
* Key support confluence around **$3,370-$3,345** for potential re-entry. 🎯
* Volume and momentum divergences would be critical for timing any reversal. 📊🔄
Other indicators tend to show bullish scenario enhancements. 🚀
Gold has formed a ** Standard Bullish Flag pattern ** over a time from early April till today. 🚩🐂
Also, the structure of a ** reverse Head & Shoulders ** is existing and has broken the neckline! 🔄🗣️
Another indicator is an existing "** Ascending Bull Flag **." ⬆️🚩
Please take the time to let me know what you think about this. 💬
-------------------------------------------------------------------------
This is just my personal market idea and not financial advice! 📢 Trading gold and other financial instruments carries risks – only invest what you can afford to lose. Always do your own analysis, use solid risk management, and trade responsibly.
Good luck and safe trading! 🚀📊

ETH - Do you Notice a Pattern here? I DO...Hello TradingView Family / Fellow Traders. This is Richard, also known as theSignalyst.
📈I find ETH 4h chart as it looks like history repeating itself.
Previously in 1 to 5 June, it formed a slight lower low before starting the next big bullish impulse leading towards the upper bound of the channel.
📚 Today, ETH just formed the slight lower low we are looking for.
Is it time for the next bullish impulse to start? well it will be confirmed after breaking above the last major high at $2,600.
What do you think?
📚 Always follow your trading plan regarding entry, risk management, and trade management.
Good luck!
All Strategies Are Good; If Managed Properly!
~Rich

Nightly $SPY / $SPX Scenarios for June 20, 2025🔮 Nightly AMEX:SPY / SP:SPX Scenarios for June 20, 2025 🔮
🌍 Market-Moving News 🌍
🏦 Fed Holds Rates, Warns on Tariffs
Fed kept interest rates steady on June 19, cautioning that tariffs could stoke inflation and slow growth. Inflation projections were raised from 2.7% to 3.0%, while growth estimates were revised lower to 1.4%
🌍 Middle East Risk Drags Markets
Global stocks fell and safe-haven assets surged after U.S. futures weakened amid heightened tensions in the Israel–Iran conflict. Yields were mixed: gold weakened and bonds gained, while oil held steady near seven-week highs
📈 Treasury Yields Edge Higher
Despite safe-haven demand, U.S. 10‑year yields ticked up as markets absorbed the Fed’s updated rate outlook. The yield curve remains elevated ahead of next week’s $38 bn auction of long-dated notes
📊 Key Data Releases 📊
📅 Friday, June 20:
(No major U.S. economic reports)
Markets will be driven by Fed commentary follow-ups and geopolitical headlines over the weekend.
⚠️ Disclaimer:
This information is for educational and informational purposes only and should not be construed as financial advice. Always consult a licensed financial advisor before making investment decisions.
📌 #trading #stockmarket #economy #geopolitics #fixedincome #inflation #charting #technicalanalysis

Potential Gold LongWith Volatile Markets and constant War Developments
XAU/USD has experienced higher than NORMAL volatility.
Given price can RESPECT this short term trendline, we may have a Target of 3,500 in sight.
2 weeks of Bullish Momentum now followed by a beautiful retracement & Strong Wicks below.
SL - 3,355
TP 1 - 3,440
TP 2 - 3,470
TP 3 - 3,496

XAUUSD - 4H Breakout and Retest Setup🟡🟡🟡
🕒 June 17, 2025
Bias: Medium-Term Bullish
Structure: Breakout → Retest → Continuation
Context: Trendline break + confluence with EMA + prior resistance turned support
🔍 Market Structure Insight:
Major descending trendline broken with strong impulsive momentum.
Pullback held at the intersection of:
Broken trendline retest
EMA 60 dynamic support
Bullish structure of HL-HH (Higher Low / Higher High)
Strong bullish candle at support
✅ Trade Plan – Buy Stop Setup
Entry (Buy Stop): 3402
SL: 3373 (below the pullback structure + EMAs)
TP1: 3430 (local resistance area)
TP2: 3470 (measured move from previous leg height)
#XAUUSD #Gold #TechnicalAnalysis #BreakoutSetup #Forex #EMA #SqueezePlay #TrianglePattern #tradingview #MJTrading

Hold on, here is the real deal.District court ruling on the joint motion (June12) still pending—no update yet.
Judge Torres’ ruling – could come any day; depends on district court docket.
Appeals proceedings remain on hold until at least August 15, 2025.
XRP spot ETF decisions delayed:
SEC ETF decisions, comment periods suggest
Franklin Templeton: very likely by late July
ProShares: by June 25
Grayscale: likely October
Bitwise: through June to October
CPI must fall under 2.0%
Oil must retrace to the $70s
Fed must signal a real cut, not conditional pause
DXY must fall below 103
Current War that we all are focused is going to be ended swiftly.
Until then, Hold Your Horses!

Gold Supported by Central Bank Demand Despite Global UncertaintyGold Prices Likely Supported by Central Bank Demand
Gold prices are expected to find continued support from strong central bank buying. Since the start of the Ukraine war, average annual central bank gold purchases have doubled from 500 to 1,000 tons.
The primary drivers remain gold’s role as a crisis hedge, portfolio diversifier, and store of value.
While de-dollarization is not an explicit motivation, many central banks anticipate a gradual decline in the U.S. dollar’s share of global reserves.
Technical Outlook:
Gold remains in bullish territory as long as it trades above 3365. This supports a move toward 3403, and if the price stabilizes above that level, the uptrend may extend toward 3430 and 3448.
A break below 3364 would invalidate the bullish structure and shift momentum downward, with potential targets at 3347 and 3322.
Key Levels:
• Resistance: 3403 / 3430 / 3448
• Support: 3365 / 3347 / 3322

The Bitcoin Manipulation Trick - How They Lure You Into the Trap📉 Bitcoin spends more time in deep drawdowns than at its peaks. Historically, BTC has spent over 80% of its existence trading 80-90% below its all-time highs, yet people keep falling for the illusion of wealth.
🧐 Here’s how the cycle works:
1️⃣ They drive up the price to make it enticing for new buyers.
2️⃣ You FOMO in at the highs, believing in the "next big wave."
3️⃣ Then they crash it, wiping out weak holders.
4️⃣ They keep it suppressed for years, forcing everyone out, via margin calls, financial strain, or sheer exhaustion.
5️⃣ When enough have capitulated, they restart the cycle.
📊 Historical Evidence:
- 2013 Crash: Over 400 days down 80%+ before recovery.
- 2017 Crash: Nearly 3 years below 80% of ATH.
- 2021 Drop: More than a year stuck 75% below peak.
🔎 If you’re buying now, be ready to:
⛔ Lose access to your money
⛔ Keep covering margins
⛔ Wait years for recovery, if it ever happens …
They play the same trick, every time. If you don’t recognize it, you’re just another part of the cycle. 🚀🔥
INDEX:BTCUSD NASDAQ:MARA NASDAQ:COIN NASDAQ:TSLA TVC:GOLD TVC:SILVER NASDAQ:MSTR TVC:DXY NASDAQ:HOOD NYSE:CRCL

GOLD - WAVE 5 BULLISH TO $3,622 (UPDATE)Gold is currently going through a strong 'accumulation' phase for buyers, hence why we're seeing these choppy price actions, trying to liquidate buyers. It won't surprise me if we see dips lower, but overall we remain bullish as long as Gold is ABOVE THE WAVE 2 LOW. Breaking below this low, will invalidate bullish structure.
Wave 2 Invalidation Level - $3,245❌

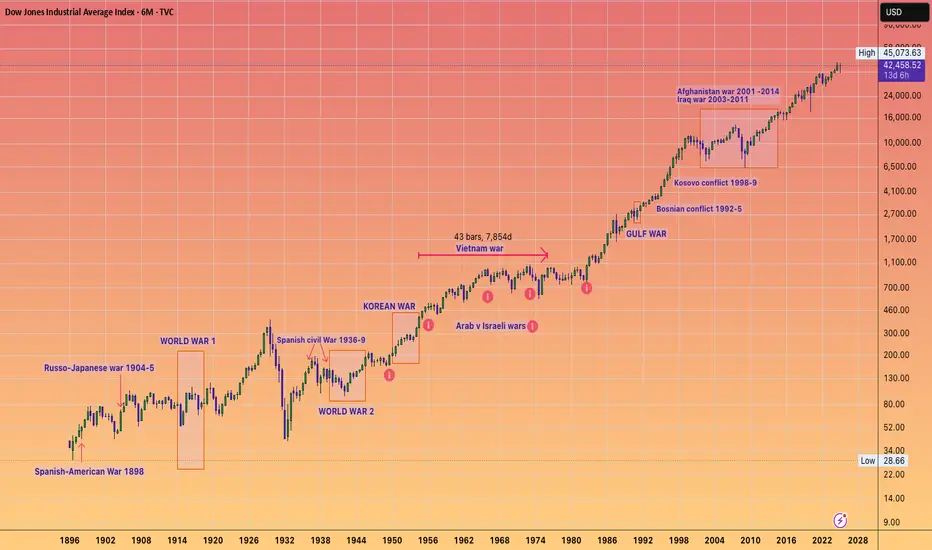
Don't SELL your bags Because of WAR FUDThey just end up turning up the money printer anyway...
DJI set amongst the major wars and conflicts the past century...
( I could have added way more wars to this chart but it would have been difficult to read all of them )
Gold Cooling After Spike – $3375 Key Level to WatchBy analyzing the gold chart on the 4-hour timeframe, we can see that after surging to $3450 amid the Iran–Israel conflict, gold faced a pullback following a liquidity sweep above that level.
Currently, gold is trading around $3392, and after a potential correction down to $3375, I expect to see further upside movement.
⚠️ Stay cautious — gold remains highly volatile and sudden moves are likely!

BTC is Bullish!Hello TradingView Family / Fellow Traders. This is Richard, also known as theSignalyst.
📈BTC has been overall bullish trading within the rising channel marked in blue.
Moreover, the red zone is a strong structure!
🏹 Thus, the highlighted blue circle is a strong area to look for buy setups as it is the intersection of structure and lower blue trendline acting as a non-horizontal support.
📚 As per my trading style:
As #BTC approaches the blue circle zone, I will be looking for bullish reversal setups (like a double bottom pattern, trendline break , and so on...)
📚 Always follow your trading plan regarding entry, risk management, and trade management.
Good luck!
All Strategies Are Good; If Managed Properly!
~Rich

ETH is doing it AGAIN!Hello TradingView Family / Fellow Traders. This is Richard, also known as theSignalyst.
📈ETH has been overall bullish trading within the flat rising channels marked in blue.
Moreover, the green zone is a strong support zone!
🏹 Thus, the highlighted blue circle is a strong area to look for buy setups as it is the intersection of support and lower blue trendlines acting as non-horizontal support.
📚 As per my trading style:
As #ETH approaches the blue circle zone, I will be looking for bullish reversal setups (like a double bottom pattern, trendline break , and so on...)
📚 Always follow your trading plan regarding entry, risk management, and trade management.
Good luck!
All Strategies Are Good; If Managed Properly!
~Rich

Gold Eyes ATH Amid Escalating Geopolitical TensionsGOLD – OVERVIEW
Commodities, particularly gold, are experiencing strong bullish pressure due to escalating tensions between Israel and Iran. With no signs of negotiation or de-escalation, the ongoing conflict continues to fuel safe-haven demand. As long as geopolitical risks remain elevated, bullish momentum in commodities is expected to persist.
Technical Outlook:
Gold maintains a bullish structure as long as it trades above 3404. Holding above this level supports a continuation toward the ATH at 3486, with potential extensions to 3529 and 3560. A retest of the 3404 support remains possible, and an opening gap toward 3486 cannot be ruled out. Overall, the prevailing trend remains upward.
A bearish scenario would only be valid if tensions in the Middle East ease significantly or if negotiations between Israel and Iran begin.
Key Levels:
• Pivot: 3431
• Resistance: 3486, 3529, 3560
• Support: 3404, 3381, 3347

There is another Bearish BPR zone below the current price.BTC/USDT Market Update – Clear, Detailed, and Easy to Understand (Even for Beginners)
Let’s take a look at what’s happening with Bitcoin (BTC/USDT) right now explained in a way that even someone new to trading can follow along and understand.
Recently, Bitcoin hit a new high it was climbing up steadily. But then, due to negative global news related to war, the market took a hit and started dropping sharply.
Currently, BTC is trading at a (BPR) this is a technical area that often acts as a strong resistance zone, where the price tends to face rejection and reverse.
👉 Right now, Bitcoin is struggling to move higher and appears to be getting rejected from this BPR level.
But here’s where it gets more interesting:
🔻 There is another Bearish BPR zone below the current price, and the market has already touched that zone once before bouncing upward.
So what's the current situation?
📍 If Bitcoin is able to break above the current Bearish BPR (the level where it’s trading now) — it would be a bullish sign, and the market may start rising again.
📍 However, if BTC fails to break this resistance level, then we could see another strong move to the downside, possibly heading back to lower support zones.
🚨 Key Takeaway:
This level — the one BTC is currently interacting with — is very important.
📌 Traders should keep a close eye on it.
📌 Let the market reveal its direction before making any decisions.
Remember:
⚠️ This is not financial advice. Always Do Your Own Research (DYOR).

Market Recap & Outlook – Nifty and S&P 500, Bulls coming?The Indian stock market witnessed a volatile week, with the Nifty 50 closing at 24,718, down nearly 300 points from the previous week's close. The index hit a high of 25,222 and a low of 24,473, moving precisely within the range of 25,500–24,500 that I highlighted last week. I hope some of you took advantage of the cautionary signal!
Key Support Zone in Focus
The 24,400 level continues to act as a strong support—bulls have fiercely defended this zone for the past five weeks. However, if this level cracks, we could see Nifty test deeper supports at 23,900 and 23,700.
Geopolitical Overhang
The ongoing Iran-Israel tensions remain a wildcard. Unless the situation escalates significantly, I expect Nifty to trade in the 24,400–25,200 range this week.
Short-Term Strategy
I believe the current selling pressure might persist for 2–3 more sessions before the bulls regain control. Historically, Nifty tends to stay under pressure until mid-June, followed by a bullish phase leading into mid-July. If we get more dips, I’ll be looking to accumulate quality mid-cap and small-cap stocks for potential short-term gains.
S&P 500 Update
The S&P 500 closed at 5,976, down just 25 points from the previous week. The index made a high of 6,059 and a low of 5,963, forming a bearish candle on the weekly chart.
Watch These Levels
If 5,963 breaks, expect further downside towards 5,899 and 5,875. On the flip side, a sustained move above 6,030 could ignite bullish momentum, targeting resistance zones at 6,090 and 6,142.
Final Take – Bulls Gearing Up?
The broader trend still favors bulls, especially if key support levels hold. Watch for a turnaround by mid-week—"Bulls may soon reclaim the throne!"

PLAINS - LONG TERM BUY OPPORTUNITY FOR 25%+ GAINSPLAINS ALL AMERICAN PIPELINE, L.P. (PAA) has been recovering from all-time lows at $3.00 per share in 2020 with a nice upward channel forming over the past 5 years. Expect some choppy price movements around $20.00 per share but once price breaks above, the next price target is $30.00 per share over the next few years. With uncertainty and war in the middle east, oil and oil stocks can be considered great investments, especially when the U.S. decides to invest more in producing oil domestically. Don't be surprised if the rise moves faster than anticipated if more uncertainty arises in the middle east.

Gold: silence on the charts—because the real money already movedThe gold market isn't reacting — it's confirming. The Israeli strikes on Iran? That’s the trigger. But the move started earlier. Price was already coiled, already positioned. All the market needed was a headline. And it got it.
Price broke out of the accumulation channel and cleared $3,400 — a key structural level that’s acted as a battleground in past rotations. The move from $3,314 was no fluke — it was a textbook build: sweep the lows, reclaim structure, flip the highs. Volume spiked exactly where it needed to — this wasn’t emotional buying. This was smart money pulling the pin.
Technicals are loaded:
— Holding above $3,396–3,398 (0.618 Fibo + demand re-entry zone)
— All major EMAs (including MA200) are now below price
— RSI strong, no sign of exhaustion
— Candles? Clean control bars — breakout, retest, drive
— Volume profile above price = air pocket — resistance is thin to nonexistent up to $3,450+
Targets:
— $3,447 — prior high
— $3,484 — 1.272 extension
— $3,530 — full 1.618 expansion — key upside target
Fundamentals:
Middle East is boiling. Iran is ready to retaliate. Israel is already escalating. In moments like these, gold isn't just a commodity — it's capital preservation. The dollar is rising — and gold still rallies. That means this isn’t about inflation, or rates. It’s about risk-off. Pure, institutional-level flight to safety.
Tactical view:
The breakout is done. Holding above $3,396 confirms the thesis. Pullbacks to that zone? Reloading points. While gold remains in the channel and momentum is clean, the only side that matters right now — is long.
When price moves before the news — that’s not reaction. That’s preparation. Stay sharp.

Israel VS Iran War: Oil Spike!Tensions between Israel and Iran have escalated dramatically, with both nations engaging in direct military strikes. Israel launched Operation Rising Lion, targeting Iran’s nuclear infrastructure, missile factories, and military personnel. In response, Iran retaliated with missile attacks on Israel, hitting Tel Aviv and wounding civilians
The conflict stems from long-standing hostilities, particularly over Iran’s nuclear program, which Israel views as an existential threat. The situation has drawn international attention, with the United States distancing itself from Israel’s actions while maintaining strategic interests in the region.
The escalation has raised concerns about a wider regional war, with analysts warning of unintended consequences and further retaliation. The global markets have also reacted, with oil prices surging amid uncertainty.

USOIL || Geopolitical Spike Hits Major Resistance - Watch $77.77🛢️
📅 June 13, 2025
👤 By: MJTRADING
🔍 🧭 Fundamental Context – Risk Premium on the Rise:
Crude oil surged sharply today following reports of Israeli airstrikes on Iranian territory — a move that reawakens fears of broader Middle East escalation. Iran plays a crucial role in OPEC and controls the strategic Strait of Hormuz , through which ~20% of global oil passes.
While Iran has not officially responded yet, markets are pricing in the potential for:
* Military retaliation
* Disruption of oil exports or maritime routes
* Heightened volatility across global risk assets
=======================================================
📉 📊 Technical Structure – Tag of Key Resistance at $77.7:
Price exploded upward, piercing the descending channel that's been intact since mid-2022.
Today's daily wick tagged the $77.70 level, a major horizontal resistance and channel top.
This zone has repeatedly acted as a pivot in both bullish and bearish phases.
Volume confirmed the move – highest daily volume in months, suggesting institutional reaction.
💡 Trading Outlook:
🔼 Scenario A – Breakout & Close Above $77.7 = Bull Continuation
If tomorrow closes firmly above $77.70:
Target 1: $88.88 supply zone
Target 2: $90.00 psychological resistance
Setup: Conservative entries on retest of $75–77 area with tight invalidation
🔽 Scenario B – Failed Breakout → Fade Back Inside Channel
If this was a headline-driven spike with no follow-through, bears may re-enter strongly
A close below $75 could confirm bull trap
Support zone to watch: $66.66 (mid-channel, EMA confluence)
⚠️ Risk Factors to Monitor:
Iran’s response (military, diplomatic, strategic)
US/NATO reaction to potential escalation
Strait of Hormuz disruption
OPEC commentary or Saudi-led output adjustment
Market sentiment unwind (profit-taking from overbought spike)
💬 Markets love emotion, but traders survive with structure. This is not the time to be reckless — size down, be responsive, and respect both breakouts and fakeouts.
📎 #CrudeOil #Geopolitics #OilSpike #WTI #MiddleEastTensions #Iran #IranIsrael #TechnicalAnalysis #MJTRADING
