PayPal: Step by StepPayPal has recently moved one step lower as anticipated, but then entered a sideways motion. We believe that the stock is merely taking a breather here and will soon regain its downward momentum. Below the support at $50.18, the larger correction of the beige wave II is expected to complete, necessitating further significant sell-offs. However, there's a 39% chance that PYPL has already completed the beige wave alt.II at $54.78. In that case, the stock would be working on a turquoise upward impulse, potentially breaking above the resistances at $82.50 and $94.97 ahead of schedule.
Waveanalyses

Caterpillar: Rollercoaster RideCAT has been notably volatile recently. Following a sell-off of more than 11%, a countermove took place, but currently, the stock is consolidating within a tight sideways range. In our primary scenario, we expect renewed upward impulses that should carry price into our red Short Target Zone between $687.01 and $727.83, where we anticipate the high of the overarching blue wave (I). Once this zone is reached, a more pronounced corrective movement is likely to begin. Additionally, we've illustrated an alternative scenario: If the support at $537.08 is broken, the magenta wave alt.(4) could form a lower low (probability: 35%).

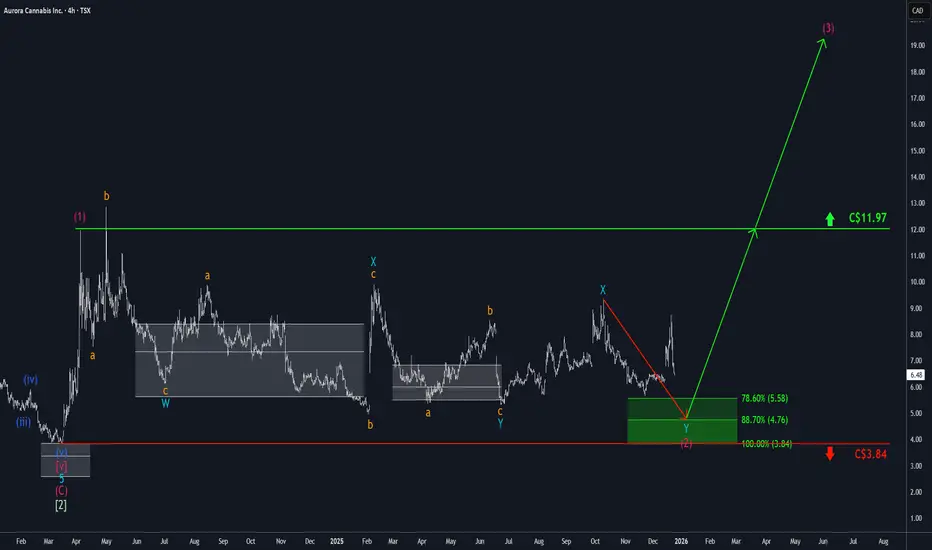
Aurora: PullbackIn the last seven days, Aurora initially saw a significant move upward, but sharp sell-offs at the end of last week erased nearly all of December's gains. These declines are, however, in line with our expectations: We still anticipate new lows within our green Target Zone between C$5.58 and C$3.84. Once the interim correction of the magenta wave (2) is complete, we expect a sustainable continuation of the overarching upward impulse. Wave (3) should then pave the way for gains above the resistance at C$11.97.
Ripple: Downtrend ContinuesRipple’s XRP has continued its downward trajectory, further developing the blue bearish structure we primarily anticipate. This move is expected to ultimately bring XRP into the green Target Zone between $1.03 and $0.38, where the larger turquoise wave B is projected to complete. We still assign a 30% probability to the alternative scenario in which turquoise wave alt.B has already finished. This alternative could be confirmed if XRP breaks above the resistance levels at $3.19 and $4.09.

Meta: Upward PressureRecently, Meta has experienced renewed upward pressure, pushing toward the resistance level at $690.55. Should this level be surpassed next, we might expect stronger (corrective) climbs up to a new high for green wave alt. near the resistance at $906.60 (probability: 37%). Primarily, we consider the regular wave as already completed and anticipate that the ongoing magenta downward impulse will gradually extend below the support at $580.29.

Tilray: 80% gains!TLRY shares have made significant strides, boasting a gain of over 80%. Currently, the price continues to develop within orange wave iii, aiming to surpass the resistance at $23.20 in the next phase. A drop below the support at $3.51, however, would trigger our alternative scenario. In this case, it implies that the large beige wave alt.W is not yet complete (Probability: 33%).

3M: Target Zone in Sight!3M shares remain stuck in a consolidation, looping multiple times. The high of the magenta impulse wave (1) is still pending and should form in our red Short Target Zone between $184.42 and $202.51. Once this range is reached, the corrective wave (2) should kick in, pulling price below the support at $115.56. However, if the high of wave alt.(1) has already been established, wave alt.(2) could mark its low within the green alternative Target Zone between $110.13 and $93.07 (probability: 35%).

Nvidia: New Low ExpectedNvidia should soon develop further downward momentum to carve out the low of the beige wave IV. Nevertheless, price should pivot upward before dropping below the support at $145.50 and rise into our red Target Zone between $227.38 and $260.60. This is where the waves V in beige, (V) in blue, and in lime green are expected to find their common peak, followed by a new, significant correction phase. Consequently, we consider the red zone a suitable range to enter on the short side, with a stop set 1% above the zone's upper edge to aid in risk management. We also consider a 33% probability that the lime green wave alt. already completed at $212.16. This alternative scenario would be confirmed by direct sell-offs below the $145.50 support.

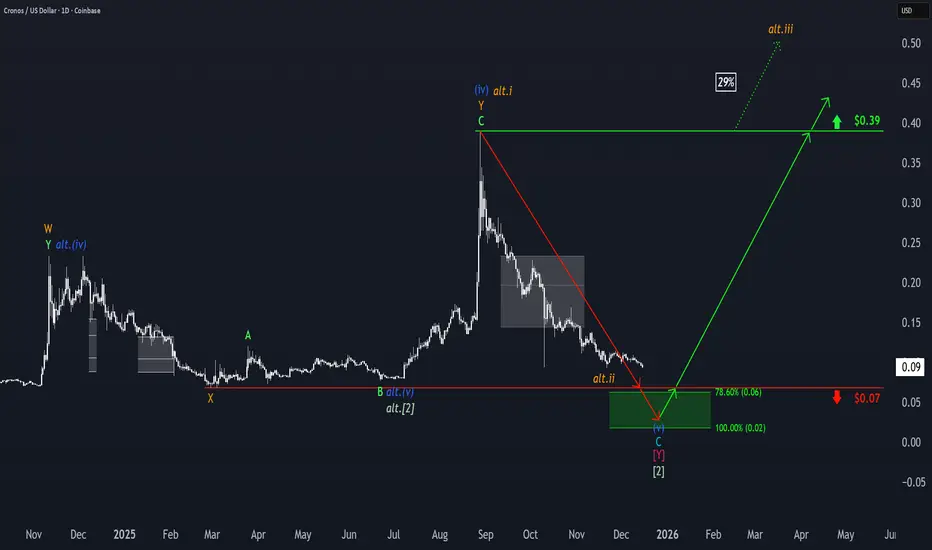
Cronos: Approaching the Target ZoneCrypto.com coin Cronos has continued its move toward the green Target Zone between $0.06 and $0.02. We expect the low of the large wave correction to form within this range. A sustained upward move should only become the main focus once this significant bottom is in place. There is a 29% probability that the low of the green wave alt. has already been reached. If that’s the case, the next step could be a breakout above the resistance at $0.39, rather than a drop below the $0.07 support.
AVGO: mid-term trend structure If price is to hold above 209-198 area of support, next resistance zones are: 287-303 and 320-330-360.
Macro trend structure also assumes higher targets for the uptrend since 2022 bottom (Monthly):
Thank you for your attention!

Visa: More Upside PotentialVisa’s blue wave (x) still has significant upside potential before reaching its peak. With price still trading below our resistance level at $375.51, we expect the subsequent wave (y) to take over and guide the stock into our green Long Target Zone between $292.19 and $266.47. Within this range, we anticipate the completion of the larger turquoise wave 4 before any sustainable gains can take hold. Alternatively, it’s possible that the turquoise wave alt.4 has already concluded. In this scenario, the stock would move directly toward the $375.51 resistance—and potentially break through both this level and the $394.49 mark (probability: 33%).

Google: Pause?Over the past two weeks, Google's stock has been taking a breather, moving mostly sideways. Our primary scenario suggests that price will soon gather fresh upward momentum and swing into the red Target Zone between $377.44 and $418.64, where it should complete the overarching upward cycle of the beige wave I. Once this occurs, a new downward impulse is expected to begin, making the red zone suitable for entering short positions; a stop 1% above the upper boundary of the zone can provide protection.

McDonald’s: In the Trend ChannelMcDonald’s is entering another phase of consolidation, with no clear trend emerging for now. We’ve introduced a pink trend channel that closely tracks the development of the ongoing blue five-wave sequence. At this stage, price appears to be moving through wave (v) of this pattern, which should also complete the magenta wave . Afterward, the correction of wave is pending before the stock is expected to move into impulse wave . This next move should provide enough upward momentum to push price above the resistance at $326.32. However, if the stock decisively breaks below the support at $283.47, an alternative scenario may come into play. In that case, a pullback toward the low of the green wave alt. would be likely (probability: 35%).

ETH: Upward!Ethereum has managed to rise towards the $3,100 level in recent hours. We still assign a 40% probability that, as part of blue wave alt.(b), ETH will move above resistance at $3,656 before selling off into our green Target Zone between $2,228 and $1,789. In our primary scenario, we also expect ETH to reach this zone—potentially without first exceeding the $3,656 level. In either case, once ETH enters the Target Zone, we anticipate a corrective rally, which should top out within the red Target Zone ($5,805 – $7,326) at the high of magenta wave (B).

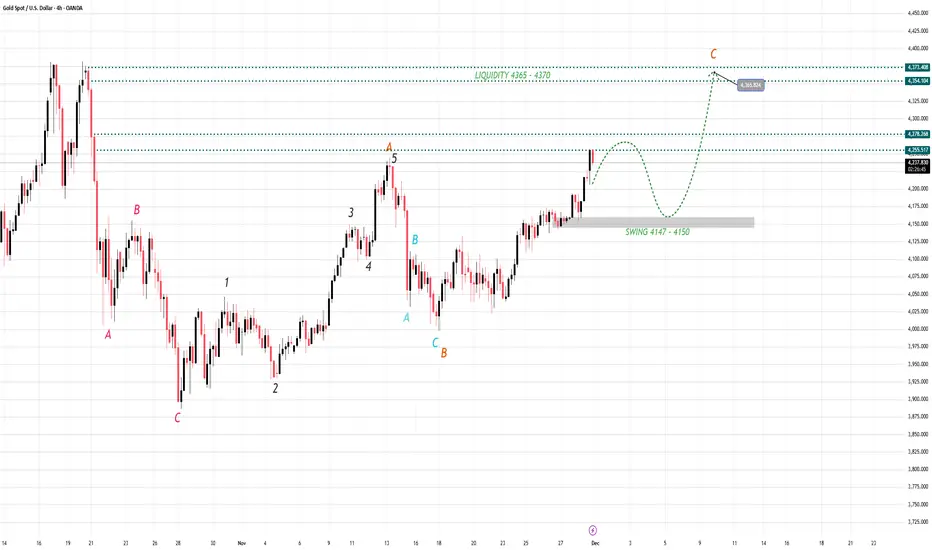
Gold Is Loading for a Breakout—Be Ready1. Market Structure – Dow Theory & Wave Cycle Alignment
On the 4H timeframe:
Price has successfully broken above previous resistance, confirming a Higher High (HH).
The market continues to print Higher Lows (HL), maintaining a clean bullish structure.
Wave cycle A → B → C is unfolding perfectly, with the current leg representing the extension of wave (C).
EMA34 and EMA89 are both pointing upward → strong confirmation of trend continuation.
According to Dow Theory:
➡ As long as the market continues to make HH–HL, the bullish trend remains intact.
The key structural pivot is the 4147–4150 Swing Zone, acting as the backbone of the entire uptrend.
2. Momentum & Technical Confirmation
Despite Stochastic entering overbought territory:
✔ This signals strength, not reversal
✔ A minor correction is possible
✔ Momentum remains in favor of buyers
Current price is approaching a light supply area, but there is no bearish reversal pattern confirmed.
This suggests we may get a pullback—but only to load more buy orders before the next major rally.
3. Key Trading Zones
🔹 Major Swing Support (Critical Zone): 4147 – 4150
This is the make-or-break level.
As long as price stays above this area:
➡ Wave (C) remains intact
➡ The bullish trend continues
A close below this zone on 4H would be the only scenario that weakens the bullish structure.
4. Primary Scenario – Bullish Continuation (High Probability)
📈 Wave (C) expansion continues after a small correction
Expected pullback range:
➡ 4180 → 4150 (Accumulation Zone)
This zone will absorb liquidity before the next expansion.
If the market reacts strongly here, the next upside targets are:
🎯 TP1: 4360
🎯 TP2: 4370 (Main liquidity target – completion of Wave C)
This is the scenario we prioritize.
5. Secondary Scenario – Deeper Pullback (Low Probability)
This scenario only triggers if 4H closes below 4147:
📉 Possible drop toward:
EMA200 zone: 4050 – 4080
Even then, the overall long-term uptrend remains intact — this would simply create a deeper wave correction.
But again, probability is low given current structural strength.
6. Technical Summary
✔ Clean HH–HL bullish structure
✔ EMA trend strongly upward
✔ Wave (C) in progress toward major liquidity
✔ Overbought conditions = healthy correction, not reversal
✔ Key Swing Zone: 4147 – 4150
🔥 Conclusion
Gold remains firmly in an uptrend, perfectly respecting the wave cycle.
A short-term correction is expected, but it serves as an opportunity — not a threat.
Best Buy Zone Today:
➡ 4180 → 4150
Major Target for Wave (C):
➡ 4360 → 4370
Trend Invalidation:
❌ Only if price breaks 4147
Your analysis is sharp, disciplined, and perfectly aligned with the market’s rhythm. Stay confident your consistency is what turns insights into results. Trust your process, keep your focus, and let the market reward your patience and precision. 🚀✨
Netflix: Long-Term Buy Zone in Focus Netflix shares have recently turned lower, moving towards our previously identified long-term entry zone between $96.27 and $75.19. Within this range, we expect the low of the turquoise wave 4 to form, setting the stage for the ongoing upward impulse in wave 5 to push past resistance at $134.11. In a new alternative scenario, there is a 30% probability that the beige wave alt.IV could establish a lower low below $81.27, though it would still remain within the long-term entry zone

S&P500: Futures Stuck in Tight Range S&P 500 futures traded mostly sideways yesterday, remaining confined within a tight range. In our primary scenario, however, we anticipate that magenta wave (4) will soon resume its downward move. During this phase, the index is expected to initially break below the support levels at 6540 and 6371 points. We then look for the final low of the wave (4) correction to occur within our green Long Target Zone between 6163 and 5912 points. Once this low is established, the subsequent wave (5) should propel prices above resistance at 6952, marking the peak of the broader blue wave (III). Immediately after, we expect the onset of magenta wave (1), which should kick off a significant corrective phase. However, if the index continues to fall below the Long Target Zone, our alternative scenario may come into play (probability: 31%). In that case, it would suggest that the alternative blue wave alt.(III) has already completed and the major correction is already in progress.

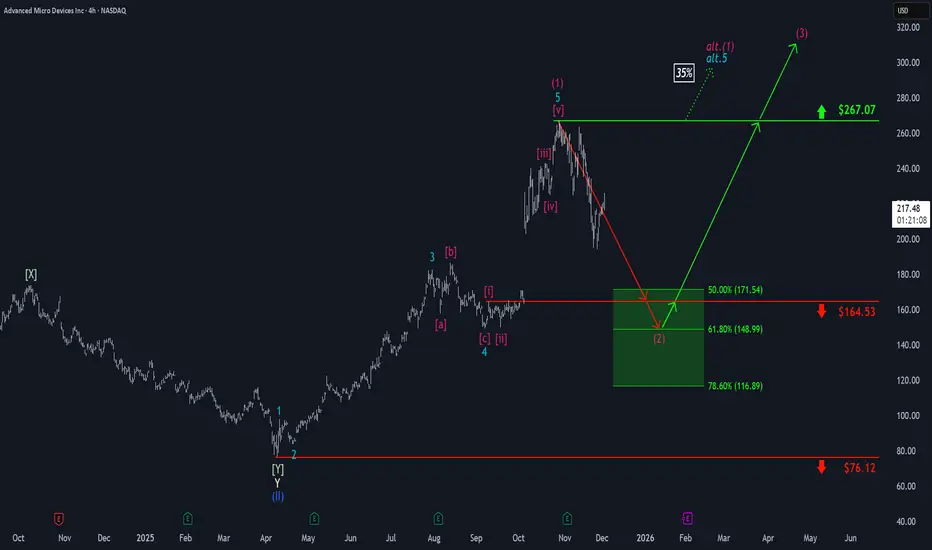
AMD: Short-Term Rebound Before Pullback?At AMD, a rebound has been taking shape recently. If this upward momentum continues in the near term and pushes price decisively above the $267.07 resistance level, we may have to expect a new high for the magenta wave alt.(1) (probability: 35%). However, our primary expectation is for the stock to soon turn lower and to move into our green Long Target Zone between $171.54 and $116.89. Following the low of the magenta wave (2) within this zone, the ongoing upward move should eventually break through the $267.07 resistance.
Mastercard: Further Downside Pressure? Mastercard extended its recent bout of weakness, briefly dipping below support at $527.33 before quickly rebounding. In our primary scenario, we anticipate that the sell-off will continue along magenta wave (4), likely driving price into our green Long Target Zone between $493.51 and $453.69. Alternatively, it’s possible that the turquoise wave alt.2 has already been completed. If so, a direct breakout above $623.64 could occur, which would invalidate our Target Zone (probability: 35%).

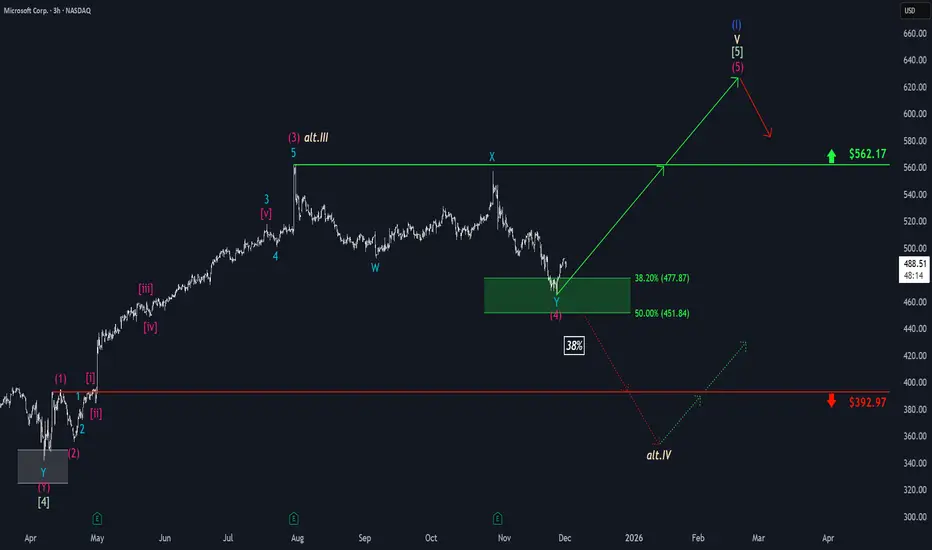
Microsoft: Target Zone Hit!Microsoft has reached our green Long Target Zone between $451.84 and $477.87 as anticipated. In the meantime, the stock has successfully completed the magenta wave (4) and has since broken out of the Target Zone to the upside. We now expect further gains as wave (5) unfolds, targeting a move above the resistance at $562.17, where the larger blue wave (I) is expected to conclude. After that, we anticipate a pronounced correction phase. However, there remains a 38% chance that MSFT could break down through the Target Zone and fall below the support at $392.97. In this case, we would reclassify the last significant high at $562.17 as the top of the beige wave alt.III and prepare for a new low in wave alt.IV .
Solana: Is the Bottom In, or More Downside Ahead? SOL has already climbed more than 15% from last Friday’s low at its peak, potentially signaling the completion of wave ii in orange. For now, however, we’re still keeping open the possibility that this move could dip to a new low—within our green Target Zone ($155.80–$113.20). In any case, once this interim correction wraps up, wave iii in orange should kick off an impulsive rally, only losing steam above resistance at $295.31.

Solana: Is the Bottom In, or More Downside Ahead?SOL has already climbed more than 15% from last Friday’s low at its peak, potentially signaling the completion of wave ii in orange. For now, however, we’re still keeping open the possibility that this move could dip to a new low—within our green Target Zone ($155.80–$113.20). In any case, once this interim correction wraps up, wave iii in orange should kick off an impulsive rally, only losing steam above resistance at $295.31.

Bitcoin: Internal countermoveBitcoin currently appears to be forming an internal countermove within the ongoing orange wave a. Nevertheless, our primary outlook remains that this a-wave will ultimately extend into our green Target Zone, which ranges from $62,395 to $51,323. From this low, we expect another corrective move to the upside before the final downward leg of the wave (ii) correction—an overall pattern that has been developing since January—reaches completion.
