Solana: Is the Bottom In, or More Downside Ahead?SOL has already climbed more than 15% from last Friday’s low at its peak, potentially signaling the completion of wave ii in orange. For now, however, we’re still keeping open the possibility that this move could dip to a new low—within our green Target Zone ($155.80–$113.20). In any case, once this interim correction wraps up, wave iii in orange should kick off an impulsive rally, only losing steam above resistance at $295.31.
Waveanalyses

Bitcoin: Internal countermoveBitcoin currently appears to be forming an internal countermove within the ongoing orange wave a. Nevertheless, our primary outlook remains that this a-wave will ultimately extend into our green Target Zone, which ranges from $62,395 to $51,323. From this low, we expect another corrective move to the upside before the final downward leg of the wave (ii) correction—an overall pattern that has been developing since January—reaches completion.

Gold Bullish Targeting From $4141 NOV2025 To $4761 By APR2026Target Set on 4761
Current Tp's as follows :
1st Tp 4225
2nd Tp 4356
3rd Tp 4489
4th Tp 4624
Reasons are already given in my previous published charts, new things which i see globally is Rare Earth, AI, Space & Victory over New World Formation.

ExxonMobil: Fresh Selling PressureExxonMobil recently came under renewed pressure, pulling back from resistance at $126.34. In our primary scenario, we continue to expect the high of the magenta wave (B) to remain below the resistance at $134.38, before wave (C) drives the stock into our green Target Zone between $75.37 and $50.05. However, if the stock soon drops below support at $95.77, we may have to assume that the high of the turquoise wave alt.2 is already in place, which would likely result in an earlier move toward our Target Zone (probability: 35%).

Zscaler: Downward Shortly after our last update, Zscaler faced significant downward pressure—completely in line with our primary scenario. This move allowed the stock to turn lower in time, staying below the resistance at $340.25 and avoiding our alternative scenario of an early breakout above that level. However, a quicker peak for the turquoise wave alt.Y remains a possibility, as we still assign a 37% probability to such an accelerated sequence. Primarily, though, we expect further sell-offs as part of the magenta wave , which should eventually give way to renewed gains above the support at $164.78. With wave , the regular wave Y should then complete above $340.25.

Coca-Cola: Approaching Key Resistance LevelCoca-Cola shares continue their upward trajectory, marked by minor pullbacks and brief periods of sideways movement. Overall, the stock maintains a bullish trend and is currently trading just below resistance at $74.38, which is likely to be tested next. We anticipate that the blue wave (y) will push the stock into our red short Target Zone between $76.58 and $81.51. Within this range, we expect the beige impulse wave III to complete. Once this high is reached, a significant correction is likely. As such, we view this zone as an opportunity to establish short positions. If a new high fails to materialize, it could indicate that the beige wave alt.III has already concluded. In that scenario, a direct drop below $65.35 would be expected (probability: 30%).

S&P500: Poised for Further Pullback The S&P 500 futures are currently trading just above support at 6,540 points, but are expected to see a temporary pullback within magenta wave (4). In our primary scenario, we anticipate the sell-off will extend into the green Long Target Zone between 6,163 and 5,912 points. From this area, we expect the start of wave (5), which would complete the magenta five-wave sequence and push the index higher—ideally above resistance at 6,952 points. This move would also mark the final high of the broader blue wave (III). However, if selling pressure intensifies and the Long Target Zone is breached, our alternative scenario will come into play (probability: 31%). In this case, blue wave alt.(III) would already be complete, and the index would enter a significantly deeper correction phase.

Litecoin: Target Zone Within ReachLTC has recently continued its decline, leading us to believe that the high for green wave B is likely already in place. Price is now just a short distance from our green Target Zone, which ranges from $78.52 to $64.53. Within this zone, we expect to see the low of orange wave ii. Afterward, orange wave iii should drive price above the resistance levels at $118.71 and $147.06.

Solana: Room for moreSOL recently dipped further into the now green Target Zone between $155.80 and $113.20. Within this area, we expect the low of wave ii in orange to be established imminently. Afterward, we anticipate a strong wave iii rally, which should peak above resistance at $295.31.

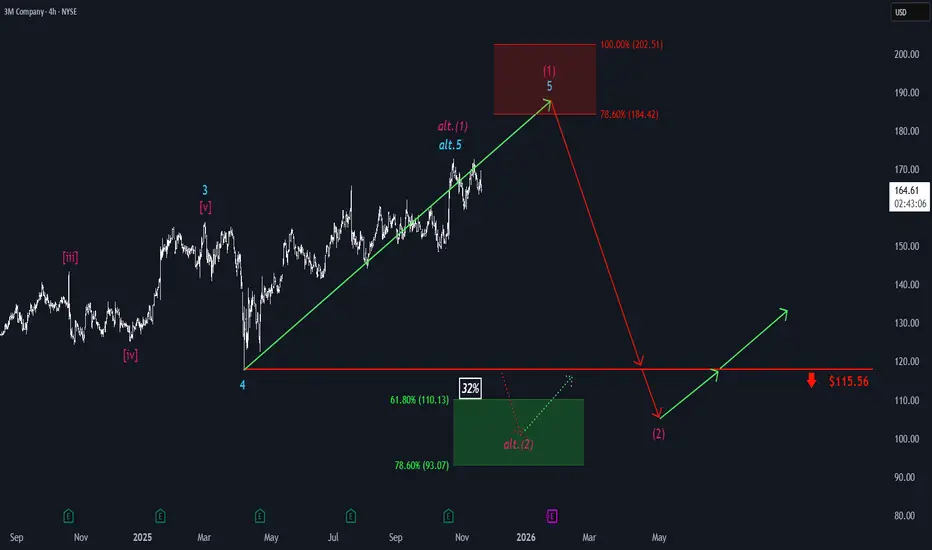
3M: Approaching the Target Zone3M stock has recently traced a zigzag pattern on the chart. In the short term, we anticipate further upside, with shares moving into our Target Zone between $184.42 and $202.51. Within this range, we expect to see the peak of the magenta impulse wave (1). Once this level is reached, a corrective wave (2) is likely to set in, pushing price below support at $115.56. Alternatively, it’s possible that the high for wave alt.(1) has already been established. In that scenario, the ongoing alt.(2) would bottom out within the alternative Target Zone between $110.13 and $93.07 (probability: 32%).
Apple: Pause - but New Highs Likely Ahead Apple has recently shown signs of sluggishness, trading mostly sideways. For now, we expect this pause to give way to renewed gains, allowing the green wave to reach a new high. However, there is also a 31% chance that the current consolidation could break to the downside, leading to imminent sell-offs below the $212.94 support level. In that scenario, we would view the previous advances as merely corrective and anticipate a new, broader corrective low in the blue wave alt.(IV), although this would still form above the lower $168 mark.

Nvidia: Downside Pressure Nvidia has recently faced notable downward pressure, but so far has managed to hold above the support level at $176.21. As a result, we continue to anticipate an imminent rally as part of the beige wave V, which should lift the stock into the now-red Target Zone between $227.38 and $260.60. However, if the stock immediately drops below the $176.21 mark, we would expect a new low for the beige wave alt.IV, with the lower $145.50 level still likely to hold.

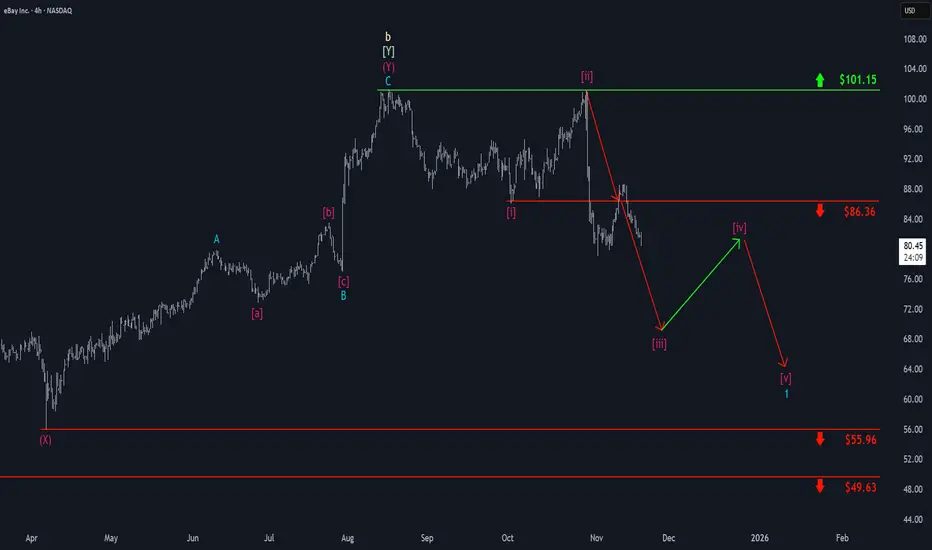
eBay: Set for Further DeclineseBay has recently made another move higher, briefly reclaiming the $86.36 level. However, the stock has since resumed its downward trajectory as anticipated and is expected to continue selling off soon as part of magenta wave . Overall, this magenta downward impulse should push price closer to support at $55.96, completing turquoise wave 1.
Tesla: DownwardShortly after our last update, Tesla experienced noticeable downward momentum, initially entering our previously magenta alternative target zone, which has already been stopped out. We currently consider the green wave complete, and the alternative target zone has been deactivated and grayed out. However, there's still a chance the stock could rise sharply, confirming an ongoing upward trend. If this alternative scenario, which has a 35% probability, plays out, we would mark blue wave alt.(II) as complete and expect gains above the resistance at $509.50 and $532.92 within a magenta upward impulse. Primarily, we anticipate further sell-offs and expect the regular wave-(II) correction low to occur first in our green target zone between $157.88 and $46.70. This green zone could potentially be suitable for long entries, protected by a stop 1% below the zone's lower edge.

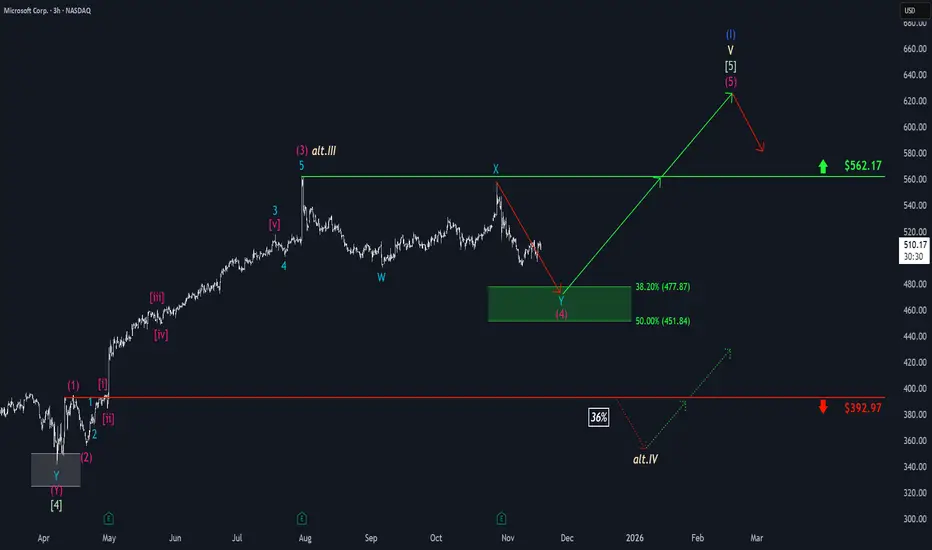
Microsoft: Stuck in Sideways PatternMicrosoft shares have continued to show weakness recently, although the stock has shifted into more of a sideways pattern. In the near term, we anticipate another downward move, which should establish the low for wave (4) in magenta within our green Target Zone between $477.87 and $451.84. From our perspective, this range remains attractive for long entries, as we expect a new upward impulse to follow as part of magenta wave (5). This move should push the stock above resistance at $562.17 and complete the larger blue wave (I). Alternatively, there is a scenario in which the high at $562.17 marks the end of beige wave alt.III (probability: 36%). In that case, we would expect a substantial decline below support at $392.97, where the low of wave alt.IV would be found.
RENDER: Slightly higherRENDER recently managed to push higher once again. Currently, within the larger turquoise wave Y—which is developing as a five-wave move in magenta—it is expected to continue its upward momentum in the near term. As a key initial step, price should break above resistance at $5.51.

Uber: Pulling BackUber has recently pushed higher toward resistance at $101.99 before pulling back noticeably from that level. This move aligns perfectly with our primary scenario, as we continue to expect a broader sell-off into the turquoise Target Zone between $68.29 and $59.15 as part of turquoise wave 4. Within this zone, we anticipate price will reverse and resume its broader upward trend, eventually breaking through the $101.99 resistance. However, if Uber reverses course soon and breaks above the $101.99 mark without setting new lows, we would then expect a new high for turquoise wave alt.3 . We currently assign a 35% probability to such a delay in the ongoing upward impulse.

Strategy: Downward Pressure Intensifies Strategy has continued to develop downward pressure as anticipated since our last update, bringing it closer to the targeted low of the turquoise wave 2. Our alternative—and now grayed-out—Target Zone has been breached to the downside, allowing us to remove the alternative scenario of a premature breakout to the upside. Investors who speculated on this alternative and entered within the alternative Target Zone with a stop 1% below the lower edge have likely been stopped out by now. For now, we are still allowing some room for turquoise wave 2 to move lower; however, it should find its bottom above the support at $102.40 to set the stage for wave 3 to advance further above the resistance at $674.18.

PayPal: Further Downside ExpectedPayPal initially extended its decline as anticipated, before a modest upward rebound began to emerge. Overall, bearish momentum should primarily persist, likely pushing price below the $50.18 support level and completing the broader correction of the beige wave II. However, there is also a 39% probability that beige wave alt.II has already concluded. In that scenario, the stock would currently be developing a magenta upward impulse and would be in the process of forming (or would have already formed) the low of wave alt. . Wave alt. would then bring further gains, potentially breaking through resistance at $94.97.

S&P500: Slightly higherS&P 500 futures edged slightly higher in yesterday’s session. The index appears to remain within the upward trajectory of magenta wave (5), which is expected to continue pushing higher. Once this wave reaches its peak, the larger blue wave (III) should also complete. Afterward, we anticipate a corrective phase in the form of magenta wave (A), which could put renewed pressure on the index. However, if prices reverse course and fall below the support level at 6,371, our alternative scenario will come into play. In that case, alternative wave alt.(4) would likely extend further downward, targeting a low within the corresponding alternative zone between 6,055 and 5,822 points (probability: 30%).

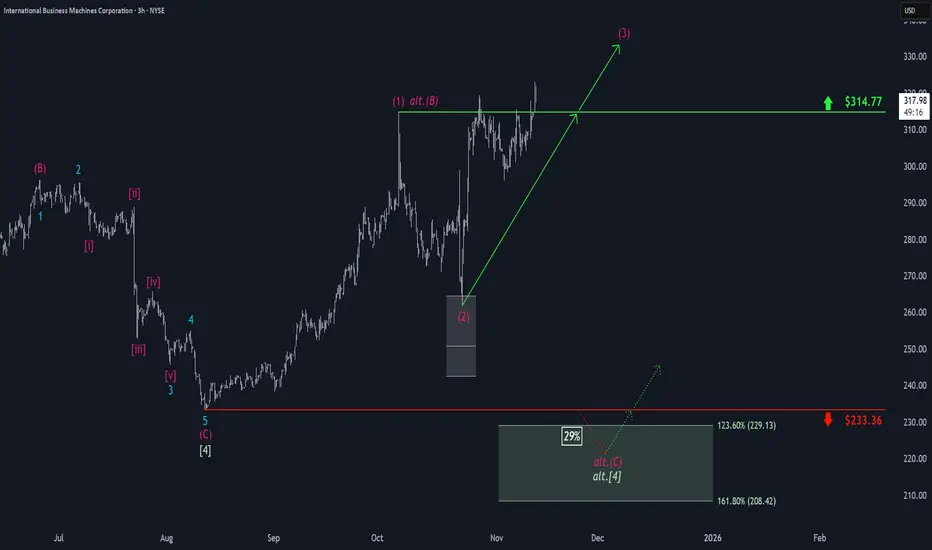
IBM: Breaking Out Above Key ResistanceIBM shares have been contending with stubborn resistance at $314.77 for the past two weeks. After an initial breakout attempt was firmly rejected, the stock has made three more efforts to decisively clear this level—and today, it once again surged purposefully above that mark. In the near term, we expect the high of magenta wave (3) to be established. If the alternative scenario plays out, however, a pullback into our green alternative Target Zone between $229.13 and $208.42 will be likely (probability: 29%).
AVAX Rally Keeps Bullish Outlook Intact Avalanche (AVAX) has recently posted significant gains, leaving our outlook unchanged. We continue to believe price is currently in a five-wave magenta upward move, which should soon push it above the resistance level at $36.19. Our alternative scenario also remains valid, in which AVAX could target new absolute lows below support at $8.64 (probability: 33%).

Coca-Cola: Fresh Upside MomentumAfter some recent setbacks, Coca-Cola shares have regained upward momentum. Blue wave (y) is expected to first break through resistance at $74.38, potentially pushing price into our beige Target Zone, which ranges from $76.58 to $81.51. In this area, we anticipate the completion of the same-colored impulse wave III. Once this wave is complete, a significant correction is likely to follow. For this reason, we view this range as an opportunity to establish short positions. If beige wave alt.III has already concluded, price could drop directly below $60.62 (probability: 32%).
