#BTC/USDT Let Bitcoin make a new ATH#BTC
The price is moving within a descending channel on the hourly timeframe. It has reached the lower boundary and is heading towards a breakout, with a retest of the upper boundary expected.
The Relative Strength Index (RSI) is showing a downward trend, approaching the lower boundary, and an upward bounce is anticipated.
There is a key support zone in green at 92445. The price has bounced from this level several times and is expected to bounce again.
The indicator is showing a trend towards consolidation above the 100-period moving average, which we are approaching, supporting the upward move.
Entry Price: 89286
First Target: 90011
Second Target: 91141
Third Target: 92445
Stop Loss: Below the green support zone.
Don't forget one simple thing: Money Management.
For any questions, please leave a comment.
Thank you.
Wave Analysis

BANK OF INDIABank of India Ltd. is a large‑cap public sector bank incorporated in 1906, headquartered in Mumbai. It provides retail, corporate, MSME, and treasury banking services across India and overseas, with branches in key global financial hubs.
Promoter: The Government of India is the majority shareholder, ensuring systemic stability and governance oversight.
FY22–FY25 Snapshot
Total Income – ₹47,350 Cr → ₹52,890 Cr → ₹58,420 Cr → ₹61,780 Cr
Net Profit – ₹3,405 Cr → ₹4,023 Cr → ₹5,028 Cr → ₹6,210 Cr
Operating Performance – Moderate → Strong → Very Strong → Excellent
Equity Capital – ₹4,130 Cr (constant)
Gross NPA (%) – 9.8 → 8.5 → 7.3 → 5.9 (steady improvement)
Net NPA (%) – 3.4 → 2.7 → 2.1 → 1.5
EPS – ₹8.2 → ₹9.7 → ₹12.1 → ₹14.9
Dividend Yield – 0.8% → 1.0% → 1.2% → 1.5%
Institutional Interest & Ownership Trends
Promoter holding (Govt of India): ~81%.
FIIs/DIIs: Gradual increase in exposure as profitability and asset quality improve.
Public float: ~19%, with delivery volumes showing accumulation by long‑term investors.
Strategic Moves & Innovations
Expansion of digital banking platforms and fintech partnerships.
Focus on retail and MSME lending to diversify beyond corporate loans.
Aggressive provisioning and recoveries driving GNPA reduction.
Overseas presence leveraged for trade finance and NRI banking.
Cash Flow & Balance Sheet Strength
Operating cash flows strengthened by higher NII and fee income.
Capital adequacy comfortably above regulatory thresholds.
Balance sheet resilience improved through deleveraging and profit accretion.
Government backing ensures systemic stability.
Risk Factors
PSU constraints: slower decision‑making compared to private peers.
Margin pressure: NIMs (~2.9–3.0%) remain lower than private banks (~4%).
Credit risk: exposure to corporate and MSME sectors sensitive to economic cycles.
Competition: private banks aggressively expanding in retail and digital banking.
Investor Takeaway
Bank of India has steadily improved profitability and asset quality, with strong earnings momentum and deleveraging. While margins remain modest versus private peers, its government backing, improving fundamentals, and rising institutional interest make it a solid long‑term PSU banking play.

Gold is consolidating at high levels, making trading easy.Yesterday, we repeatedly warned of potential market manipulation by major players. During the US session, gold sharply retraced from $5100 to $4990. We accurately seized the opportunity to buy in the $5000-$5020 range. Currently, it has rebounded after testing the lows again, hovering around $5070.
Gold's sharp drop from $5100 to $4990 is a clear sign of market manipulation by major players, but the medium-term bullish trend for gold remains unchanged. The $4990 level is near the closing price from last Friday, meaning gold has now completed a top-to-bottom reversal. With the expectation of the interest rate decision priced in, gold is likely to consolidate in the $5000-$5100 range.
From a technical perspective, the 1-hour chart shows that after breaking through the $5000 mark, short-term bulls exerted strong momentum, pushing the price up to $5110. However, profit-taking by long positions led to a significant pullback. It's worth noting that gold has now firmly established itself above the $5,000 psychological level. This breakthrough opens up further upside potential and boosts bullish sentiment.
Trading Strategy: Gold is likely to trade within a range today. Key support levels to watch are $4,990-$5,000, while key resistance levels are $5,100-$5,110. Avoid blindly chasing the price higher.

NZD/CAD BEST PLACE TO SELL FROM|SHORT
Hello, Friends!
Previous week’s green candle means that for us the NZD/CAD pair is in the uptrend. And the current movement leg was also up but the resistance line will be hit soon and upper BB band proximity will signal an overbought condition so we will go for a counter-trend short trade with the target being at 0.812.
Disclosure: I am part of Trade Nation's Influencer program and receive a monthly fee for using their TradingView charts in my analysis.
✅LIKE AND COMMENT MY IDEAS✅

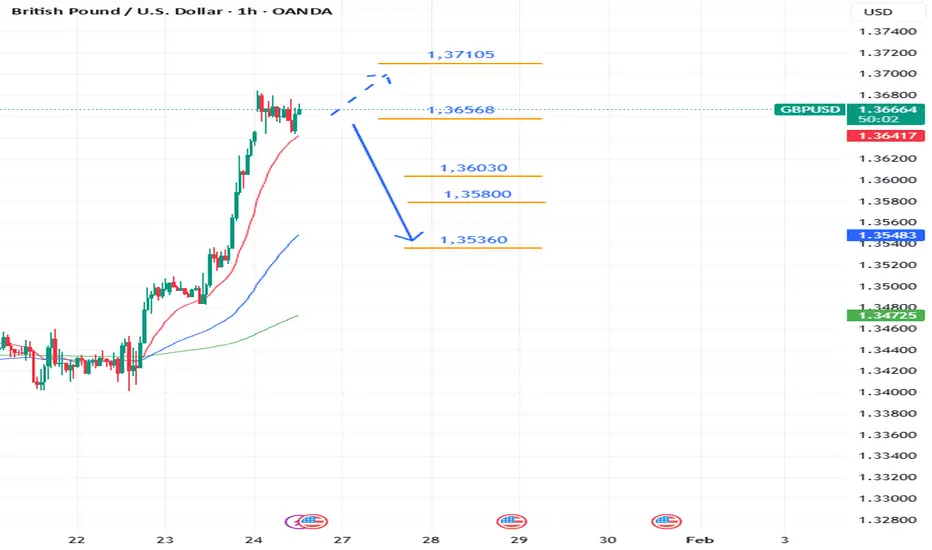
Coinranger|GBPUSD. Potential for a decline to 1.35800🔹DXY fell even more overnight than on Friday. It could go even lower, but it's unlikely to reverse.
🔹No interesting news for the pound today.
🔹Earnings season is starting in the US, but there's nothing particularly interesting there today.
Current levels:
Below:
Preliminary downward wave set on M15
1.36030
1.35800
1.35360
Above:
1.36568 - the end of the upward wave set
1.37105 - the end of the first upward extension (we may finish it off)
After a significant rise, we'll likely correct today, most likely to 1.35800
-------------------
Share your thoughts in the comments!
We could final see altcoin seasonTracking a wave 4 triangle. We should be headed down for wave D. CMC Altcoin Season Index sitting at 29 on coinmarketcap.

Solana (SOL) — 1H: Bearish Structure Remains in FocusOn the 1-hour chart, Solana may appear to be forming a reversal after an extended decline. However, the current structure does not yet support this view.
Price action remains weak, with downside risk still present. A move toward the 125-125,5 area could allow for short-term consolidation, followed by a rotation into the 116–118 zone.
From there, continuation toward 108 remains a level to monitor.
This scenario would change if price reaches the 127 level.

Next Week's Trading Alert: Gold Rally Expected to Continue.This record-breaking surge in gold prices is driven by multiple factors:
Central banks are purchasing gold, and investors are flowing funds into gold ETFs to hedge against global policy risks and macroeconomic uncertainty.
Furthermore, market expectations of US interest rate cuts in 2026 have further boosted gold prices.
Meanwhile, PCE inflation data (the Fed's preferred inflation indicator) showed that the November data was broadly in line with expectations, further reinforcing market expectations that the US central bank will maintain interest rates unchanged next week. The market widely expects the Federal Reserve to keep interest rates unchanged at its January 27-28 meeting, but the market is still pricing in the possibility of two further interest rate cuts in the second half of 2026, thus increasing the attractiveness of gold, a non-interest-bearing asset.
Gold is increasingly acting as a hedge against President Trump's "unpredictability." It is noted that although many traders view gold as a hedge against the risks of Trump's pursuit of Greenland and the potential for a US-EU tariff war, gold prices have not retreated even after the tariff threats subsided.
Looking ahead, the bullish trend in the gold market is expected to continue, but it also faces downside risks. Goldman Sachs raised its gold price forecast to $5400, based on the assumption that the private sector will not sell off its holdings and central banks will continue to purchase gold. Gold has risen nearly 15% from its level at the beginning of 2026, continuing last year's 64% gain. However, if global monetary policy risks decline sharply, leading to the unwinding of hedging positions, gold prices may correct. Geopolitical variables remain key: Trump's unpredictability is making the EU wary, and while transatlantic relations have temporarily eased, long-term confidence has been damaged, potentially triggering more volatility.
Overall, investors should pay attention to the Federal Reserve meeting, economic data, and developments in the Arctic. Gold's role in the de-dollarization trend is becoming increasingly prominent, serving as a shield against uncertainty. In this era of geopolitical storms, gold is not just an investment commodity, but also an anchor of global stability. The gold market in 2026 will continue to write the legend of a super bull market amidst the interplay of multiple factors.
The upcoming FOMC meeting next week is the core event that will influence gold prices in the short term. If the Federal Reserve adopts a hawkish stance, emphasizing maintaining high interest rates until Q2 2026, it could temporarily reverse market expectations of interest rate cuts, leading to significant fluctuations in gold prices. Conversely, if the Fed signals a dovish stance, confirming the approaching interest rate cut cycle, it will provide strong momentum for gold prices to break through $5,000.
Mainstream institutions generally believe that gold market volatility will increase significantly in 2026, but the structural upward trend remains solid. Core driving factors such as inflation hedging demand, increasing global debt pressure, and the accelerating trend of de-dollarization remain unchanged, and these long-term factors will continue to support the upward movement of gold prices.
The weekly chart shows a large bullish candle, indicating a continuation of the strong trend. There is still upward momentum next Monday, and the trading strategy should focus on buying on dips. However, caution is advised near the $5000 resistance level; chasing the rally should be done cautiously. The key resistance level is around $5050; a small short position can be considered if it fails to break through. If it holds above this level, it is expected to continue rising by more than $50, targeting the $5100-$5200 and even $5300 areas. The first support level is at $4900, with strong support at $4808, both serving as reference points for buying.
On the daily chart, Friday saw an overall upward trend, breaking through and reaching a new high of $4990 during the US trading session, ultimately closing with a long lower shadow bullish candle. The daily support level has moved up to around $4936, and the hourly chart support is at the low of $4958 from the early morning pullback; this can be used as the intraday dividing line between bullish and bearish sentiment, and a buy position can be considered upon touching this level. If the market shows strong momentum, it is expected to trade above $4970-$4980, targeting a breakthrough of $5000 and testing the $5020-$5050 area. Gold prices will only experience a significant correction if they effectively break below $4900; otherwise, the strong upward trend will continue.
Trading Strategy:
Next Monday, consider buying around $4958. If the trend is strong, a buy position can be initiated in the $4970-$4980 area, targeting a breakthrough of the $5000 level;
Consider a small short position near $5050.

US30Bias Probability: Sell
reason:
1) trendline downtrend
Setup: EW W4-W5
Confirmation:
1) W4 (FR 50% W3)
2) W4 (Not Break Highest W1)
Execution:
1) EP: FR 50% W4
2) SL: FR 0% (Highest W4)
3) TP: FR 161.8% (End W5-Confirmation 5 sub-wave)
Min Risk: Reward= 1:2
"Mechanical Trading is Rule-Based trading"

XAGUSD SILVER UPDATE IMPORTANT KEY LEVEL RESISTANCE AND SUPPORTI've attached the revised key level data for Silver, compared to the previous data.
The price hasn't changed significantly; however, this data has refined the analysis to re-determine the key level for the Silver price.
Where is the estimated next resistance level if the 120 level is broken ?
We can look at the data for the next key level.
From this data, we can see the estimated support level at that price if a price correction occurs.
Thank you and best wishes to all of you.

PLTR is currently in a healthy Wave 4 correction within a strongPLTR is currently in a healthy Wave 4 correction within a strong primary uptrend. The main accumulation zone lies between 150–155 (50% Fibonacci), with additional opportunistic accumulation between 145–150. A deeper but still valid accumulation area is 138–142 (61.8% Fibonacci), which would likely represent a temporary shakeout rather than a trend reversal. As long as weekly price action holds above ~138, the bullish Elliott Wave structure remains intact, with Wave 5 targeting the 180–200+ area.”

BTC/USDT 1H Chart Review🔍 Market Structure
• Price is in an ascending channel (higher lows, higher highs).
• Currently, we are in the middle of the channel, after a rejection from above.
⸻
📉 Price Action
• 90,500–90,800 → strong resistance (upper zone + previous rejections).
• The last upward impulse has been reversed, but without breaking the structure.
• Retracement candles are relatively short → no aggressive supply.
⸻
🧱 Key Levels
Resistance:
• 90,500 – local high / reactions
• 91,600 – upper band of the channel (target at breakout)
Support:
• 88,650 – key mid-support (very important decision level)
• 87,400 – lower band of the channel (must hold for bulls)
⸻
📊 RSI Stochastic
• RSI Stochastic in the oversold zone (<20)
• This is a signal for a potential bounce, but:
• candle confirmation needed (e.g., bullish engulfing / higher low)
⸻
🧠 Scenarios
🟢 Baseline Scenario (more likely)
• Defense at 88,600
• Rebound up the channel
• Test at 90,500
• On breakout → 91 600
👉 Typical buy-the-dip setup
⸻
🔴 Negative scenario
• 1H close below 88,600
• Quick move to 87,400
• Loss of 87,400 = structure changes to corrective


GOLD continue rally, supporting area 5401#GOLD.. perfect move as per our last couple of ideas regarding gold.
Now market just closed above his current resistance and that resistance convert to supporting area now.
Keep close n sustain above 5401 we have another high on the table.
Good luck
Trade wisley

Analysis on the 8 Elite PairsAn Analysis with Great Details of the Market Behaviour.Trade Wisely to make a Simple Profit.Just know exactly the Entry Strategy to use to Prevent Losses .Thank u

Bitcoin Loves Bulls Right Now… Until This HappensYello Paradisers! Enjoy the video!
And Paradisers! Keep in mind to trade only with a proper professional trading strategy. Wait for confirmations. Play with tactics. This is the only way you can be long-term profitable.
Remember, don’t trade without confirmations. Wait for them before creating a trade. Be disciplined, patient, and emotionally controlled. Only trade the highest probability setups with the greatest risk to reward ratio. This will ensure that you become a long-term profitable professional trader.
Don't be a gambler. Don't try to get rich quick. Make sure that your trading is professionally based on proper strategies and trade tactics.

$PLTR is now trading under $160. Still holding a large short posNASDAQ:PLTR is now trading under $160. Still holding a large short position and still expecting double digits this year.
Trendline support here (pink), with a potential range support later (blue), could lead to some battling between bulls and bears in this area.
Eventually I expect it will collapse after the fight.
Why? Study behavior of very strong growing companies in the past and see yourself what happens next.
Notably, Palantir has been trading lower since late December while the broader market has trended higher. This means ETF's are still accumulating, but under the surface there appears to be persistent selling pressure. This is very weak behavior that increased the probability on this trade.

MetaDear Traders
heres my analysis for meta on weekly its so bullish heres my targets
lets see how this can play out but before going up possible retest of support
LNKS Long (01-28-2026)
Trading LNKS on its last leg – the 5th wave
Entry:
Take an entry right above the 38.2% Fibonacci retracement level.
Take Profit (TP1):
Exit when price rebounds back to the 100% Fibonacci level at 0.81.
=====
Second Round
Pullback Zone:
Price may drop back into Zone (a) between 0.59 – 0.54.
Re-entry:
Enter again within Zone (a).
Take Profit (TP2):
Exit when price returns to the previous high at 0.81.

GBPUSD What Next? SELL!
My dear subscribers,
My technical analysis for GBPUSD is below:
The price is coiling around a solid key level - 1.3781
Bias - Bearish
Technical Indicators: Pivot Points Low anticipates a potential price reversal.
Super trend shows a clear sell, giving a perfect indicators' convergence.
Goal - 1.3668
About Used Indicators:
By the very nature of the supertrend indicator, it offers firm support and resistance levels for traders to enter and exit trades. Additionally, it also provides signals for setting stop losses
Disclosure: I am part of Trade Nation's Influencer program and receive a monthly fee for using their TradingView charts in my analysis.
———————————
WISH YOU ALL LUCK

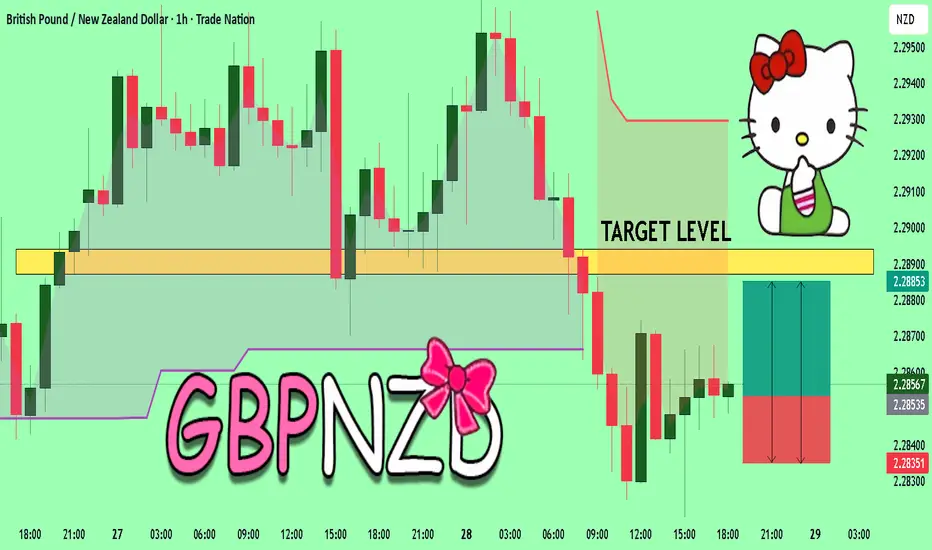
GBPNZD The Target Is UP! BUY!
My dear friends,
My technical analysis for GBPNZD is below:
The market is trading on 2.2852 pivot level.
Bias - Bullish
Technical Indicators: Both Super Trend & Pivot HL indicate a highly probable Bullish continuation.
Target - 2.2887
Recommended Stop Loss - 2.2835
About Used Indicators:
A pivot point is a technical analysis indicator, or calculations, used to determine the overall trend of the market over different time frames.
Disclosure: I am part of Trade Nation's Influencer program and receive a monthly fee for using their TradingView charts in my analysis.
———————————
WISH YOU ALL LUCK
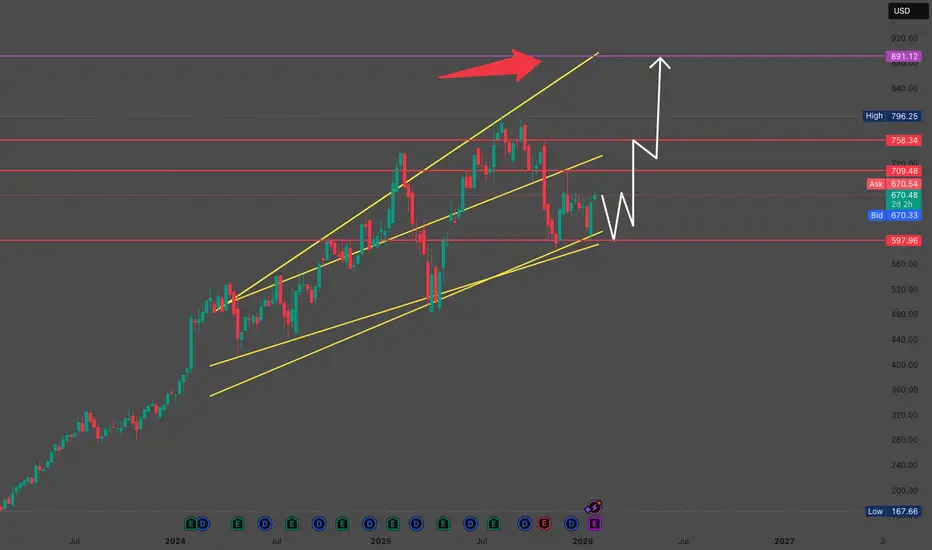
MARKET STRUCTURE (WEEKLY – EUR/USD)Primary Structure
Long-term downtrend ended at Wave 5 low (2022–2023)
Price broke the descending trendline → Trend reversal confirmed
Market is now in a corrective-to-expansion bullish structure
👉 Bias: BULLISH (Higher Timeframe)
2️⃣ PATTERN IDENTIFIED – ABCDE STRUCTURE (EXPANDING CHANNEL)
This is a Rising Broadening / Corrective Expansion Pattern
Often seen before impulsive continuation
Wave Breakdown:
🅰 A – Initial Rejection Zone
Strong resistance around 1.13–1.15
Previous sellers defended this zone
🅱 B – Strong Impulsive Low
Deep retracement → Liquidity grab
Confirms strong buyers entering the market
🅲 C – Break of Structure (BOS)
Price breaks above A
Confirms trend shift
Market accepted higher prices
🅳 D – Healthy Pullback (Key Zone)
Pullback into:
Previous resistance = New support
0.5–0.618 fib area
This is NOT weakness, this is accumulation
🅴 E – Expansion Target
Measured move of the channel
Confluence with:
HTF supply
Liquidity pool
Final upside objective

S&P500 end cycle in progressHere what I think about the last movement.
Here we will see that we are coming to the end of a cycle and that we are inevitably going to see a decline in the S&P 500 and all the changes that go with it.
