XAU/USD NEXT MOVEGOLD NEXT MOVE...
Let me know what you think about my analysis in the comment section, and please hit boost and follow for more ideas.
Trading is not hard if you have a good coach! Thank you.
Wave Analysis


Is XAUUSD ready for a run-down? On dec 5th, the bulls attempt to take control, the bears reject that attempt.
Bears took control by the end of dec 5th, signaling that bulls have lost control at a strong resistance level.
The opening of the week on dec 8, will indicate what the week will look like.
Stay sharp and a tune for a false signal that may be present at the opening of the week.
Seek validation on Dec 9 if that occurs.
Trade when the opportunity presents not when you think it is time to trade.

EURUSD Elliott Wave OutlookThe daily EURUSD structure continues to support a Wave 4 contracting triangle interpretation. Wave d appears complete at the recent swing high, and the pair is now expected to work lower in wave e toward the lower boundary of the triangle and the 0.382–0.5–0.618 Fibonacci retracement cluster of the prior advance.
As long as price holds above the triangle floor and the base channel, the higher timeframe bias remains bullish and the Wave 4 label stays valid. Once wave e completes within this support zone, the next anticipated move is a Wave 5 thrust higher, with a measured triangle target near 1.20697.
Key points:
Wave 4 daily triangle in progress
Wave d high in place, wave e developing lower
Wave e downside zone: 0.382 / 0.5 / 0.618 Fibs
Invalidation: break below triangle and base channel support
Wave 5 upside objective: ~1.20697 triangle thrust level

CADJPY – Final Diagonal Before the Drop!We’ve been tracking CADJPY for years, and price continues to follow Elliott Wave structure with precision.
The major decline in 2024 completed wave (1) and triggered a higher-timeframe correction. Since then, price has developed a clear W–X–Y structure.
- W topped in late 2024
- X completed after a clean ABC decline
- Price is now in wave Y, unfolding as a zigzag (5-3-5)
Within Y, waves (A) and (B) have completed, and price is now pushing through the final 5-wave structure of wave (C). This final diagonal is what will complete the entire W–X–Y correction before the next major bearish leg begins.
Our focus is now on the ending diagonal forming in wave (C). Once this diagonal structure breaks, it will confirm that wave Y has completed and that the higher-timeframe downtrend is ready to resume.
Trade Idea:
Entry: Break of the diagonal
Stops: Above the break candle / above the final high of the diagonal
Targets:
TP1: 101.50 (1200 pips)
TP2: 95.00 (1850 pips)
Optional runner: Keep a portion open for long-term continuation
Goodluck and as always, trade safe!
See below for our previous CADJPY analysis:
Swing 1:
Swing 2:
Swing 3:
Swing 4:

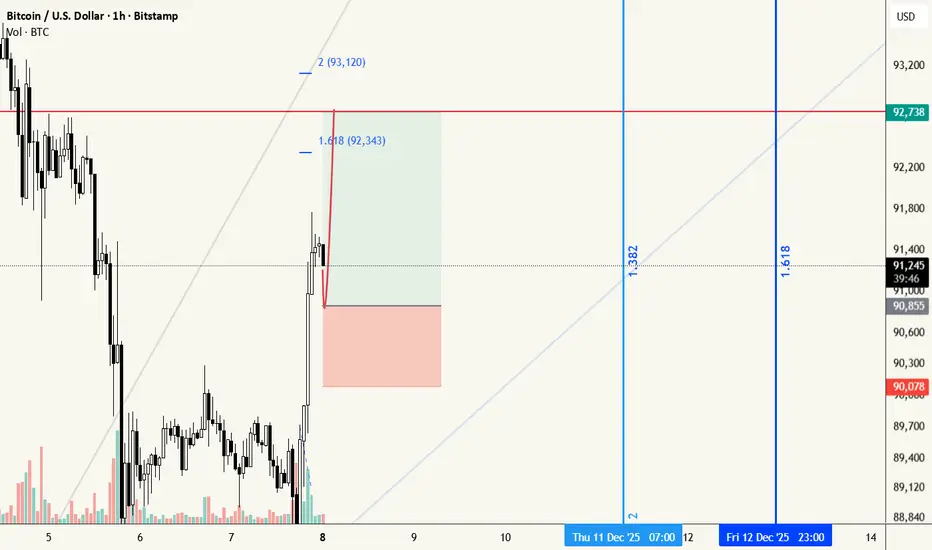
scalp long for bitcoina scalp setup for long in BTCUSDT.
entery : 90850
SL: 90000
TP : 92400 92700 93000
Always DYOR.
BTCUSD – 4H Market Structure & Wave ProjectionMarket Context
BTC is in a macro bearish trend, but currently forming a bullish corrective structure from a strong demand zone.
Price reacted from a key support base (≈ 84,500 – 85,300), suggesting smart money accumulation.
Wave Structure
Wave (1): Impulsive move up from demand, showing strength.
Wave (2): Corrective pullback into the demand zone (support held).
Wave (3): Expected strong expansion toward 104,000 – 105,000 (previous structure resistance).
Wave (4): Healthy pullback / consolidation.
Wave (5): Final expansion into 108,000 – 110,000 supply zone.
Key Levels
Major Support: 84,500 – 85,300
Invalidation: Below 83,300 (structure break)
Mid Resistance: 91,900 – 92,000
Target 1: 104,000 – 105,000
Target 2 (Supply): 108,000 – 110,000
Bias
✅ Bullish while above demand
❌ Bearish if support fails below 83,300
Trade Idea
Buy on pullbacks holding above demand
Partial profits at 91,900 and 104,000
Final TP at supply zone
Confirmation
Look for bullish candles + momentum continuation on 4H
Momentum should expand during Wave (3)

BRIEFING Week #49 : Watch Oil & USDJPYHere's your weekly update ! Brought to you each weekend with years of track-record history..
Don't forget to hit the like/follow button if you feel like this post deserves it ;)
That's the best way to support me and help pushing this content to other users.
Kindly,
Phil

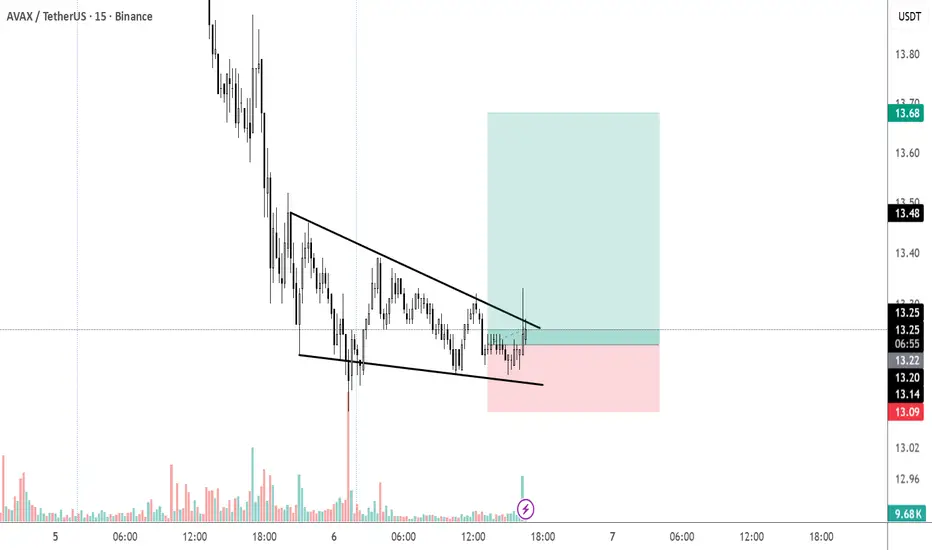
AVAX – 15m Technical Analysis (Breakout Setup)🔥 AVAX – 15m Technical Analysis (Breakout Setup)
( BINANCE:AVAXUSDT )
✅ 1) Pattern Analysis – Falling Wedge
A falling wedge usually signals that sellers are weakening, and buyers are absorbing liquidity.
What confirms the breakout?
Price broke above the wedge’s upper trendline.
A large bullish candle with increased volume.
Retest area around 13.20–13.25, which is happening now.
📌 This is a classic bullish breakout behaviour.
✅ 2) Entry Logic
The entry around 13.25 is technically correct because:
It's exactly at the breakout retest zone.
Buying pressure is visible.
Volume supports continuation.
This setup is high probability when supported by volume (which is clearly rising).
✅ 3) Stop Loss (SL)
Your SL below 13.05 – 13.10 is perfect because:
It sits below the wedge structure.
If price returns below this level, the breakout becomes invalid.
This is the correct technical placement.
✅ 4) Take Profit (TP) Projection
Your TP zone around 13.70 – 13.80 is realistic and matches:
Previous major support turned resistance.
Measured move of wedge height placed at breakout.
High-volume node from earlier.
✔ Expected targets:
TP1 → 13.48 (first resistance)
TP2 → 13.68 (upper range)
TP3 → 13.78–13.80 (full wedge target)
✅ 5) Market Behaviour to Expect
After a falling wedge breakout, price typically:
Breaks the trendline ✔
Pulls back slightly to retest the breakout level
Then accelerates upward toward targets
ETHUSDT – Big Reversal Zone TriggeredHi fellow traders,
On the 1D ETHUSDT chart, I am applying Elliott Wave principles to outline a potential long setup. Price is reacting strongly after completing a deeper correction, and the current structure suggests continuation to the upside within the larger impulsive sequence.
I am entering at the current price, with a Stop Loss at 2400. My Take Profit is positioned at 5267.34, targeting the next objective within this bullish structure.
If price drops below the stop level, this trade is no longer valid.
Structure first. Noise second.
Good luck and trade safe!

88K IncomingA liquidity sweep under 88K is imminent. A lot of buy orders currently are likely to trigger a manipulation and a downtrend seeking the 88K region.

07.12.25 Market AnalysisSorry for microphone, but i think i give you important levels of nasdaq, bitcoin, gold, usdjpy, wti and more.. Next week BOJ and FED will come with spicy news :) so be carefula about positions. Better smaller lots..
Thanks for now. Videos will come..
DYOR.
MEC

Gold (XAUUSD) 4H Key Levels & Strategy🔥 Strong Buy Zone: 4385 ➜ Targets 🎯 4500, 5000
❗ If 4385 fails to break → 🔻 Sell toward 4200, 4000
🟢 Buy Zone: Break above 4261 ➜ Targets 🎯 4300, 4350
🟩 Buy Opportunity: Break above 4221 ➜ Targets 🎯 4248, 4260
🔴 Strong Sell: Break below 4180 ➜ Targets 🎯 4150, 4100
⚠️ Major Breakdown Level:
Strong Sell below 4100 ➜ Targets 🎯 4000, 3900
📊 Trend Status:
Market approaching critical resistance zones. Watch for breakout confirmation above 4221 & 4261 for bullish continuation. Rejection can push price back toward 4180 & 4100 levels.
💡 Trading Tip: Always wait for candle close confirmation on 30 M to avoid fakeouts.
🚀 Smart Levels • 📉 Clean Structure • 🔮 Future-Focused Trading
⚠️ NOTICE
This analysis is for educational purposes only. 📚
Not financial advice. 💼
Always do your own research and trade at your own risk. ⚠️
Market conditions can change rapidly — use proper risk management. 🛡️

07-12-2025 _ Short Term Bearish Idea _ USDCAD H41- Double Top coupled with Divergence.
2- Followed by series of Lhs and LLs.
3- Bearish convergence on MACD indicator.
4- No Divergence against.
5- Therefore, after pullback one can expect a push to the down side.

07-12-2025 _ Short Term Bullish Idea _ AUDUSD H41- Price is making HHs and HLs in an impulsive move.
2- Price has broken above the consolidating channel.
3- Convergence on MACD indicator.
4. Price may undergo shallow retracement followed by a move to the Up Side.

BTC/USDT 4H Chart 🔍 MARKET STRUCTURE
The chart shows a broad ascending channel in which BTC has been moving for several days:
Lower trend support: ~$87,500 – $88,000
Upper trend line: ~$94,500 – $95,000
The price has clearly rebounded from around $89,200, an important demand level.
📈 KEY LEVELS
Support
USD 89,284 – local support from which a rebound occurred
USD 87,804 – the next, much stronger support level consistent with the trendline
Resistance
USD 91,466 – currently being tested
USD 94,141 – key resistance and the upper band of the channel
📊 CHART SITUATION (4 hours)
1. Price action
The price has made a strong upward impulse from support at USD 89,280.
It is currently reaching local resistance at USD 91,450 – USD 91,700.
If this level is broken, the target is USD 94,000 – USD 94,500.
If it fails, a pullback to USD 90,200/USD 89,300 can be expected.
📉 MACD
Your MACD shows:
Bullish crossover – buy signal.
The histogram changes from red to green → momentum is increasing.
The curves are diverging, confirming the strength of the move.
This indicates that the short-term trend is turning bullish.
📌 TWO TRADING SCENARIOS
🟢 BULLISH Scenario (more likely)
Condition: H4 candle breakout and close above USD 91,700.
Targets:
TP1 → USD 92,800 – USD 93,200
TP2 → USD 94,000 – USD 94,500 (upper channel)
Stop-loss (if you were going long):
below USD 90,500
Safer below USD 89,280
MACD confirms this scenario.
🔴 BEARISH Scenario
Condition: rejection of USD 91,700 and a close below USD 90,500.
Targets:
TP1 → USD 89,300
TP2 → USD 87,800 (key trendline)
A drop to USD 87,800 would be an ideal place for large players to buy again.

07-12-2025 _ Short Term Bullish Idea _ GBPUSD H41- Series of HHs and HLs
2- Price has broken above Falling Trendline Zone and is now consolidating above it.
3- One can expect retracement to Fibo. 38.2 - 61.8% Zone followed by a push to the Up Side

BTCUSDT next moveIn my opinion according to elliot waves, we are in the final stage of a WXY wave which will be around 96 - 98 K and then we will go down

07-12-2025 _ Short Term Bullish Idea _ EURUSD H41- Price is moving in a rising channel making HHs and HLs.
2- Falling Trendline breakout.
3- Bullish Convergence on MACD Histogram and MAs.
4- Hidden Divergence on MACD suggesting a move up.

Growth up to 200% according to NFPTo date, the market continues to move exactly according to the scenario that I outlined in the last review. On Monday and Tuesday, the probability of a flat with sales attempts prevails, but from the middle of the week I expect the bullish trend to continue as part of a pullback on the annual candle and seasonal growth with an attempt to consolidate in the range of 3250-3500 ETH.
This week, NFP and SHELL reached medium-term supports, which I am now taking into account to work alongside TURTLE NTRN MITO VIC ENSO HOOK BMT. At the moment, 50% of tokens are already in circulation with further smooth unlocking, which will put minimal pressure on the price. In the future, the area for reliable scalping will shift slightly next year. For this instrument, there are long-term technical signals for growth up to 0.35-45, that is, 10X+. However, with the current bear market, we can still expect an attempt to retest the 0.060-75 range with a further pullback and resumption of growth in a new annual candle, which can already bring up to 150% profit. The intermediate resistance is the 0.05 level. If the daily or weekly candle opens higher, an active continuation of growth is likely. The opening of the second half of the month above this level will also be a signal for support.

$XAUUSD FORCAST BULLISH ANALYSIS ( READ CAPTION )hi traders! today 07 DECEMBER 2k25 here is my today XAUUSD analysis please read it and send me your ideas in comment section for more analysis.
OANDA:XAUUSD pivot point is 4199, XAUUSD long channel support holding buyers target 4300.
structured bullish progression after a period of heavy distribution inside the supply zone. Earlier, gold established wide range between the supply and demand areas, with multiple sharp rejection, forming the top of the structure. eventually, sellers pushed the price lowers initiating a corrective declined that developed into a well-defined Triangle Pattern, market by a descending Triangle demand line. This compression ended with a clean breakout to the upside, signaling the beginning of a new bullish phase. Following the breakout, XAUUSD formed a Pivot point near the mind-range level, where price briefly rejected before continuing its upward trajectory. Another notable phase was the formation of an inverse Head-and-Shoulders structure conforming buyers strength after a fake breakout below the neckline this reversal pattern provided the foundation for current bullish continuation.
Please dont forget like and comment for latest XAUUSD updates
This analysis for informational purposes only. Trade is own your risk.

USD/JPY 4H Analysis — Potential Breakout SetupUSD/JPY has been trending inside a descending channel since late November, making consistent lower highs and lower lows.
Current price is testing the upper channel resistance near 155.35–155.50, and the SMA (9) is flattening toward SMA (20) — indicating weakening bearish momentum.
🔥 Trade Bias: Neutral → Bullish Above 156.00
🔍 Key Levels:
Resistance: 156.00 – 156.20 (Breakout Zone)
Minor Support: 155.00
Major Support: 154.60 – 154.40 (Channel Bottom)
📈 Bullish Scenario:
Break & candle close above 156.00 triggers bullish momentum.
Upside Targets:
156.50
157.20
158.00
📉 Bearish Scenario:
Price rejection from the channel top may push price lower toward:
155.00
154.60
154.40 (Bounce Zone)
📊 Indicators:
Price stuck at upper trendline → decision zone
SMA 9 approaching SMA 20 → momentum shift
Volume likely to spike on breakout
🧭 Trade Plan (Clear & Simple):
Buy Only Above: 156.00 (confirmation candle)
Sell Only Below: 154.60 (channel break)
⚠️ Risk Note:
Upcoming U.S. economic events may trigger volatility — trade with SL.

BTC Zones - BullishBitcoin is within an ascending channel on larger tf's. I think the upper zone will offer some chop before an ultimate blow-off top by the end of the month. Bear beware.
