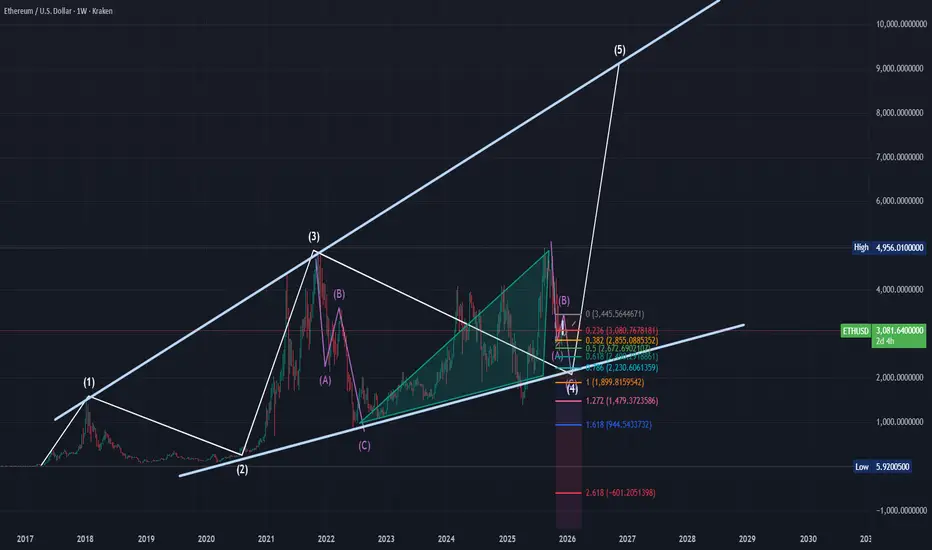
Ethereum - The bearmarket is not over yet!🪚Ethereum ( CRYPTO:ETHUSD ) can still drop about -30%:
🔎Analysis summary:
Over the past four years, Ethereum has been creating a major bullish triangle. With the recent all time high retest, we are now seeing an expected reversal. But considering the bullish nature of this triangle, Ethereum will head higher after a retest of the next support.
📝Levels to watch:
$2,000
SwingTraderPhil
SwingTrading.Simplified. | Investing.Simplified. | #LONGTERMVISION
Wave Analysis

$BTC - $DXY -$SPX - $NDX - $GOLD 11/12/2025 forecastWhile the past days saw a fairly moderate negative energy across an index at a time, things will now complicate. As we're looking for both CRYPTOCAP:BTC , TVC:GOLD and NASDAQ:NDX (the latter still waiting to properly discount the incoming negative days) to witness huge peaks of negative energy, at 3:49 am UTC and particularly at 7:50 am UTC being the hardest one, volatility will further increase as we get towards 12/12/2025.

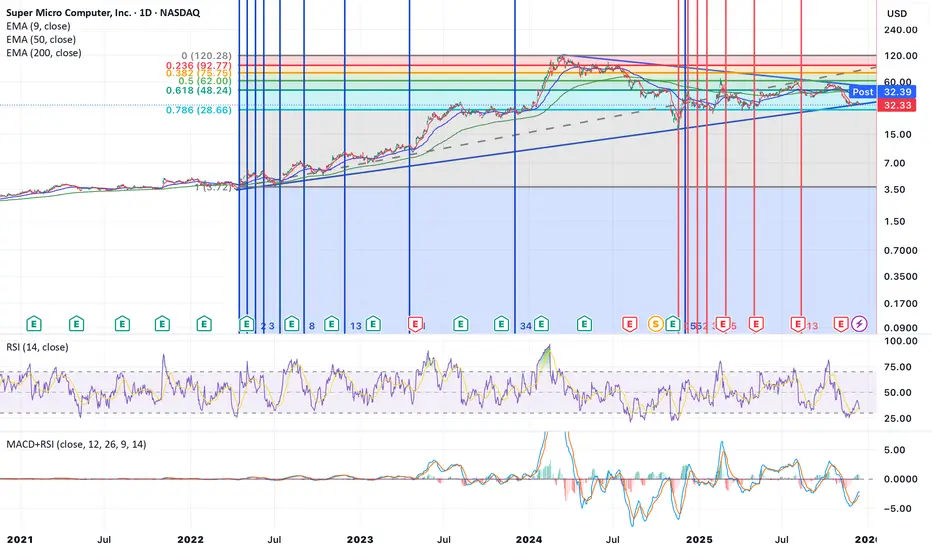
Super Micro Computer, Inc. (SMCI)Technical Analysis (from your chart)
Trend & Structure
• The stock has been in a long-term uptrend since 2022 with several consolidation phases.
• Multiple support/resistance horizontals and trendlines are drawn — price currently sitting near a major support zone around ~$30–$35.
• Price oscillates around the 50 & 200 EMAs — often a sign of trend indecision or transition.
Oscillators
• RSI (14): currently mid-range — not strongly overbought or oversold, but recent downward bias suggests short-term bearish momentum building.
• MACD: recent signal line crossover indicates possible short-term relief bounce, but overall trend direction still unclear.
Key Levels
• Support: ~$30 (historical pivot, rising trendline)
• Resistance: ~$50–$55 (cluster of previous highs)
• Break above/below these could signal the next leg.
Short-Term Bias: Neutral to slightly bearish until confirmation above recent range high.
⸻
📈 Fundamental Snapshot
Valuation
• P/E (TTM): ~27–29x — moderately high relative to historical norms but not extreme for tech hardware. 
• Forward P/E: ~19–20x — suggests expected earnings growth priced in. 
Earnings
• EPS (TTM): ~1.25–1.67 (data vary slightly by source) 
• EPS recently declined year-over-year, reflecting tightening margins and cost pressures. 
Profitability & Other Ratios
• Profit Margin around ~4–5% — fairly slim for tech. 
• P/B: ~3.1–3.6, P/S: ~0.9–1.0 — moderate valuation relative to sales and book. 
Company Context
• Serves servers/storage for enterprise, cloud, AI & 5G. 
• Revenue growth and EPS have shown volatility due to demand cycles and cost pressures. 
⸻
📌 Trade-Ready Summary (Caption-Style)
SMCI – Super Micro Computer (NASDAQ)
Current Price: ~$32–33
P/E (TTM): ~27–29x
Forward P/E: ~19–20x
EPS: ~1.3–1.7
Key Support: ~$30
Key Resistance: ~$50–55
Tech View: Price holding long-term trend support; oscillators neutral to bearish short-term. Need break above recent range for bullish confirmation.
Fundamental View: Valuation reflects growth expectations but margins are thin; earnings have recently softened.
Bias: Neutral to cautious — trade range, watch breakout or breakdown.
Sark into the 5-0Shark appears to have been completed at the 113 area of our top of the old high and reversed. Let’s see if we can get into the 5-0 toward 47200.

Breaking; Tilray Brands, Inc. (NASDAQ: TLRY) Spike 41% Today Shares of Tilray Brands, Inc. (NASDAQ: TLRY) saw a noteworthy uptick of 41% today defying market sentiment. For the past 2 days the stock has bounced from the $7 support zone eyeing the $15 resistant point.
Ascertaining the bullish thesis is the RSI at 56, giving room for further price uptick since the asset is not overbought.
In another news, Trump expected to sign executive order to reclassify marijuana as soon as Monday, source tells CNBC.
President Donald Trump is expected to issue an executive order as soon as Monday that would allow for reclassification of weed, a source familiar with the matter told CNBC. Such a move would allow cannabis companies to fall under different tax regulations and encourage investment.
Cannabis stocks took a leg up in Friday’s midday trading following CNBC’s report.
Tilray shares were recently trading at a little more than $10 after peaking at more than $2,140, adjusted for splits, in September 2018. The Amplify Cannabis ETF is still on track to lose more than 8% in 2025, its fifth straight down year.
Analyst Summary
According to 3 analysts, the average rating for TLRY stock is "Buy." The 12-month stock price target is $150.0, which is an increase of 1,259.93% from the latest price.
Tilray Brands, Inc., a lifestyle consumer products company, engages in the research, cultivation, processing, and distribution of medical cannabis products in Canada, the United States, Europe, the Middle East, Africa, and internationally.

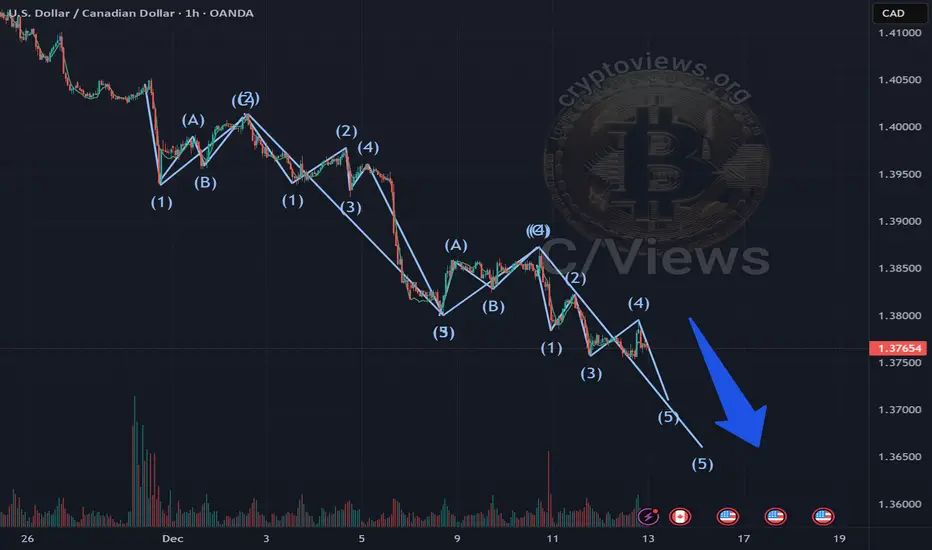
CADX Showing Potential Completion of Elliott Wave StructureCADX is forming a 5th Elliott wave, which suggests the movement is more likely to continue downwards
Based on the 2nd wave, we can estimate the approximate length of the 5th wave
Price movement levels are more likely to be determined using Fibonacci numbers
Full breakdown with levels and graphs on the website
Super Analysis of ETHEREUM Elliot Wave Count Macro and MicroFirst a macro view
Ethereum currently in its final phase of corrective wave 4 as depicted. For the overall macro structure a super massive leading diagonal fits the fifth wave perfectly. A 8-10k ethereum in late 2026 followed by a big crash ( a wave 2 retracement off the ath) matches my approximate timeline with the inevitable recession.
Wave 4 is an abc corrective followed by an expanding triangle in teal colour (or can be just a bunch of three waves) followed by another abc - which seems to be a triple zig zag that i will
detail in the following lower timeframe micro view.
I also have highlighted the fib extension of the triple zig zag Y and leads us with an ~1850 Ethereum wave Z finish. More explained below.
I will also validate this with a number of approaches and confluence.
So heres a closer loook. We have the first impulse wave of the low 1384 in april 2025 and it finishing at a peak of 4957.
We are now in corrective wave 2 which is mainly the triple zig zag i have outlined as the wxyxz.
(the distributive ethereum top has some three waves connecting the wxyxz)
Now heres a bunch of validation.
1) The wave 2 retracement is on target for the 0.754 - 0.886 fib target where you can see with the smiley face on the left.
2) This is a perfect finish as it also fills in a fair value gap from an eth pump may 2025. Left Smiley face.
3) Triple zig zags wave Z can be 100 or 127.2 or 161.8 of wave Y. In this case it is the most common occurring 100% and leads us to a ~1840 ether.
4) This stays and lands in the parallel channel nicely
5) This value also lands on the huge multi year ascending trendline bottom support for ether as well
6) So as you can see by the smiley face on the right side there is huge confluence. fibonacci retrace of wave 2 pf 1. the fair value gap. the size of wave z compared to y fitting nicely. the landing of the trendline and parallel channel match.
also note validation of the connector WX and YZZ being approx durations of 17 and 19 days well within the elliot wave rules/standards.
I have highlighted a rectangular box for a nice buy in the 1800-2200 range for ether.
In addion you can further find extra confluence with bitcoin technical analysis and eth/btc charts. Now the above is heavily dependent on eth/btc ratio breaking down or not..
If eth / btc breaks down (yes that seems to be a fakeout to the upside recently) and sweeps out the price action at july 2025 it is a perfect golden fib retrace at around 0.027 and 0.03
Hence, for example say bitcoin breaks down and filling the fvg of the TRUMP pump Nov 2024, that leaves us a nice round simple figure of 70k. match it with my expectred 0.028 eth/btc and you get 1960. Perfectly sitting in my highlighted rectangular box (1800-2200).
So yes when doing technical analysis its good to relate as many things as possible. Many ppl dont look at the eth/btc ratio but it another branch or avenue to help and assist with confirmations.
XAU/USD NEXT MOVEGOLD NEXT MOVE...
Let me know what you think about my analysis in the comment section, and please hit boost and follow for more ideas.
Trading is not hard if you have a good coach! Thank you.

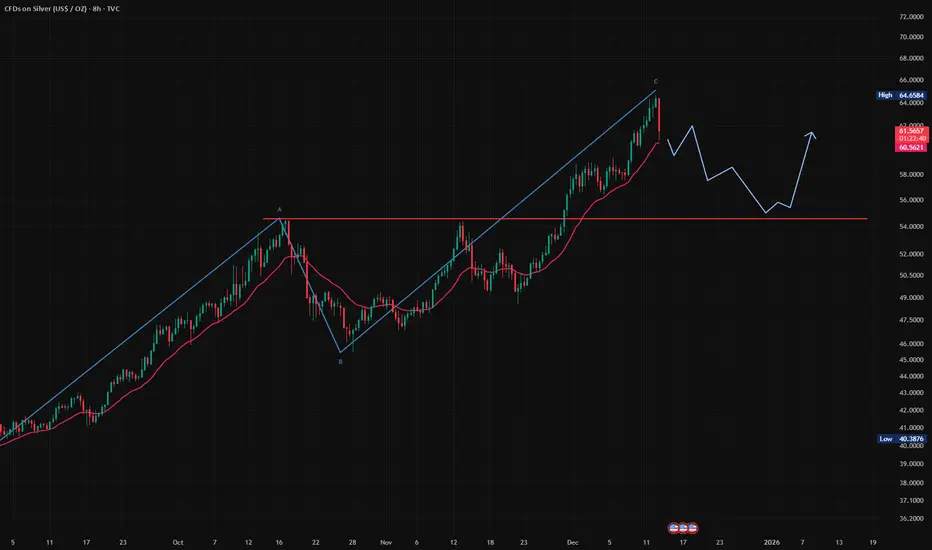
#SILVER just tagged multiple upside targets after an extended #SILVER just tagged multiple upside targets after an extended wedge-style leg — and the response was clear: heavy selling right into those highs.
From here, the best-case scenario for bulls is likely a choppy, sideways range over the coming weeks as the market digests this move.
My base case: a 10–20% pullback to reset sentiment and structure, followed by fresh highs in 2026 as the larger bull trend resumes.

BITCOIN SIGNAL: ARE BEARS PREPARING TO CRASH BTC??????!!!Yello Paradisers! Enjoy the video!
And Paradisers! Keep in mind to trade only with a proper professional trading strategy. Wait for confirmations. Play with tactics. This is the only way you can be long-term profitable.
Remember, don’t trade without confirmations. Wait for them before creating a trade. Be disciplined, patient, and emotionally controlled. Only trade the highest probability setups with the greatest risk to reward ratio. This will ensure that you become a long-term profitable professional trader.
Don't be a gambler. Don't try to get rich quick. Make sure that your trading is professionally based on proper strategies and trade tactics.

$SMCI: high probability the $31 support fails.Bulls threw a decent punch but only managed to retrace a small part of the November downtrend – typically a bad look for the long side.
On top of that, the latest headlines out of NYSE:ORCL and NASDAQ:AVGO add more pressure to Super Micro’s outlook. Overall, the risk skew here still favors the bears.


The Road to DOW 100KWhy the Fourth Turning Won’t Resolve Until Super Cycle Wave III Peaks and Wave IV Finds Bottom:
As we close out 2025 with the Dow Jones Industrial Average within reach of the psychological 50,000 level and despite all the well-deserved doom and gloom, the question on every die-hard bullish investor’s mind is not if the index will reach 100,000, but when — and what price will be paid along the way.
Some analysts interpret the structure as Grand Super Cycle Wave III (or V), depending on where they anchor the pre-industrial baseline. This distinction does not alter the implications: under both counts, the current advance is still part of an extended third wave, and third waves are not where secular crises resolve. They are where excess accumulates.
The rarely seen proprietary chart above from 1693, which splices British Stock prices and the Clement Burgess Index to the Dow, presents a radical yet rigorous Elliott Wave-based perspective:
Before unpacking the connections, a brief orientation is helpful. Elliott Wave degree structures range from small, short-term patterns up to century-scale formations known as Cycle, Super Cycle, and Grand Super Cycle. These higher-order waves capture long economic booms, demographic arcs, technological eras, and broad civilizational moods. When an impulse of this magnitude is still unfolding, the society riding atop it rarely enters true crisis resolution until the wave completes.
The entire advance of the Dow from the 1896 low is part of one single Super Cycle III wave. It is currently in the late stages of a smaller and ongoing 16-year Cycle Wave V within a larger GRAND SUPER CYCLE Wave III (or V, depending on the higher-degree interpretation). The implications are profound.
NOTE: It took 66 years (1900-1966) for the Dow to advance 10x from 100 to 1000, then only 33 years (1966-1999) for another 10x move from 1000 to 10,000. If Elliott’s rule of alternation applies, it might be 66 years from 1999, or 2065, before the Dow advances another 10x from 10,000 to the 100,000 level. Should a Venezuela-like inflation occur in the coming years, it is conceivable that the Dow reaches its 10x 100K milestone 33 years from 1999, or by 2032.
The generational crisis known as the Fourth Turning — the societal upheaval Strauss and Howe originally predicted would end by 2026 — will not find resolution until Super Cycle Wave III tops and its corresponding Wave IV bottoms, likely sometime between 2030 and 2036.
BULLISH NOTE: As captioned beneath the chart above, it is plausible that strong inflationary winds can extend the current 16-year Cycle Wave V to 2030-2032, inverting our suspicion for a severe decline into this period. If this occurs, Super Cycle III will have thrown over the upper trend channel and be marked accordingly.
Because Super Cycle III has not yet peaked, the conditions required for a true Fourth Turning catharsis have not yet formed. Instead of concluding, the crisis continues to compound—geopolitical fractures, monetary instability, demographic strain—held in suspension by a still-advancing secular market wave. The tension builds, but the break has not arrived.
Until Super Cycle III peaks, perhaps in 2026, when it surpasses the 5X threshold of 50K after passing its last major 10X milestone at 10K in 1999, the path remains upward with violent trepidation.
The Grand Channel: A 330-Year Perspective
When British stock data from 1693 is spliced with the Dow Jones Industrial Average beginning in 1896, a remarkable parallel channel emerges:
The lower trendline connects the Clement Burgess 1857 low, the 1896 low, and the 1932 low.
The upper trendline is a parallel copy drawn from the 1720 South Sea Bubble peak, which aligns rather nicely with the current print highs in the Dow for 2025-2026. A throw-over above the upper trend channel is always possible.
This channel has contained the entire modern equity advance for over three centuries. The current price action is pressing hard against the upper boundary — a classic termination signal in Elliott Wave analysis.
The Grand Super Cycle uptrend channel from 1693 to the present.
Super Cycle Degree: One Unfolding Impulse
The entire move from 1896 is labeled as a single Super Cycle advance:
Super Cycle I — 1857 low to 1881 high
Super Cycle II — 1929 crested with an expanded Cycle degree B wave peak high leading to the 1932 low (a sharp, primary five-wave down Cycle degree C-Wave correction terminating Super Cycle II).
Super Cycle III — 1932 low to present (extended, currently completing an extended Cycle V)
The post-1932 advance is not five complete Super Cycle waves. It is an extended third at Super Cycle degree still in progress, with the current rally from the 2009 low representing Cycle V within that larger III wave.
This labeling reconciles and defines the extraordinary duration and amplitude of the bull market without violating Elliott’s rules of proportionality and alternation.
Primary and Cycle Degree: The Final Leg
Within the ongoing Super Cycle III, the advance since 1932 subdivides into five clear Cycle waves with an additional subdivision at the primary degree between 1942 and 1999.:
Cycle I — 1932–1937
Cycle II — 1937–1942
Subdivided Primary Degree (within Cycle III):
Primary 1 — 1942-1946
Primary 2 — 1946-1949
Primary 3 — 1949-1965
Primary 4 — 1965-1982
Primary 5 — 1982-1999
Cycle III — 1942–1999
Cycle IV — 1999–2009
Cycle V — 2009-present (extended, currently in its terminal phase 2025-2032)
The post-2009 Cycle degree rally is the last of Cycle V (terminal to Super Cycle III from the 1932 low) — the structure that produced the extraordinary gains of the past sixteen years.
FOUR DEGREES of TREND: Grand Super Cycle Waves are the largest Roman Numerals noted in red, Super Cycle labels are in black, Cycle degree in blue, and the smallest Primary waves are illustrated with standard red numerals and letters.
The Fourth Turning Resolution
The Strauss-Howe updated Fourth Turning framework predicts a period of intense societal crisis peaking in the late 2020s to early 2030s.
In Elliott Wave terms, this crisis corresponds to Super Cycle Wave IV — the deep, multi-year correction that must follow the completion of Super Cycle III.
This correction will likely take the form of a sharp zig-zag, or complex combination, lasting 3–8 years and retracing at least 38% of the entire advance from 1857. Such a decline would drive the Dow down toward the COVID lows of 2020, near the 18,000 level.
The resolution of this Fourth Turning — the rebirth phase — will not begin until Super Cycle Wave IV finds its bottom, projected to occur within the 2030–2036 timeframe.
Only then will Super Cycle Wave V begin — the final advance that carries the Dow to its next 10x target of 100,000.
Conclusion
The market is not yet in the final stages of a multi-century bull market ending in a grand cycle collapse, but rather approaching a Super Cycle Wave IV bear market event , which could still strip the Dow by 60-65% before the Super Cycle V wave bull resumes. The Dow is in the late stages of a multi-century third wave that still has one more explosive leg ahead to tag the Grand Super Cycle terminal.
The Fourth Turning crisis will be severe, but it will be a corrective event within a larger bullish structure — not the end of the Grand Super Cycle advance.
Although investors may wish to sidestep the pending decline, those who mistake Super Cycle Wave IV for the end of the bull market will miss the greatest opportunity of the coming generation.
The channel is speaking.
The waves are clear.
And after some much-needed, long overdue, and well-deserved pain, 100,000 on the Dow remains not just possible — but inevitable. Let’s hope so, anyway.

Filecoin Wave Analysis – 12 December 2025- Filecoin broke key support level 1.435
- Likely to fall to support level 1.000
Filecoin cryptocurrency recently broke below the key support level 1.435, which reversed the price twice from the start of December (this level also supported the coin during most of October).
The breakout of the support level 1.435 accelerated the active impulse wave v of the higher downward impulse wave C from November.
Given the overriding daily downtrend, Filecoin cryptocurrency can be expected to fall further to the next support level 1.253 (monthly low from November) – the breakout of which can lead to further losses to 1.0000.

ETH | TRADE ANALYSIS📌 Trade Setup:
* Entry Level: 3,071
* Stop Loss: 3,026
* Target: 3,155
ETH is holding above an important intraday support zone, showing signs of renewed buyer interest. Momentum is gradually shifting upward, and if price sustains above the entry zone, a push toward the target area becomes likely. This setup focuses on short-term strength, with clear levels for controlled risk.
Disclaimer: This is not financial advice; it reflects only my personal market analysis. Please do your own research before trading.


Huge Distribution started?! 👀BTC is in a big big distribution now, in MY opinion.
A time where the mainstream media enters the crypto market.
Everybody wants to be in crypto soon!
That's also the "take-your-profits-time".

💥First top almost in?! 💥According to my analysis with different methods, BTC might be near its first bullrun top at ~95.000$. That'd be a good point to take the first profits.
NFA.

MP shortDowntrend + Wedge (continuation pattern ), near resistance
Looks like Wave 12345 + Wave ABC
Stop 67,
Short entry 63
Target 45
Risk management is much more important than a good entry point.
I am not a PRO trader.
In my trading plan, the Max Risk of each short term trade should be less than 1% of an account.

BITCOIN UPDATED WAVE STRUCTURE 94980 to 96100 The chart posted is an Update to the formation in bitcoin The best of trades WAVETIMER !

EURAUD: Weak Market & Bearish Continuation
It is essential that we apply multitimeframe technical analysis and there is no better example of why that is the case than the current EURAUD chart which, if analyzed properly, clearly points in the upward direction.
Disclosure: I am part of Trade Nation's Influencer program and receive a monthly fee for using their TradingView charts in my analysis.
❤️ Please, support our work with like & comment! ❤️
