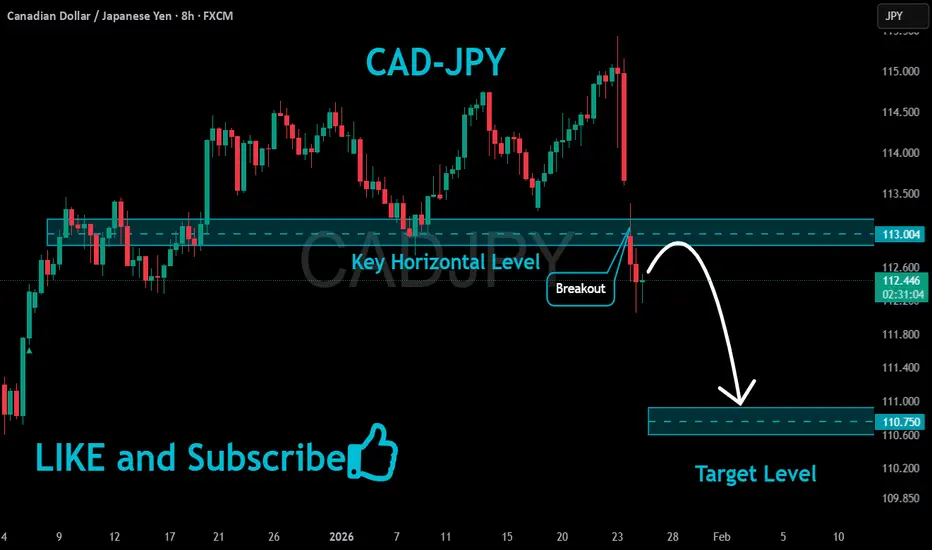
CADJPY Bearish Bias!
HI,Traders !
#CADJPY is trading in a
Downtrend and the pair
Made a bearish breakout
Of the key horizontal level
Of 113.004 which is now a
Resistance and the pair is
Making a local pullback
To retest the new resistance
From where we will be
Expecting a further
Bearish continuation !
Comment and subscribe to help us grow !
Wave Analysis
Gold - Path to 5,000At the moment, no deep correction has started - the upward move continues.
Wave calculations suggest the following structure: we are currently in wave 5 and forming its internal sub-waves.
Overall, price is very close to completing the entire move.
One of the nearest targets is 4,830 , where we are likely to see either a reversal or at least a local pullback.
If we analyze the first major wave from August 2018 to August 2020 and project Fibonacci extensions, one of the key levels comes in near 5,000 , which can be considered the primary target.
Another important level to watch is around 5,200 .
In commodities, the fifth wave is often extended, especially when the move turns into a mania phase.
The upside potential from current levels is estimated at 3-11 %.
Conclusion:
Trend remains upward
Key levels:
4,834
5,024
5,200
After the rally completes, a deep correction is expected.
---
Please subscribe and leave a comment!
You’ll get new information faster than anyone else.
---

LTC/USDT 30M Short-Term📊 1) Market Structure (Price Action)
The market is consolidating/accumulating between ~67.2 and ~70.1.
Previously, there was a strong decline, then range trading with false breakouts.
Currently, the price has rebounded from the ~66 low and is making a higher low → short-term bullish.
👉 This looks like a retest of the range bottom → a push to the middle of the range.
🧱 2) Key Levels (Your lines are well marked)
🔴 Support Levels
67.20 – the most important local support (range low).
64.89 – a strong swing low (if 67 breaks → decline here).
63.14 – the bulls' last defense.
🟢 Resistance
69.37 – mid-range, local S/R flip.
70.11 – key range high.
71.60 – strong HTF resistance (if it breaks 70 → target).
📈 3) Trend (moving average)
The green MA (probably the 200 EMA/SMA) has been acting as dynamic resistance previously, and now the price is starting to hold above it → bullish short-term.
Structure:
low → higher low → test resistance = breakout potential.
⚡ 4) RSI + Stoch RSI
RSI (lower panel)
RSI ~55–60 → bullish momentum (above 50).
No overbought → room for further upward movement.
Stoch RSI (middle panel)
Oscillates, but not to an extreme → no dump signal.
If it crosses upwards >80 → a scalp short signal (at 30m).
🧠 5) Scenarios (most important)
🟢 BULLISH SCENARIO
Condition:
Close of the 30m candle above 69.40
Targets:
70.11
71.60
73+ (if a breakout range on HTF)
👉 This will be a consolidation breakout → an impulsive move.
🔴 BEARISH SCENARIO
Condition:
Rejection of 69.4 + return to below 67.9
Targets:
67.20
64.89
63.14
👉 This will be a classic range fake breakout → dump to the lower zone.
🧨 6) What do I see as smart money?
A liquidity grab above 69.5–70 is very likely, followed by a dump.
Market makers like to:
break resistance
collect longs
dump to range low
💰 7) Trading setup (pro)
📌 LONG scalp
Entry: 69.4 breakout retest
SL: 68.8
TP1: 70.1
TP2: 71.6
📌 SHORT swing (better R:R)
Entry: 70–71 rejection
SL: 71.8
TP1: 67.2
TP2: 64.9

#EURUSD Roadmap if the Plaza Accord Scenario is ConfirmedFed and NY Fed Actions on USD/JPY: Last week, reports emerged that the Federal Reserve Bank of New York conducted so-called "rate checks" on USD/JPY — technical consultations that often precede currency intervention. This was indeed interpreted by the market as a signal of readiness to support the yen, although no direct interventions have occurred yet — only the possibility of them.
Important: Despite the absence of direct interventions, the market reacted to the rumors: the dollar weakened against the yen, and the dollar index pulled back, as investors remember the power of coordinated actions similar to the Plaza Accord.
The news is generally credible, however, it's important to note that we're currently only discussing the possibility of intervention and talks about a new version of the Plaza Accord — not an actual agreement or joint operations. Real economic consequences will depend on whether practical actions follow the statements and "rate checks."
If the news is confirmed. Here's my new roadmap for the pair:
Weekly chart analysis. Identifying key historical levels.
Daily chart analysis. Determining impulse movement targets and projected correction levels.
Summary:
We've broken out of the accumulation zone on impulse from the news.
Nearest target: 1.22
Next target: 1.24 (possible sideways movement, partial profit-taking, position accumulation)
If intervention news is confirmed:
New target: 1.28
Correction (likely): 1.24
Final target: 1.30
Reversal.
And here's where it gets interesting.
Weak #USD = Strong #BTC

Gold is poised to break through $5000.
US Dollar Index:
This week closed with a significant decline, and further lows are expected next week. Initial support is around 96.6, with strong support at the previous low of 95.8. The daily chart shows a large bearish candle on Friday; Monday's focus is on the 97.7-96.6 trading range.
Gold:
The weekly chart shows a large bullish candle, with a weekly gain of over $360, continuing its strong trend. Upward momentum is expected on Monday, with a focus on buying on dips. However, caution is advised regarding resistance near the $5000 level; chasing the price higher should be done with caution. The key resistance level is around 5050. If it fails to break through, a small short position can be attempted. If it holds above this level, it is expected to continue rising by more than $50, targeting the 5100-5200 or even 5300 area. The first support level to watch is 4900, with strong support at 4808. Both are good references for going long.
The daily chart shows an overall upward trend on Friday, breaking through and reaching a new high of 4990, ultimately closing with a long lower shadow bullish candle. The daily support level has moved up to around 4936, while the hourly support level is at the pullback low of 4958. This level can be used as the intraday dividing line between bullish and bearish trends; a move to this level could indicate a buying opportunity. a touch of this level could present a buying opportunity. If the market performs strongly, it is expected to trade above 4970-4980, with a target of breaking through 5000 and testing the 5020-5050 area. Gold prices will only see a deep correction if they break below 4900; otherwise, they will continue their strong upward trend.
Trading Strategy:
On Monday, consider placing long orders around 4945-4955, with a stop-loss at 4935. If the trend is strong, consider going long in the 4970-4980 area, targeting a break above the 5000 level. A small short position can be considered near 5050.
Thanks to the TradingView community. As a senior investment analyst, this allows more traders and investors to see my trading strategy analysis.Currently focusing on gold trading. If you like my analysis, please give me a thumbs up and share it with more traders who might need it. We strive for precise trading, deeply researching charts, macroeconomic drivers, and market sentiment to build high-probability trading strategies. Here, you will find structured trading plans, risk management frameworks, and real-time analysis.

ADA A spot trading opportunity only.
The sequence shown is of type IK.
I = impulse
K = corrective
If the sequence is activated, the targets shown in area C above will reach the end of the wave at a price of 0.6697.

BTC: The Optimal Buying OpportunityAfter stabilizing from its decline, the market is gradually warming up, and an upward trend has begun to form. Currently, BTC is trading below 90K, presenting the perfect buying opportunity. There is no need to speculate on exactly when the rally will start, as that is beyond our control. What we can do is buy at the right moment and patiently wait for the market to hit our target.
BTC Trading Strategy for Today:
BTCUSD buy@87K-88K
tp:90K-92K
I will provide accurate signals every day for a month. All signals will be accurate, so don't miss them. If the market changes, I will provide further updates.

GBPJPY : Growth & Bullish Forecast
Balance of buyers and sellers on the GBPJPY pair, that is best felt when all the timeframes are analyzed properly is shifting in favor of the buyers, therefore is it only natural that we go long on the pair.
Disclosure: I am part of Trade Nation's Influencer program and receive a monthly fee for using their TradingView charts in my analysis.
❤️ Please, support our work with like & comment! ❤️

EURUSD: Free Trading Signal
EURUSD
- Classic bearish setup
- Our team expects bearish continuation
SUGGESTED TRADE:
Swing Trade
Short EURUSD
Entry Point - 1.1877
Stop Loss - 1.1900
Take Profit - 1.1831
Our Risk - 1%
Start protection of your profits from lower levels
Disclosure: I am part of Trade Nation's Influencer program and receive a monthly fee for using their TradingView charts in my analysis.
❤️ Please, support our work with like & comment! ❤️

After a surge and subsequent pullback, will it surge again?As the war situation continues to escalate, buying gold has become the only option. In my previous post, I consistently told everyone that we only need to keep buying and holding firmly to reap huge profits. That's exactly what I've been doing.
The US sanctions against Iran, coupled with the market's near 80% probability of an easing US government shutdown at the end of January, and the strong buying interest around 4900 indicating solid support, are limiting the potential for a significant price pullback.
In my opinion, a pullback to a maximum of 5040 would be the best entry point.

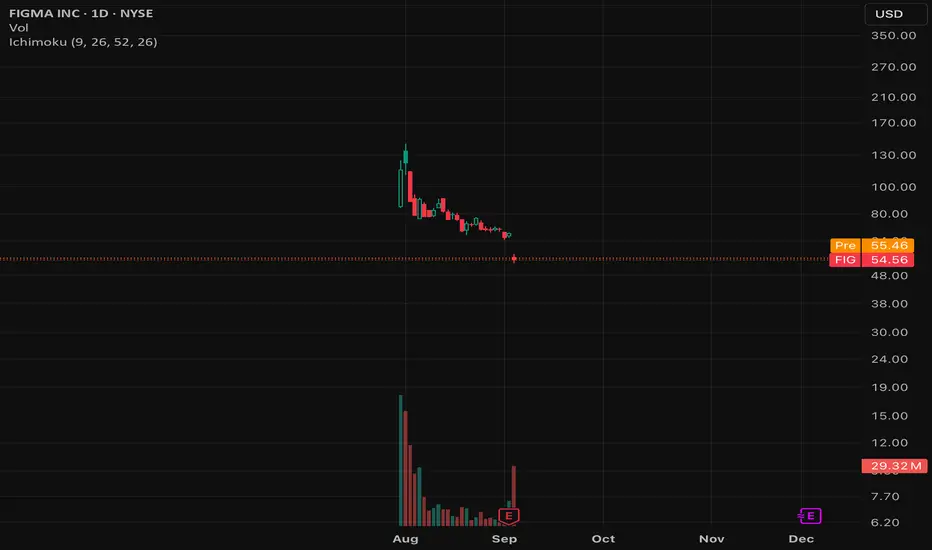
Is it Asana 2.0?- Similar to NYSE:ASAN , NYSE:FIG has a good product, customer friendly, good UI/UX, easy to use.
- Valuation is out whack because IPO frenzy
- Things I like is their growth which 40%+ yoy but my concern is that the technical addressable market isn't huge for design space in general.
- Their are three broad archetype of users:
1. Who doesn't know design at all (majority) : these people use Canva or AI tool for quick designs and ideally these people want free tool.
2. Freelancers to Early professionals: This is the figma's core base where low learning curve help these customers to get started early and prototype faster.
3. Mid career professionals: These folks are open to using new tools if it makes their life easier.
4. Hardcore professionals with years of experience : This segment want heavy editing capability and are mostly NASDAQ:ADBE hardcore users. They know ins and out of NASDAQ:ADBE suite. They might not easily switch to NYSE:FIG because NYSE:FIG feature capability isn't extensive enough what a full blown NASDAQ:ADBE product offers.
NYSE:FIG has strong foothold in type 1-3 is going after type 4. But my concern is even if I combine all the types market isn't large enough as the majority ( say noobs ) will always prefer a free tool and ideally some sort of AI generated edits
EURUSD - Short -1.1803EURUSD has hit the upper channel , now expecteed to fall towards the lower levels before the next long move or reversal.
The pair expected to hit the levels of 1.1803.

EURCAD The Target Is DOWN! SELL!
My dear subscribers,
My technical analysis for EURCAD is below:
The price is coiling around a solid key level - 1.6283
Bias - Bearish
Technical Indicators: Pivot Points Low anticipates a potential price reversal.
Super trend shows a clear sell, giving a perfect indicators' convergence.
Goal - 1.6245
My Stop Loss - 1.6312
About Used Indicators:
By the very nature of the supertrend indicator, it offers firm support and resistance levels for traders to enter and exit trades. Additionally, it also provides signals for setting stop losses
Disclosure: I am part of Trade Nation's Influencer program and receive a monthly fee for using their TradingView charts in my analysis.
———————————
WISH YOU ALL LUCK

ETH - The Last Standing Low!ETH is now sitting right around the lower bound of its range, and this isn’t just any support.
This level marks the last standing low from the weekly timeframe, a zone that has already proven it matters.
As long as this weekly low holds, ETH still has a real chance to rotate higher and work its way back toward the upper bound of the range. This is where strong markets usually make a decision:
either defend structure… or break it.
For now, I’m not guessing bottoms. I’m simply respecting the level.
Hold this zone, and upside scenarios stay valid. Lose it, and the picture changes entirely.
⚠️ Disclaimer: This is not financial advice. Always do your own research and manage risk properly.
📚 Stick to your trading plan regarding entries, risk, and management.
Good luck! 🍀
All Strategies Are Good; If Managed Properly!
~Richard Nasr

Nat Gas: At The Moon - $6.. Now Next Stop $7?! NYMEX:NG1! NYMEX:NGG2026 Well it's been 4 days since my last post,
In my previous post I put forward a target of $6 for the prompt month NG contract . Now that we've blown through that target with a strong weekend open, the next question is where do we go from these historic Winter 2026 highs?? Many NG bears, would argue everything is already priced in, and there's no more gas left in the tank. However, if you look back a year from now, you'll realize we're finally at the bullish levels that were the BASE CASE for what we thought the supply & demand picture would like for 2026. This means we are finally at the expected value that markets had anticipated, 12 months ago, not that we are OVERVALUED.
Now BEARS are supposed be hibernating during the winter, but for some the recent historic rally has caused them to come out of hibernation. Well... there's a reason bears try to sleep through the winter.... it's because you don't chase penny's... when there's dollars to be made!! Right now you should only be taking tactical & quick shorts. This rally still has room to run, and you don't want to step in front of this Bull Train!!
From my charts & fundamental insights, I believe our next target for a session close will be $6.55 then $6.99, and that the February 2026 contract will expire above $6.
Looking at the charts for the front month, you can clearly see an upward directional channel that's now been established. The 30 minute ichi cloud has been providing upward support for NG. The 30min ichi wave targets are lower than the 1hour ichi cloud, and at first if you're looking at the lower time frame, it might seem that the near term movement is to the downside, below the lower upward channel support line & the next wave targets take us lower.
Howeverrrrrrr, if you look at the 1hour ichi, you can clearly see a support cloud above the upward channels bottom support. The next wave targets on the hourly seem to imply, that we can reach $6.55 to $6.65, and if those targets are smashed through next resistance is at $6.99 at the top of the upward channel.
The one hope for Bears, that may lead to consolidation & accumulation at or below the $6 level, before another move higher past $6.30 : "..analysts said potential reductions in LNG exports and pipeline deliveries to Mexico could help offset some of the tightening.
“Another potential wrinkle is how much LNG exports may decline as a result of Fern,” said Pat Rau, NGI’s senior vice president of research and analysis. “Back during Winter Storm Uri, LNG exports fell as well. That meant the overall supply/demand picture wasn’t just lost supply, there was some curtailed demand to help balance things a bit.””-NGI
Now, taking the above quote into consideration... I know you must be skeptical of a continuation of this breakout, but please refer to my previous post of why this rally had legs to begin with to take out the $6 level. But to reach the $7 level, I'll provide a few more quotes below, of why this historic Winter Freeze will keep the bull train going strong down the tracks.
A few fundamental insights on why the cold weather in the U.S. has been an ignition switch for NG prices for the weekend open, quotes provided from industry news source Natural Gas Intelligence:
“I think this storm has all the elements to make it a major risk on the level of Elliott and Uri,” said NGI’s Dan Spangler, senior director of analytics. “There’s going to be widespread cold in nearly all major producing areas, so there will definitely be a freeze-off impact.”
"Wood Mackenzie said Friday that average U.S. natural gas production month-to-date is down to 109.2 Bcf/d, “reflecting the impact of supply-related outages.” The consultancy’s freeze-off projections for the final two weeks of January jumped 9.5 Bcf on Thursday to 138.8 Bcf. That would be an all-time high if realized, breaking the 118.7 Bcf record set in February 2021 when Uri hit.”
"When Uri struck in mid-February 2021, LNG feed gas flows slowed to a trickle. Deliveries fell 87% to 1.3 Bcf/d from above 10 Bcf/d at the start of the month, Wood Mackenzie data show."
“Prices still took off back then, of course,” Rau said, “but the impact may have been even worse if LNG hadn’t served as a demand destruction vehicle to help counter some of the lost production.”
"Even so, Fern may not stress the Texas power grid to the same degree as Uri, according to RBN Energy LLC analyst John Abeln.
The expected zone of extreme cold during Fern “does not extend as far south across Texas” as it did during Uri, Abeln said, and the storm is forecast to move through the state much more quickly. Temperatures in Dallas are expected to rise above freezing by Tuesday, compared with a much longer stretch below freezing during Uri.
“The sustained deep freeze that exhausted storage and led to equipment failures is likely to be much less severe this time around,” Abeln said.
If deep snow materializes, frigid temperatures linger and production freeze-offs mount, February natural gas “could rally to the $7.500 area” in a highly bullish scenario, Yawger added.
Exceptional storage withdrawals are in the cards as well, with most analysts now looking for a pull far north of 300 Bcf for the last week of the month.
“The chatter around the natural gas space is a storage draw of over 350 Bcf or greater,” Yawger said. “There have only ever been four draws of 300 Bcf or greater in the history” of federal storage data.

S&P500 - Be vigilant with longs and know when to stop!S&P500 - Despite price making a new high, I'm not yet convinced we're out of the wood and I'm prepared for any type of price action.
But as the saying goes, Be fearful when others are greedy, and greedy when others are fearful . (by Warren Buffett).
That said, don't be ignorant to the risk and be ready to abandon ship if the signs say so!
What bothers me is that we haven't yet seen any good correction despite the pending civil war in the US and the general gloomy view around the world. We only got a 5% correction and it last 20 to 40days depending on your own view.
So, we're at risk of seeing a deeper retracement (~10% to 20%) that can take quite a few weeks if not months to resolve, thus I do not wish to have my capital lock in that case.
As I stated on my previous post, my watchlists are showing signs of improvement thus I'm ready to try some longs but I have those 3 scenarios in my mind in case we see a shift in power in favor of bears.
TLDR; To make it simple, it's okay to play the long side as long as price, those coming days, does not close below the 10EMA and 20EMA (respectively pink and blue on my charts).

Oracle shows a double bottom with December and a micro doubleBought NYSE:ORCL at the open today.
Oracle shows a double bottom with December and a micro double bottom with Wednesday, adding some upside probability. Context matters most, the $345 → $171 move is a ~50% correction, and 40–60% retraces are typically the highest-probability zones.
Invalided below $170. Target $240 zone, so excellent risk reward here.

Tyson Foods — Breaking the Upper ChannelTyson has broken out of a shorter rising channel and is now testing the upper boundary of a longer down-sloping range visible on the daily chart. The move looks strong technically, but that longer resistance line still matters for the near term. The RSI is overbought, signalling this leg may need a breather before real continuation.
On the fundamentals, the protein giant is navigating a mixed backdrop. Analysts expect modest revenue growth this year with annual sales projected up ~2–4 %, helped by resilient chicken demand even as beef remains challenged due to tight cattle supplies and higher input costs. Management has flagged chicken as a key earnings driver while beef margins remain under pressure. There’s focus on operational efficiency, value-added products and expanded prepared foods alongside steady demand in core proteins. 
With earnings near, watch how guidance around segment performance influences the breakout’s follow-through and whether the longer resistance line holds as a cap.

Southwest Airlines | Descending Within a Falling ChannelSouthwest shares are currently sliding inside a defined down channel as we head into the next earnings print. Price is testing lower levels and the next structural support sits around the $41 area, which has held previously. The RSI remains soft, suggesting limited upside momentum for now.
Macro/context: Southwest is in a transition phase on its revenue mix. After decades of its “bags fly free” model, the airline has shifted to assigned seating with premium and extra-legroom options, alongside newly introduced checked baggage fees as part of a broader effort to lift revenue per passenger. Management has outlined that these ancillary streams (paid seat choice, bag fees, new fare bundles) are expected to contribute materially to earnings and help boost margins as the business evolves. 
With earnings near, watch how guidance around these new revenue initiatives influences the reaction off support at ~$41 and whether the falling channel continues to cap strength.

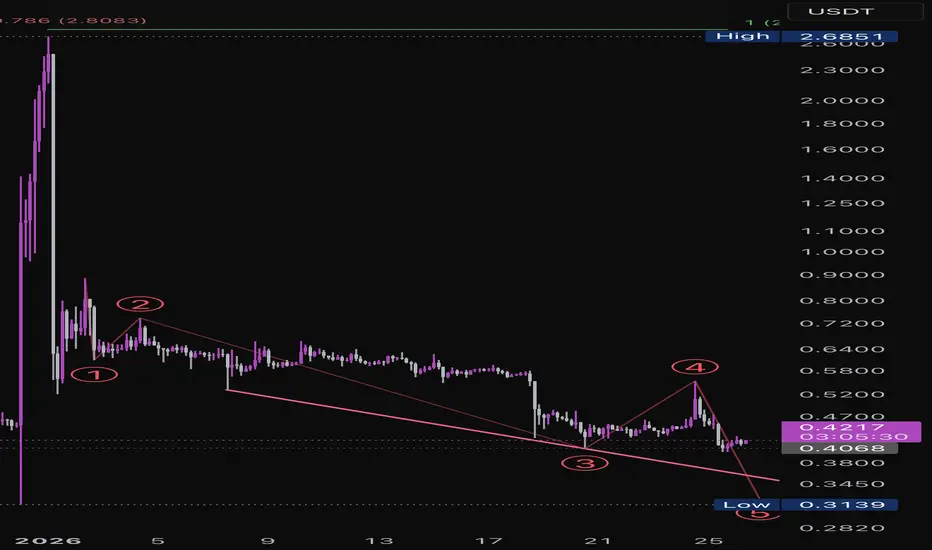
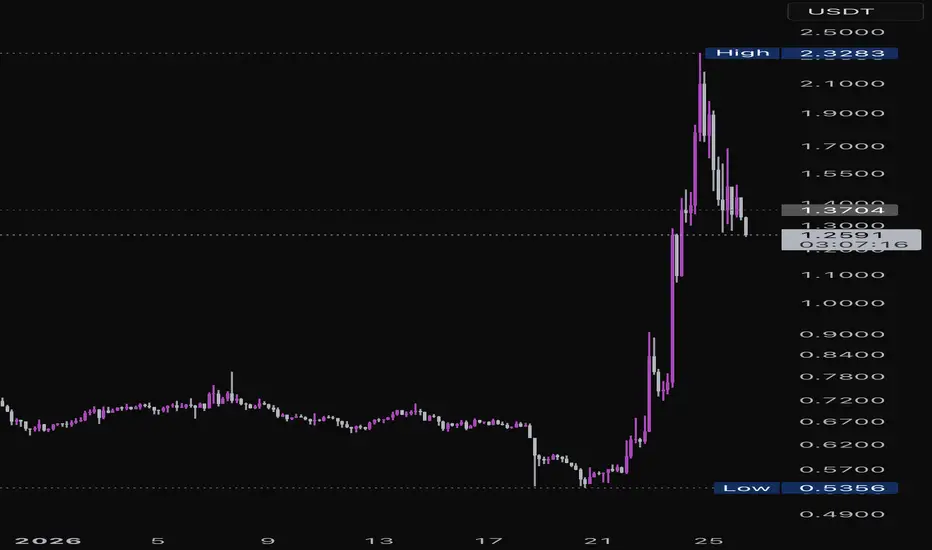
Explosive Rally Incoming… AgainOne of the most speculative and volatile assets l've encountered yet. The entire structure is messy and corrective, but the last low has still held so far and I count the past few days of consolidation as an ending diagonal in Elliot subwave b of larger B. If it plays out, I'm looking for one more low to the 0.35 area before price takes off in subwave c of B.
Target TP Range: 2.7-4.2 (will need to adjust if we get another low)
Be careful trading this asset. Subwave c of B would be followed by a very sharp drop to new lows. NFA.
EU shorts Looking to short from an area which has already been respected previously. Expect market to come back and retest the area and look to recover NY open movement.

Explosive Rally Incoming… AgainOne of the most speculative and volatile assets I’ve encountered yet. The entire structure is messy and corrective, but the last low has still held so far and I count the past few days of consolidation as an ending diagonal in Elliot subwave b of larger B. If it plays out, I’m looking for one more low to the 0.35 area before price takes off in subwave c of B.
Target TP Range: 2.7-4.2 (will need to adjust if we get another low)
Be careful trading this asset. Subwave c of B would be followed by a very sharp drop to new lows. NFA.
US$/YEN I am posting this for good reason LOW IN PLACE The timing and price projections at the High and the low based on wave structure and fib relationships to the TICK !!! have a nice day WAVETIMER
