XAUUSD – Weekly Analysis & Trade ScenarioPrice is currently trading above a weekly Fair Value Gap (FVG) that aligns with the previous weekly low, forming a strong demand zone.
As long as price stays above this zone, the market structure remains bullish.
Best Scenario:
I’m looking for a retest of the weekly FVG to confirm demand. If price taps back into this imbalance and shows rejection, that would be the ideal long entry.
Trade Idea:
Entry: Inside the weekly FVG
Bias: Buy from demand
Target: Sweep the Weekly High above (major liquidity pool)
Invalidation: A clean break below the weekly FVG
This setup anticipates a retracement ↓ into demand, followed by a continuation ↑ to take liquidity.
Wave Analysis

Multi-Cycle Alignment Points to Sharp DownturnThe chart presents a sophisticated multi-cycle composite model overlaid on the prevailing Natural Gas trend. Notably, all four cycles will converge during the January–February 2026 window, creating a concentrated alignment that signals the likely emergence of the second major peak.
When multiple cycles reach their highs in unison, this synchronicity often delineates a critical market turning point—especially here, where prices are confronting significant resistance and aligning with the prior peak from September 2021. This formation suggests a heightened probability of a strong downward phase, potentially initiating a broader structural market correction.

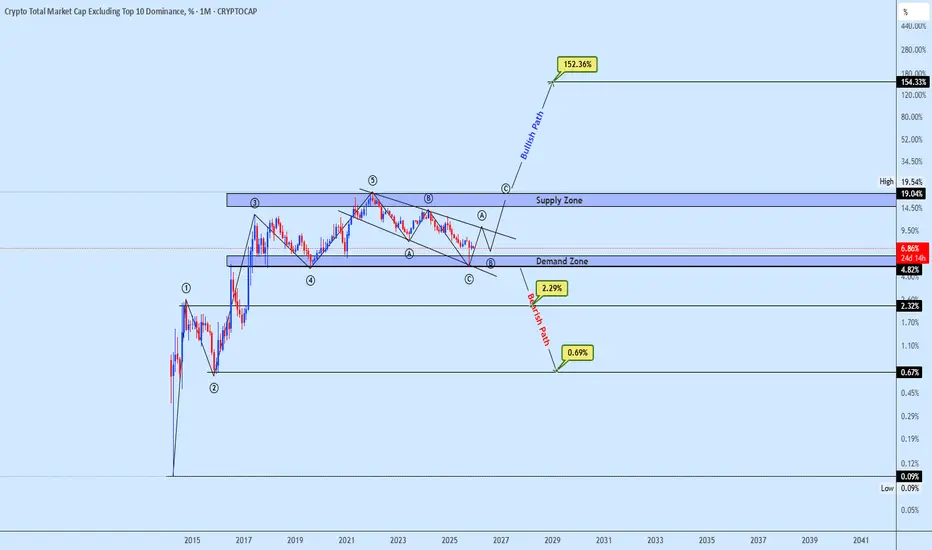
Critical Inflection Point for Altcoin DominanceThe crypto dominance excluding the top 10 assets price is sitting directly on a long-term demand zone that has generated strong reversals in previous cycles. After completing a 5-wave advance and forming a complex ABC correction, the market is now testing this structure once again.
A rebound here would support a bullish path back into the supply zone, and a breakout above it could open an extended expansion, with long-term projections pointing toward 152% dominance. This would imply strong capital rotation into mid-cap and smaller altcoins over the coming cycles.
If the demand zone fails, the bearish path becomes active. Breakdowns below this level expose deeper targets around 2.29% and potentially 0.69%, signaling broad weakness and a prolonged risk-off environment for altcoins.
Monthly behavior at this level is decisive. The demand zone remains the key line to watch for the next major trend.
DOGEUSDT → Lack of bullish potential BINANCE:DOGEUSDT.P failed to break the trend. Under pressure from resistance and a global downtrend, the coin is reversing and may decline...
Bitcoin is pausing after a news rally based on rumors. The trend remains bearish. Pressure on the crypto market is present...
DOGE faced pressure in the 0.1477 - 0.155 zone. A rebound from 0.1533 is forming and the price is closing below 0.1477, forming a pre-breakout base of 0.1464. The reaction to support is weakening, confirming the weakness of the buyer. A close below 0.1464 could trigger a further decline within the range.
Resistance levels: 0.1477, 0.15337
Support levels: 0.1464, 0.1366
A breakdown of support, closing below the level, and consolidation in the short zone will once again confirm buyer weakness, which in turn may trigger a further decline.
Best regards, R. Linda!

#DOGS/USDT is currently strongly bullish#DOGS
The price is moving in a descending channel on the 1-hour timeframe. It has reached the lower boundary and is heading towards a breakout, with a retest of the upper boundary expected.
We are seeing a bearish bias in the Relative Strength Index (RSI), which has reached near the lower boundary, and an upward bounce is expected.
There is a key support zone in green at 0.0000444. The price has bounced from this level several times and is expected to bounce again.
We are seeing a trend towards stabilizing above the 100-period moving average, which we are approaching, supporting the upward trend.
Entry Price: 0.0000460
First Target: 0.0000483
Second Target: 0.0000515
Third Target: 0.0000553
Remember a simple principle: Money Management.
Place your stop-loss order below the green support zone.
For any questions, please leave a comment.
Thank you.

DXY update 95-96 STRONG SUPPORT ? From the data that has been compiled, we can see that there is a reaction at the 95 support area.
Is this a strong support area for a bullish reversal ?
We'll see what happens next...we need more times to watch it movements as DXY still consolidation.
Have a Blessing week ahead !

BTC SHORTBTCUSDT – Short Position Still Valid
Price continues to respect the bearish structure after the reversal.
We rejected the mitigation zone and stayed below the Alligator EMAs, confirming continuation.
• Short remains active
• Invalidation: Any 2H close above 89,632 – 89,892
• Structure: Lower highs + compression under resistance
• Expectation: Continuation lower after wedge breakdown
Targets:
1. 88,900
2. 87,700
3. 82,160 (main objective)
Still watching for a possible stop-hunt into the red zone, but bias remains bearish unless invalidated.


US30 Will Move Lower! Sell!
Here is our detailed technical review for US30.
Time Frame: 9h
Current Trend: Bearish
Sentiment: Overbought (based on 7-period RSI)
Forecast: Bearish
The market is trading around a solid horizontal structure 47,967.2.
The above observations make me that the market will inevitably achieve 46,950.2 level.
P.S
We determine oversold/overbought condition with RSI indicator.
When it drops below 30 - the market is considered to be oversold.
When it bounces above 70 - the market is considered to be overbought.
Like and subscribe and comment my ideas if you enjoy them!

NZDUSD Is Bearish! Short!
Take a look at our analysis for NZDUSD.
Time Frame: 7h
Current Trend: Bearish
Sentiment: Overbought (based on 7-period RSI)
Forecast: Bearish
The market is testing a major horizontal structure 0.577.
Taking into consideration the structure & trend analysis, I believe that the market will reach 0.569 level soon.
P.S
Overbought describes a period of time where there has been a significant and consistent upward move in price over a period of time without much pullback.
Like and subscribe and comment my ideas if you enjoy them!

SPY SELLERS WILL DOMINATE THE MARKET|SHORT
SPY SIGNAL
Trade Direction: short
Entry Level: 685.68
Target Level: 671.00
Stop Loss: 695.40
RISK PROFILE
Risk level: medium
Suggested risk: 1%
Timeframe: 9h
Disclosure: I am part of Trade Nation's Influencer program and receive a monthly fee for using their TradingView charts in my analysis.
✅LIKE AND COMMENT MY IDEAS✅

GBP/USD BEARISH BIAS RIGHT NOW| SHORT
Hello, Friends!
GBP/USD is making a bullish rebound on the 8H TF and is nearing the resistance line above while we are generally bearish biased on the pair due to our previous 1W candle analysis, thus making a trend-following short a good option for us with the target being the 1.323 level.
Disclosure: I am part of Trade Nation's Influencer program and receive a monthly fee for using their TradingView charts in my analysis.
✅LIKE AND COMMENT MY IDEAS✅

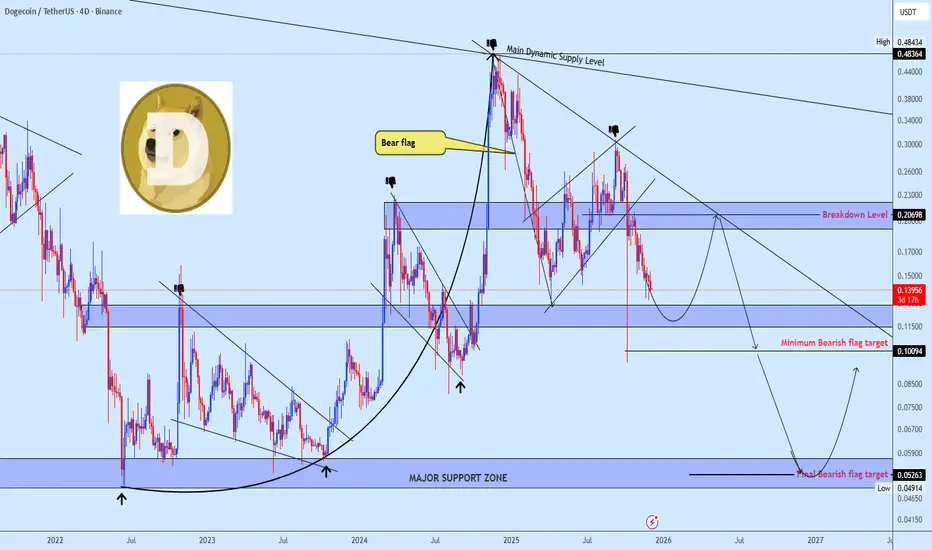
Relief Rally Expected Before Next Leg Down on DOGEUSDTDOGEUSDT has initiated a clean corrective structure following the creation of a bearish flag. The breakdown from the flag triggered a strong downward leg, confirming the shift in momentum and validating the continuation pattern. At the moment, the market is trading below the breakout zone, and further price development is expected to unfold through a relief rally.
The immediate plan is to monitor a pullback toward the minimum bearish flag targets around the $0.12 region, which aligns with the former structure support and breakout zone. This area is likely to serve as supply on the retest, where rejection is anticipated to resume the broader corrective move.
The final downside target has been mapped on the chart, and the price action will remain bearish as long as market structure continues to respect the breakdown level.
The F1 Mindset Every Trader Needs!!!Most traders behave like they’re trying to win the race on the first lap.
Full throttle. No patience. And then they wonder why they spin out before the finish line.
🏎 But in Formula 1, especially under the lights of Abu Dhabi, the winners don’t drive the fastest…
They manage the race the smartest.
And trading is no different.
Here are the three F1 lessons every trader should master:
1️⃣You Don’t Win by Being Fast => You Win by Being Controlled
F1 drivers don’t go maximum speed all the time.
They manage tyres, fuel, engine temperature, and track conditions.
In trading, your “tyres” are your capital.
Burn them early with emotional trades, and your race is over.
Consistency beats speed.
Control beats excitement.
2️⃣ Your Strategy Is Your Pit Crew
No F1 driver wins alone, they rely on a team that’s fast, disciplined, and precise.
For traders, your “pit crew” is your:
- trading plan
- risk management
- journaling
- strategy rules
- routines
When your system is aligned, your performance becomes predictable.
When it's sloppy, you get undercut by the market every time.
3️⃣ The Race Is Won on Corners, Not Straights
Every driver can accelerate on the straights.
Champions gain their advantage in the corners — the difficult, technical parts of the track.
In trading, the “corners” are:
- drawdowns
- losing streaks
- choppy markets
- hesitation
- volatility spikes
Anyone can trade a trending market.
True professionals shine in difficult conditions.
🏁 Final Lap Insight
The Abu Dhabi Grand Prix doesn’t reward the loudest driver, it rewards the most disciplined.
Trading is exactly the same.
✔ The market is your circuit.
✔ Your account is your car.
✔ Your rules are your race line.
✔ And your mindset determines whether you finish… or crash out on turn one.
Trade like an F1 driver:
calm, calculated, consistent, and always thinking about the full race, not a single lap.
⚠️ Disclaimer: This is not financial advice. Always do your own research and manage risk properly.
📚 Stick to your trading plan regarding entries, risk, and management.
Good luck! 🍀
All Strategies Are Good; If Managed Properly!
~Richard Nasr

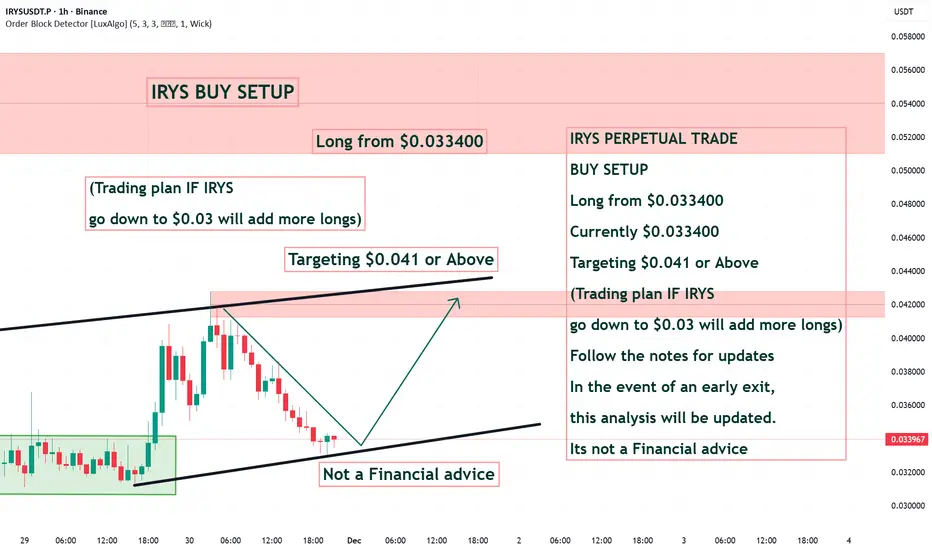
IRYS PERPETUAL TRADE BUY SETUP Long from $0.033400IRYS PERPETUAL TRADE
BUY SETUP
Long from $0.033400
Currently $0.033400
Targeting $0.041 or Above
(Trading plan IF IRYS
go down to $0.03 will add more longs)
Follow the notes for updates
In the event of an early exit,
this analysis will be updated.
Its not a Financial advice
USDJPY – Bearish Structure Continuation Setup (1H)FX:USDJPY
As long as price remains below the upper bearish trendline, rallies are likely corrective, not continuation. Market zone at 157.144 remains the failed breakout range, indicating distribution rather than accumulation. If rejection forms near the intraday supply zone, the next impulsive wave downward becomes more probable.
Key Scenarios
🔴 Bearish Case (Primary Bias)
From 155.50 → 155.00 zone rejection
🎯 Target 1 → 154.400
🎯 Target 2 → 153.600
🎯 Swing Target → 152.819 major demand
Trend invalidation only if price breaks and sustains above 157.144.
🔵 Bullish Case (Low-probability)
Break & hold above 157.144 →
Upside continuation to 157.857, liquidity test region.
🟢 Current Levels to Watch
Resistance: 157.144 / 157.857
Intraday Rejection Zone: 155.200–155.500
Support / Final Target: 152.819
⚠️ Educational analysis — not financial advice.

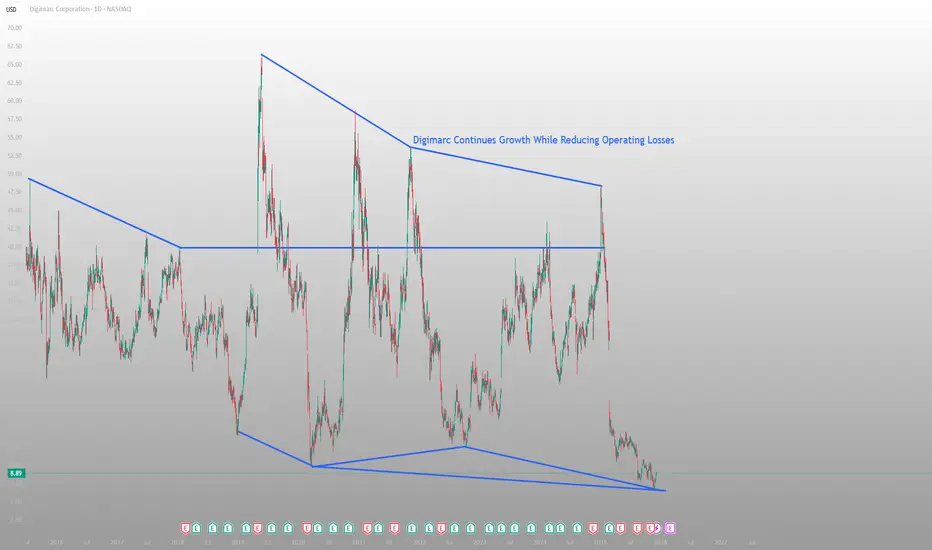
Digimarc Continues Growth While Reducing Operating LossesDigimarc Continues Growth While Reducing Operating Losses.
ACRES Commercial Realty: Buybacks And A 25% Discount To Book ACRES Commercial Realty signals $30 book value target as asset sales progress, eyes dividend resumption.
Most excellent Quarter.
ACR-C one of the best preferred issues with a rate floor. New mgmt since Covid has revived ACRES Commercial Realty Corp."

Gold is going crazy www.tradingview.com
OANDA:XAUUSD
Gold has returned to its strong upward trend which is considered as a support for the character .
the price should not break 4185 otherwise it is heading to its strong demand area 4150-4164 .
I see taking any trade now is kinda risky until the chart make a move .
but I think it will correct upward because it has made a fair value cap after break of structure .
short term Support areas : 4192-4176
long term support areas : 4165-4150
short term resistance area : 4250-4265
long term resistance areas : 4334-4382

GBPUSD - small correctionIn the short term, we’re in a correction. After that, the outlook points to growth.
How high we rise and what kind of wave it will be depends on the depth of the correction.
The chart is quite technical and shows a clear picture.
Ideally, we shouldn’t drop below 1.321 .
Time will show the final result.
---
Please subscribe and leave a comment.
You’ll get new information faster than anyone else.
Together, we’ll grow and become wealthier.
---

US10Y - move downAt the end of October 2023, we finished the upward move and entered a correction phase.
The higher-level corrections are coming to an end, and in the medium term a deeper move downward is expected.
For a short period, we may still see some upside (or fluctuations) within the correction, but compared to the main move, it will be insignificant.
The reference level is around 2,770 .
---
Please subscribe and leave a comment.
You’ll get new information faster than anyone else.
Together, we’ll grow and become wealthier.
---

ETHUSD 4H Elliott Wave analysisJust a few more weeks of patience until the next big wave begins.
Follow us and stay updated.

