CHFJPY My Opinion! BUY!
My dear subscribers,
CHFJPY looks like it will make a good move, and here are the details:
The market is trading on 199.14 pivot level.
Bias - Bullish
My Stop Loss - 198.81
Technical Indicators: Both Super Trend & Pivot HL indicate a highly probable Bullish continuation.
Target - 199.73
About Used Indicators:
The average true range (ATR) plays an important role in 'Supertrend' as the indicator uses ATR to calculate its value. The ATR indicator signals the degree of price volatility.
Disclosure: I am part of Trade Nation's Influencer program and receive a monthly fee for using their TradingView charts in my analysis.
———————————
WISH YOU ALL LUCK
Wave Analysis

USDJPY - Neutral - Long 159.00 - Short 157.00USDJPY has the pivot point at the levels of 158. The pair has e high chance of rejection from the levels of 158 to hit the 159 levels.
However , if the 158 level is broken , then the pair can hit the levels of 157.00

SnP 500 very difficult to forectsThere are so many big and small things involved into the S&P-500 that affect it, so the price movement also indicates that. Especially it becomes difficult when we are trying to forecast the pullbacks. However, the longer the price goes up, the higher the chance for the pullback is, and I think the move down is coming soon, but not very big, the target is around 5600-5700, that is likely to hit it in the next 3-4 months.

GBPUSD | Breakout Watch from the ChannelCable’s tone has improved as UK inflation has stopped falling cleanly. December CPI ticked up to 3.4% y/y (from 3.2%), with services inflation still sticky (CPIH services 4.5% y/y), which can keep the market cautious about pricing aggressive BoE easing.
Technical lens: Price has been compressing inside a downward sloping channel after the prior leg higher, and we’re now pressing the upper channel line around the mid-1.36s. RSI is also pushing into the high-60s, which fits with “pressure building” rather than a clean mean-reversion setup. A sustained push through the channel top would put the next obvious magnet at the 1.41–1.42 supply zone marked on the chart.
Catalysts: The next FOMC meeting is 27–28 January (press conference on the 28th), which is the near-term volatility trigger for USD legs. On the UK side, the latest CPI print firming up keeps the “higher-for-longer vs slower cuts” debate alive into the BoE’s 5 February decision.

BTCUSDT — H4 Wave 3 Formation + Trendline BreakoutBTCUSDT — H4 Wave 3 Formation + Trendline Breakout
🔎 Market Structure (H4)
On the H4 timeframe, price has completed Wave 1, followed by a corrective Wave 2.
The current impulse confirms the formation of Wave 3 after a breakout above the descending trendline.
The move is developing inside a broader corrective environment, therefore this is treated as a local impulsive structure within a higher-timeframe correction.
📐 Higher Timeframe Context
• Higher TF remains corrective
• Wave 3 is forming as an internal impulse
• After target completion, a corrective phase (Wave 4 / ABC) is expected
📈 Primary Scenario — Wave 3 Expansion
Continuation of the upside impulse within Wave 3, followed by a corrective pullback once expansion targets are reached.
🎯 Target Levels (from the chart)
Upside targets (Wave 3):
98,011
95,868
93,849
92,627
Key structural support:
90,575 — reaction / structure-holding level
🛑 Invalidation / Stop
88,439 — low of Wave 2
A breakdown below this level invalidates the Wave 3 scenario.
🧠 Trading Notes
• Avoid chasing price — priority on pullback entries
• Partial profit-taking near targets is recommended
• Increased caution due to higher-timeframe corrective context
📌 Summary
Bitcoin on H4 shows a clear Wave 3 formation after a confirmed trendline breakout.
Targets are defined above, however the broader structure remains corrective — risk control and position management are critical.

BAYER: Wave (X) CompleteBayer shares have continued their bullish momentum since our last update. As shown on the daily chart, we now primarily believe that the low of wave (X) in blue is already in place, and that the next phase will see wave (Y) advancing above all marked resistance lines.
As a result, we have deactivated our blue long-term entry zone. However, in our alternative scenario, the price could fall below this entry area, with the alternative wave alt.(X) in blue ending at a much lower level (probability: 28%).

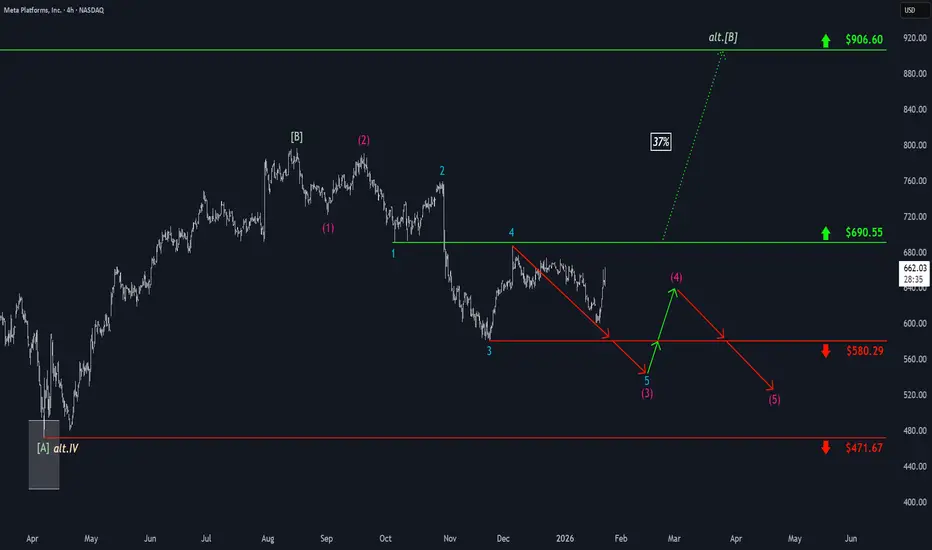
Meta: Counter-Reaction!Meta initially sold off toward the support at $580.29 as planned but recently experienced a counter-reaction as it neared this level. Primarily, we anticipate that the stock will soon turn downward to continue the ongoing bearish impulse. The magenta wave (3) is expected to set its low below the $580.29 level. After a moderate recovery in wave (4), we expect further declines. However, should stronger upward momentum push the stock above the resistance at $690.55, we may have to prepare for a new corrective high of green wave alt. near the $906.60 mark (probability: 37%). Primarily, however, we consider the regular wave as already complete.
BTCUSD RETEST ANALYSIS (READ CAPTION)hi trader's what do you think about btcusd
BTCUSD is currently showing a bullish market structure, with price holding strongly above a key support level. As long as Bitcoin stays above 88,300, buyers remain in control and the upside momentum is expected to continue.
🟢 Support Level: 88,300
This level is acting as a strong bullish support zone, where buyers have previously stepped in.
Holding above this area confirms market strength and increases the probability of further upside movement.
🔴 Supply Zone: 93,000
The 93,000 area represents a major supply and profit-taking zone.
Price may face temporary resistance or consolidation here due to seller activity.
A clean breakout and strong close above this zone would open the door for further bullish continuation.
📈 Market Outlook
Above 88,300 → Bullish bias remains intact
Pullbacks toward support → Potential buy opportunities
Target → 93,000 supply zone
Breakdown below 88,300 → Bullish setup invalidated
Overall, BTCUSD favors a buy-on-dips bullish continuation strategy, unless the key support level fails.
please like comment and follow

XAUUSD BUY TRAPE (READ CAPTION)hi trader's what do you think about gold
Gold (XAUUSD) is currently trading under a bearish structure, as price is facing strong selling pressure near the upper resistance zone. The area between 4980–5000 is acting as a major supply and rejection zone, where sellers are aggressively defending higher prices.
🔻 Resistance Zone: 4980–5000
This zone represents a strong bearish rejection area and an ideal sell-on-retest zone.
As long as Gold remains below 5000, the overall market bias stays bearish.
Any retracement into this zone followed by rejection candles would confirm downside continuation.
🔻 Demand Zone: 4840
This is the primary downside target and demand area.
If selling pressure continues from the resistance zone, price is likely to move toward 4840, where buyers may attempt a temporary reaction or consolidation.
📉 Market Outlook
Below 4980–5000 → Bearish continuation expected
Rejection from resistance → Confirms seller control
Downside target → 4840 demand zone
Break above 5000 → Bearish setup invalidated
Overall, the structure supports a bearish retest → continuation setup, favoring sellers unless price breaks and holds above the major resistance zone.
please don't forget to like comment and follow

XAUUSD 4H – Bullish Channel,Pullback Expected Before ContinuatioXAUUSD (Gold Spot) – 4H Timeframe
Gold is trading within a well-defined ascending channel, respecting both upper resistance and lower support trendlines. Price has recently tested the upper boundary of the channel near 4950, showing signs of short-term exhaustion after a strong bullish impulse.
A pullback toward the mid-to-lower channel region (≈4550–4600) is anticipated before the next directional move. As long as price holds above the lower channel support, the overall trend remains bullish, and dips may present buying opportunities.
Key levels:
Resistance: 4950–5000
Support: 4600 / Channel bottom
Trend bias: Bullish (higher highs & higher lows)

LONGTERM BITCOIN PROJECTIONS (BTCUSD)The peak of W1 at 69400-69500 is a key level to be considered when giving respect to present day Bitcoin movement.
In EW analysis using Bill Williams' count, W4 can retrace to deep 50% but never below the peak of W1. Price breaking below that W1 level invalidates the wave count and opens up possibility for a deeper retrace which would corrrespond to Bitcoin reaching pre-mainstream prices.
The next rally may show up after a similar time period as the ending W3 rally (2years).
W4s often take as much time to unravel as W3 took to play out, only difference being that W4s go nowhere and are effectiovely range bound between the peaks of W3 and W1. 'C' level of the W4 is lowest price is expected to go.
I anticipate price to grind slowly upwards to 'b' then shoot down to 'c' level before the much awaited bull run to beyond W3 peak.


$NVO — another upside breakout today. Still holding the full posNYSE:NVO — another upside breakout today. Still holding the full position, now with a large open profit.
The Danish primary listing of Novo Nordisk, OMXCOP:NOVO_B , is now trading in clear air. The 460 DKK area looks like the most logical swing target, which aligns slightly above my $70 zone on the US listing.

Elise | BTCUSD | 30M – Range Breakdown & Bearish ContinuationBITSTAMP:BTCUSD
After a sharp sell-off, BTC entered a consolidation range. Multiple rejections from the upper resistance zone indicate distribution rather than accumulation. Recent reactions from the mid-range support show weakness, suggesting price may seek lower liquidity before any meaningful recovery.
Key Scenarios
❌ Bearish Case 📉 → Failure to hold current support can trigger continuation toward sell-side liquidity.
🎯 Target 1: 87,800
🎯 Target 2: 87,200
🎯 Target 3: 86,800
✅ Bullish Case 🚀 → A strong break and acceptance above the upper supply zone would invalidate the bearish bias and shift momentum higher.
Current Levels to Watch
Resistance 🔴: 90,000 – 90,400
Support 🟢: 88,200 – 87,100
⚠️ Disclaimer: This analysis is for educational purposes only. It is not financial advice. Please conduct your own research before trading.

Elliott Wave Analysis – XAUUSD | January 23, 2025
Momentum
– Daily (D1) momentum is still in a preparing-to-reverse phase, but there is no confirmed signal yet. Therefore, at this stage, we continue to wait for a daily candle close to confirm the reversal.
– H4 momentum is currently preparing to reverse to the downside, which suggests that on the H4 timeframe we may see a corrective bearish move in the coming sessions.
– H1 momentum is approaching the oversold zone, indicating that in the short term on H1, a corrective bullish move is likely to appear soon.
Wave Structure
Daily (D1) timeframe
– On D1, price remains within the blue wave 5 structure.
– Price has already reached the projected target zone, therefore today we need to closely monitor the possibility of a reversal, especially as D1 momentum is also preparing to turn.
H4 timeframe
– On H4, the orange wave 3 structure is still developing, with an internal five-wave structure in green.
– Currently, price is moving within green wave 5.
– Once green wave 5 is completed, price will complete orange wave 3 and is expected to transition into the corrective phase of orange wave 4.
H1 timeframe
– Within green wave 5, we can observe a five-wave purple structure (1–2–3–4–5), with price currently positioned in purple wave 5.
– Inside purple wave 5, the internal structure is likely forming five black waves (1–2–3–4–5).
– At this point, price may have completed black wave 3 and is preparing to form black wave 4.
– This scenario aligns well with H4 momentum preparing for a bearish reversal, reinforcing the corrective expectation.
Target Zone & Confluence
– The projected target for black wave 4 is currently estimated at the Fibonacci 0.382 retracement of wave 3, around the 4908 area.
– This zone is also my preferred buy area, especially with the confluence of H4 momentum moving toward oversold conditions.
Trading Plan
Buy Zone: 4909 – 4907
Stop Loss: 4889
Take Profit 1: 4929
Take Profit 2: 4957

SPX testing the high range zoneWe're still at the high range zone but they are having trouble holding over it, again. Still looks like a false breakout so far. Monday may be a gap down. Vix is at support. I cover the other markets as well. Good luck!
