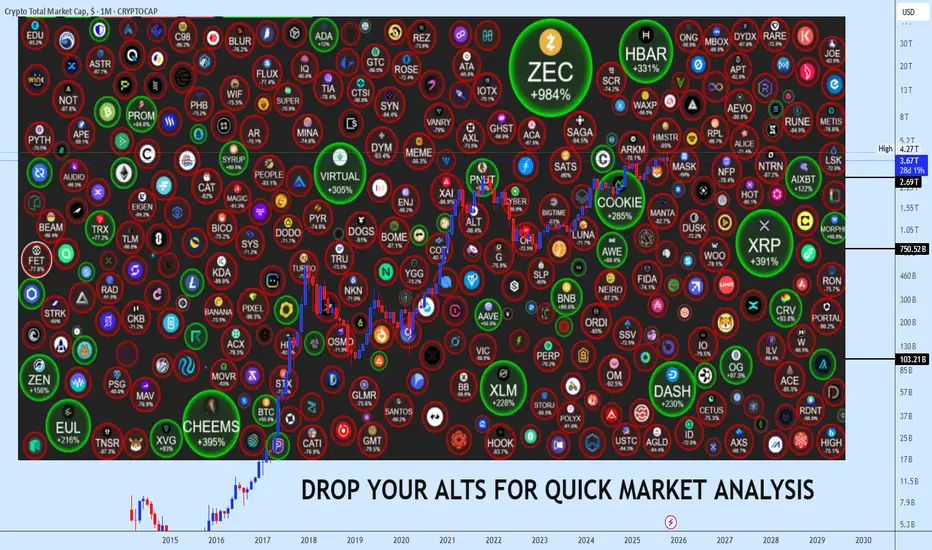
November Alts Request Window Now OpenFamily, November isn’t just another month, it’s decision time. We’re standing at the edge of the 4-year cycle’s final act, where altcoins will either explode into new expansions or vanish in liquidity drains. Every choice from here carries weight this selection window could decide the next cycle’s biggest winners.
📌 Submission Deadline: November 5th, 2025
📌 Target Coins: 30 slots only
📌 Requirements:
1. Must display solid liquidity and a clear technical structure
2. Should reflect sustainable narratives or active ecosystem growth
3. Avoid dead or illiquid tokens only serious and relevant projects
As always, every suggested coin will be carefully screened, but only those that align with both the broader cycle context and our technical framework will be considered for full analysis. The objective remains unchanged to position ourselves where the next rotation wave is most likely to ignite as BTC completes its dominance move and liquidity begins rotating into alts.
Remember: These late-cycle months often decide the real winners heading into the next expansion phase. Let’s keep our list sharp, high quality, and cycle aligned.
Drop your suggestions below November isn’t the month to hesitate.
If this resonates with your outlook for the month ahead, hit the like button, share it with your circle, and let’s build this month’s list together.
Wave Analysis
Bitcoin’s Decentralization Is a Lie - Here’s the ProofYou’ve Been Fooled For Years
The narrative: Bitcoin is "decentralized money," free from banks, governments, and corporate control. A financial revolution for the people.
The reality: Bitcoin is one of the most centralized, surveilled, and manipulated financial systems in existence, and the public has been sold a decade-long con.
Let’s break down why Bitcoin fails as decentralized money and how the system is controlled by a tiny elite, with more surveillance than traditional finance.
1. The Mining Oligarchy: 90% of Bitcoin’s Supply Controlled by a Handful of Players
Bitcoin’s security and transaction processing rely on miners—but this isn’t a distributed network of mom-and-pop operators. A few massive mining pools dominate the entire system:
Just 4 mining pools (Foundry USA, Antpool, F2Pool, and ViaBTC) control over 60% of Bitcoin’s total hash rate (Blockchain.com).
The top 10% of miners control 90%+ of the mining power—meaning a small group of entities can censor transactions, manipulate fees, or even collude to attack the network.
Mining is centralized in a few countries (U.S., China, Kazakhstan), where governments and corporations can shut it down at will (see: China’s 2021 mining ban, which wiped out 50% of the network overnight).
Hardware centralization: Only ASIC manufacturers (like Bitmain) can profitably mine Bitcoin. No average person can compete—this is industrial-scale control, not decentralization.
→ If 4 companies control the network, how is this "decentralized"?
2. The Validator Dictatorship: Bitcoin’s "Trustless" System Runs on Trust in a Few
Bitcoin’s nodes (computers that validate transactions) are supposed to be the backbone of decentralization. But:
Over 50% of Bitcoin nodes run on just 3 hosting providers (Amazon AWS, Hetzner, OVH) (Bitnodes).
Most full nodes are controlled by exchanges, institutions, and mining pools—not regular users.
If you’re not running a full node (and 99% of users aren’t), you’re trusting someone else’s version of the blockchain. That’s not trustless, that’s blind faith in a centralized elite.
→ If you’re not validating transactions yourself, you’re just a user in their system.
3. The Exchange Trap: Your Bitcoin Isn’t Yours (And Never Was)
95% of Bitcoin is held on exchanges (Coinbase, Binance, Kraken, etc.), not in self-custody wallets.
Exchanges freeze, seize, and censor transactions all the time (e.g., Coinbase banning Tornado Cash users, Binance freezing accounts at government request).
If your Bitcoin is on an exchange, you don’t own it. You own an IOU—just like a bank.
Withdrawal limits, KYC, and government pressure mean your Bitcoin is only as free as the exchange allows.
→ Sound familiar? This is just digital banking with extra steps.
4. The Blockchain Surveillance State: Bitcoin Is the Ultimate Financial Panopticon
Bitcoin was supposed to be private money. Instead, it’s the most transparent financial system ever built:
Every transaction is public forever—no deletions, no do-overs.
Chain analysis firms (Chainalysis, TRM Labs, Elliptic) work with governments, banks, and exchanges to track, deanonymize, and blacklist users.
Once your wallet is linked to your identity (via an exchange, merchant, or IP leak), every transaction you’ve ever made is exposed.
Law enforcement loves Bitcoin because it’s easier to trace than cash. The FBI has recovered billions in Bitcoin from criminals—not because it’s secure, but because it’s trackable.
→ Cash leaves no trail. Bitcoin leaves a permanent, public record of your entire financial life.
5. The Whale Problem: 2% of Wallets Control 50% of Bitcoin
Just 2% of Bitcoin addresses hold over 50% of the supply (BitInfoCharts).
The top 100 wallets own more Bitcoin than the bottom 100 million combined.
Whales manipulate the market with pump-and-dump schemes, while retail investors get rekt in every cycle.
→ This isn’t decentralized money. This is a rigged casino where the house always wins.
*6. The Irony: Bitcoin Is More Surveilled Than Traditional Finance
Bitcoin was supposed to be an escape from the banking system—but it’s just a worse version of it:
Slower (10-minute blocks vs. instant cash).
More expensive ($50 fees vs. $0 for cash).
Less private (public ledger vs. untraceable cash).
More centralized (mining pools, exchanges, whales vs. local banks).
→ You traded real financial privacy for a digital illusion of freedom.
7. The Ultimate Scam: "Decentralization Theater"
Bitcoin’s real decentralization is a marketing gimmick to keep you invested while:
Miners, exchanges, and whales extract wealth from retail.
Governments and corporations use the blockchain to track and control financial activity.
The narrative of "freedom" keeps you holding the bag while the insiders cash out.
→ You were sold a revolution. You got a surveillance network with a ticker symbol.
What’s Actually Decentralized? (Hint: Not Bitcoin)
If you want real financial sovereignty, here’s what beats Bitcoin:
✅ Physical cash – No ledger, no tracking, no middlemen.
✅ Gold & silver – No transaction history, no KYC, true store of value.
✅ Privacy coins (Monero, Zcash) – Actually untraceable transactions.
✅ Local barter & trade – No blockchain, no surveillance.
Bitcoin is not the future of money. It’s a centralized, surveilled experiment that enriches the few while fooling the many.
Final Verdict: Bitcoin Is a Centralized, Censored, and Controlled System
Mining? Controlled by a few corporations.
Validation? Run by cloud providers and exchanges.
Ownership? Most Bitcoin is held by whales and custodians.
Privacy? Worse than a bank account.
You’ve been fooled. The "decentralized revolution" was just another Wall Street trap—and the joke’s on you.
→ Wake up. The emperor has no clothes.
NASDAQ:COIN NASDAQ:MSTR TVC:GOLD TVC:SILVER NASDAQ:MARA TVC:DXY

Head and shoulders triangle. Possible dump sub $100,000 in play.Our sell signals came in at top (126k) and last high for right shoulder. Looks like BTC will play within this pattern. Squeeze between max 113.5k and the 106k-104k bottom area (depending ion when it gets there) where it needs to make a decision: Either strong bounce and break to upside with possible 122k target or dump hard below 100k and possibly to low 90K area.

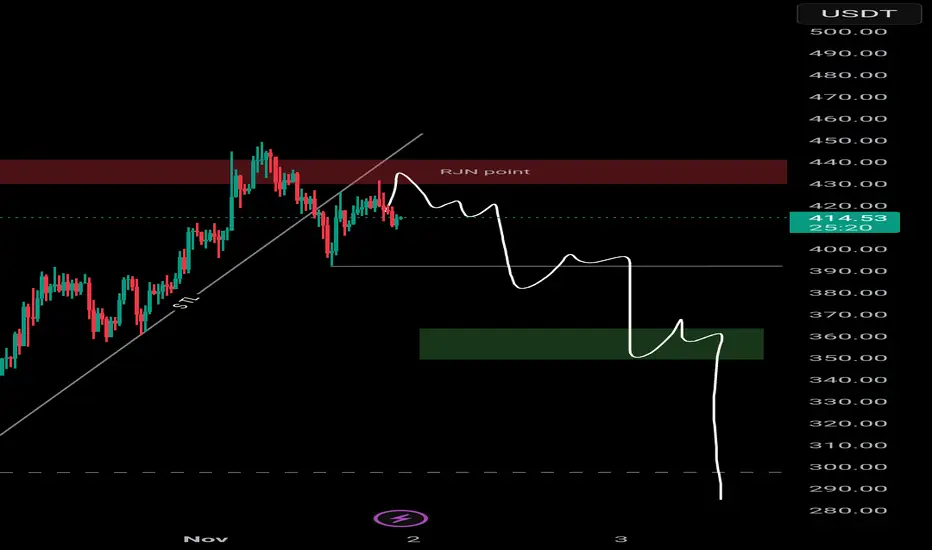
Shorted again near $430, expecting 20%+ pullbackCRYPTOCAP:ZEC 𝗦𝗵𝗼𝗿𝘁𝗲𝗱 𝗮𝗴𝗮𝗶𝗻 𝗻𝗲𝗮𝗿 $𝟰𝟯𝟬, 𝗲𝘅𝗽𝗲𝗰𝘁𝗶𝗻𝗴 𝟮𝟬%+ 𝗽𝘂𝗹𝗹𝗯𝗮𝗰𝗸🩸🔴
CRYPTOCAP:ZEC just slammed into the $450 resistance — looks like the party’s over for late FOMO buyers! 😈
I’ve stacked shorts around $430, expecting a sharp 15% - 20%+ correction as momentum fades out.
Next big buy zone on my radar: $300–$280, where I’ll watch for the next major bounce setup! ⚡
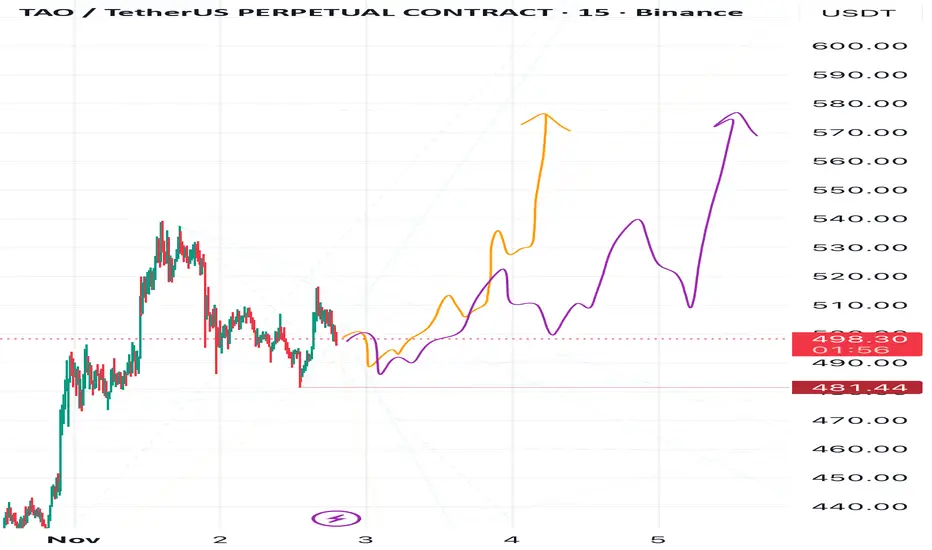
TAO to Glow — Just Like DASH FlowTAO is showing a price structure very similar to DASH, which makes me expect a strong upward move ahead.
I currently see two growth scenarios for TAO — following the purple and orange arrows on my chart.
Both lead to the same target zone:
🎯 Target 1: 580
🎯 Target 2: 640
🎯 Target 3: 720
❌ Invalidation Zone: 481.44
Both scenarios remain valid unless the price closes below that red level.
🚀 If you want more forecasts — leave a reaction!
🔔 Follow me so you don’t miss my daily updates — I post new analyses almost every day!
Woof Woof — Bulls on the Roof?I’m expecting Dogecoin to rise from the current levels toward 0.20400 🎯
❌The invalidation zone for this plan is set at 0.18375
Let’s see if the bulls can push it higher from here 🐶🚀

Dash on the Move — Bulls ApproveI expect DASH to rise toward 52, then 56, and later 68.
Two possible paths:
either it reaches 52, makes a pullback to current levels, and then moves up to 56,
or it goes straight to 56 without a pause.
In both cases, this move is part of a corrective triangle ABCDE,
with an upside breakout expected afterward —
which could take DASH even beyond 68 in the foreseeable future.
🎯 Targets:
• Target 1: 52
• Target 2: 56
• Global target: 68
Green — nearest growth potential.
Red — invalidation zone.
Let’s see which path DASH chooses 👀
Stay tuned for updates 🔔

GOLD: Waiting For the Bulls To Join the PartyGOLD: Waiting For the Bulls To Join the Party
From our previous analysis, gold reached the same target twice. The bullish momentum is low, but it could increase over time.
The prevailing trend is evident, which is intact and remains bullish.
Today on the US economic calendar, the PCE data was expected to be reported.
Given that we have a data shortage due to the US government shutdown, this could raise questions again and could help gold to rise.
You may find more details in the chart!
Thank you and Good Luck!
❤️PS: Please support with a like or comment if you find this analysis useful for your trading day❤️
Previous analysis:

NZDJPY near one of the major buy zonesThe NZD/JPY is currently approaching the previously breached trendline resistance, which has now transitioned into a key support level. This retest of the former resistance-turned-support presents a favorable opportunity to consider long positions. We will initiate a long trade within this support zone and define our profit target accordingly.
DISCLAIMER: ((trade based on your own decision))
<<press like👍 if you enjoy💚

USDCAD Eye a Deeper Pullback as Oil & Dollar Momentum CoolsUSDCAD, After a sharp rebound toward 1.4020, USD/CAD is showing signs of exhaustion as selling pressure re-emerges at the top of the recent range. With oil prices stabilizing near mid-60s and the Bank of Canada signaling patience amid weak but steady domestic data, the pair faces the risk of another leg lower toward 1.39 and possibly 1.38 if U.S. data underperforms.
Current Bias
Bearish – USDCAD is holding below key resistance at 1.4030, with price action suggesting a potential correction toward 1.3910 and 1.3810 in the short term.
Key Fundamental Drivers
Oil Recovery: Crude oil has rebounded from recent lows, supporting the Canadian dollar and easing upward pressure on USD/CAD.
Divergent Central Bank Tone: The Fed remains cautious on cuts, while the BoC maintains a “wait and assess” stance, reflecting a balanced policy gap that limits upside for USD/CAD.
Data Softness: Canada’s growth data remains sluggish, but labor market strength offsets deeper pessimism. Meanwhile, U.S. consumer and manufacturing resilience keeps USD demand steady.
Yield Differentials: Modest narrowing between U.S. and Canadian yields favors mild CAD appreciation if risk sentiment holds stable.
Macro Context
U.S. economy continues to show solid momentum, though some leading indicators are flattening. Fed officials, including Logan and Schmid, have signaled that rates are restrictive enough but still not ready for aggressive cuts.
In Canada, Q2 GDP showed contraction, but employment and wage data suggest the downturn is shallow. The BoC remains cautious, preferring stability over immediate easing. Oil’s moderate rebound and stable export demand provide underlying CAD support.
Globally, energy market stabilization and China’s steady PMI data are limiting risk-off flows, reducing USD’s haven premium.
Primary Risk to the Trend
A sudden decline in oil prices or a hawkish shift from the Fed could reignite USD strength and push USD/CAD back toward 1.41+. Conversely, an unexpected BoC hawkish tone or strong Canadian employment data could accelerate the downside.
Most Critical Upcoming News/Event
U.S. ISM Manufacturing and Services PMI
U.S. Non-Farm Payrolls and CPI data
Canada Employment Report and Ivey PMI
BoC’s Business Outlook Survey
Leader/Lagger Dynamics
USD/CAD typically acts as a lagger to broader USD trends but a leader among commodity-linked currencies (AUD/CAD, NZD/CAD). Oil and Treasury yield moves drive its direction, while DXY strength or weakness sets the overall bias.
Key Levels
Support Levels: 1.3910, 1.3810
Resistance Levels: 1.4030, 1.4080
Stop Loss (SL): 1.4070 (above structural resistance)
Take Profit (TP): 1.3810 (lower support confluence)
Summary: Bias and Watchpoints
USDCAD carries a bearish bias as short-term momentum fades below 1.4030. The combination of firmer oil prices, a steady BoC stance, and a cooling dollar backdrop sets the stage for a pullback toward 1.3910 and potentially 1.3810. Traders should watch for confirmation from upcoming U.S. ISM and jobs data, which could either reinforce the correction or restore USD dominance. A stop above 1.4070 helps protect against sudden yield-driven spikes, while 1.3810 remains the key target zone aligned with both technical structure and the evolving macro narrative.

GBPUSDGBPUSD needs push up this week to complete the structure, expect at least a 100 pips push up.
Disclosure: We are part of Trade Nation's Influencer program and receive a monthly fee for using their TradingView charts in our analysis.

USDCADPrice has gotten to a prime location , just wait for the break of the trendline then the sell continues

Silver ABC Correction to ContinueAccording to Neely guidelines, the nominal maximum for wave C projects to 1.68% of Wave A ($41.7) .

Solana — Triangle Tale Before the Pale As you might remember from my previous publications, I’m expecting Solana to decline toward 164 and possibly even lower.
At the moment, I’d like to see it around 178, and depending on how the move toward this level develops, I’ll decide on my next steps — which you’ll see in my upcoming updates.
I have a thought that after reaching 178, Solana might move upward first, forming a corrective triangle, and only later drop to 164 or even below.
The invalidation zone for the current plan is marked in red on the chart.
📉 Follow me so you don’t miss my next analyses and scenario updates

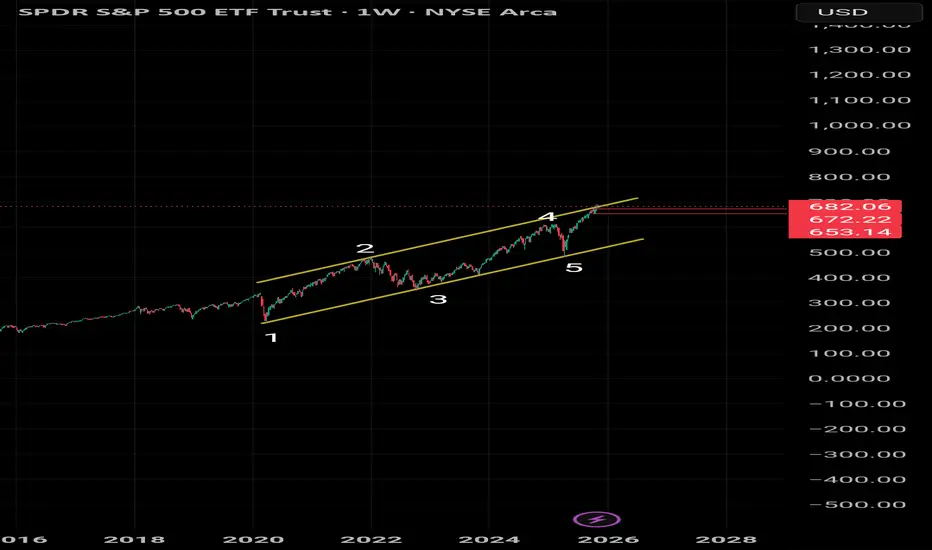
Something bad could be comingIt looks like we're completing wave 5 on the weekly chart, meaning we might get a massive correction in the next coming months.
Hello bearish marketBINANCE:BTCUSDT
As expected, the market hit a new high 126200 on the back of positive news, mainly to hunt stops and trigger massive short positions worth millions.
Here’s my warning ‼️ — (speaking from 8️⃣ years of experience) — the bullish phase is over💯. We should now expect strong corrective waves ahead.〽️🔤
The chart clearly shows a beautifully completed 5-wave uptrend✅, signaling that the market is entering a corrective or bearish 🐻 phase that could last around 2 years.
Prices could easily drop to around $36,000, and possibly even lower — down to $22,000 as a potential bull trap.
good luck guys.

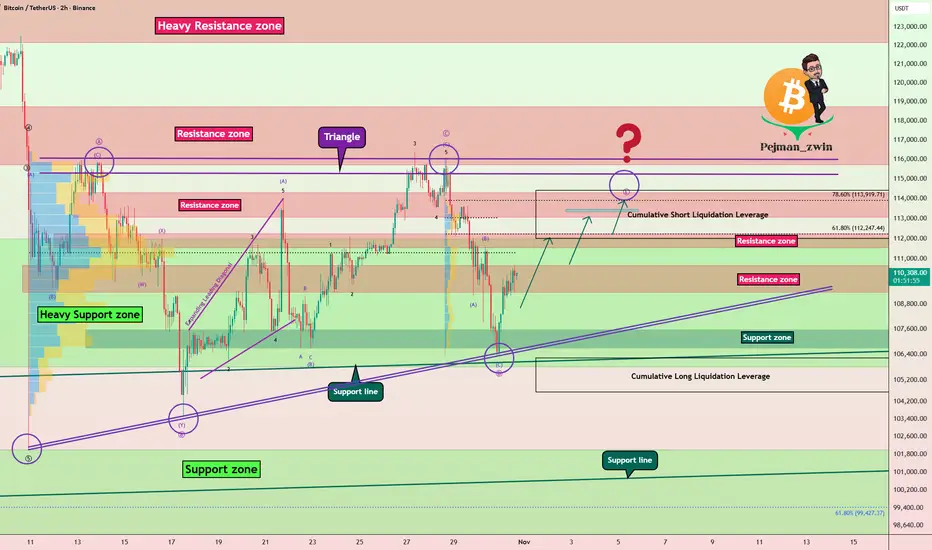
Bitcoin Correction Forming a Triangle – Which Way Next?Bitcoin ( BINANCE:BTCUSDT ), just as I expected in the previous idea , started to decline and reached its full target .
Over the past 20 days , Bitcoin has been moving in a ranging pattern that seems to be forming into a triangle shape .
From an Elliott Wave perspective , this corrective structure also appears to be a triangle , with its wave E potentially completing around the Resistance zone($114,300-$113,000) and the Cumulative Short Liquidation Leverage($114,424-$112,000) .
I expect that in the coming hours, Bitcoin can rise at least up to about $112,800 . If the upward momentum is strong enough , we might even see it reach the upper lines of the triangle .
Cumulative Long Liquidation Leverage: $106,231-$104,648
Please respect each other's ideas and express them politely if you agree or disagree.
Bitcoin Analysis (BTCUSDT), 2-hour time frame.
Be sure to follow the updated ideas.
Do not forget to put a Stop loss for your positions (For every position you want to open).
Please follow your strategy and updates; this is just my Idea, and I will gladly see your ideas in this post.
Please do not forget the ✅' like '✅ button 🙏😊 & Share it with your friends; thanks, and Trade safe.
ZEC - Roadmap to $500!💪Zcash has been on fire lately, outperforming over 90% of altcoins in the market. After months of accumulation, the bulls have finally taken control, driving ZEC into a strong impulsive rally that shows no signs of exhaustion yet.
📈 From a technical perspective , ZEC is trading within a well-defined rising channel, maintaining a clean bullish structure of higher highs and higher lows. The recent breakout above the previous all-time high around $372 confirms strong bullish momentum.
🏹As long as the channel’s lower boundary continues to act as dynamic support, the next logical target for the bulls sits around the $500 round number, which aligns with the upper boundary of the channel, a major confluence zone.
In the short term, a minor pullback toward the $370–$400 region wouldn’t be surprising and could offer new long opportunities before the next bullish leg kicks in.
⚠️ Disclaimer: This is not financial advice. Always do your own research and manage risk properly.
All Strategies Are Good; If Managed Properly!
~Richard Nasr

S&P will decline to 6350 from 6840 in the next 2-5 daysS&P will decline to 6350 from 6840 in the next 2-5 days

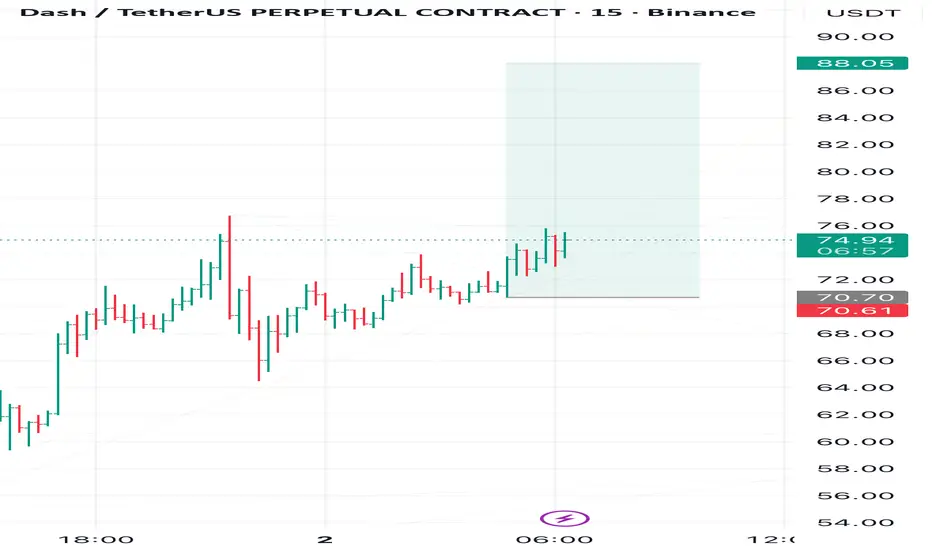
DASH on Fire – Aiming Higher!I’m expecting the Dash rally to keep going — the chart still looks full of energy.
My next target is 88, and maybe even higher 📈
🚀Globally, I’m watching 100 and 120 as long-term goals, but for now, 88 is my main focus.
❌The invalidation zone is marked in red on the chart at 70.61.
I’m personally expecting the momentum to stay strong — let’s see what the chart will show us next.
This is not financial advice; everyone should manage their own risks.
No Rise in Sight — the Drop’s Still RightAs I mentioned before, I expect Bitcoin to decline toward 104K, and now the signs of this move are forming.
The invalidation zone is marked on the chart (and may be shifted closer to 110,445).
After reaching 104K, a sharp but limited rebound is possible, but I don’t expect a trend reversal at this stage.
⚠️ This is not financial advice or a trade signal. Please manage your risks and follow your own money management system.

GOLD → Consolidation. The fundamental backdrop is changing...FX:XAUUSD stabilizes after a week-long decline, failing to consolidate above $4050. The market is taking a pause before new impulses. Focus on 4030 and 3980...
Investors are closing positions before the end of the week and month, the reason being the uncertainty surrounding the deal with China and Powell's less dovish stance on policy: a 25 bp rate cut is already priced in. The probability of a December cut has fallen to 72.8% (from 91.1% a week ago). Powell emphasized that decisions depend on data, which is not available due to the shutdown.
The strong dollar (2-month highs) is putting pressure on gold. Weak data from China (PMI fell to 49.0) is reducing demand from the largest consumer.
The balance is tipping towards weak fundamentals...
Resistance levels: 4030, 4085
Support levels: 3982, 3955, 3915
Technically, bears are keeping the market below 4030 - strong resistance. If buyers enter the market (there are currently no fundamental reasons for this) and the bulls are able to break through 4030 and keep the price above this level, we will have a chance for growth. But under the current circumstances, I expect a correction to support before a possible rise.
Best regards, R. Linda!

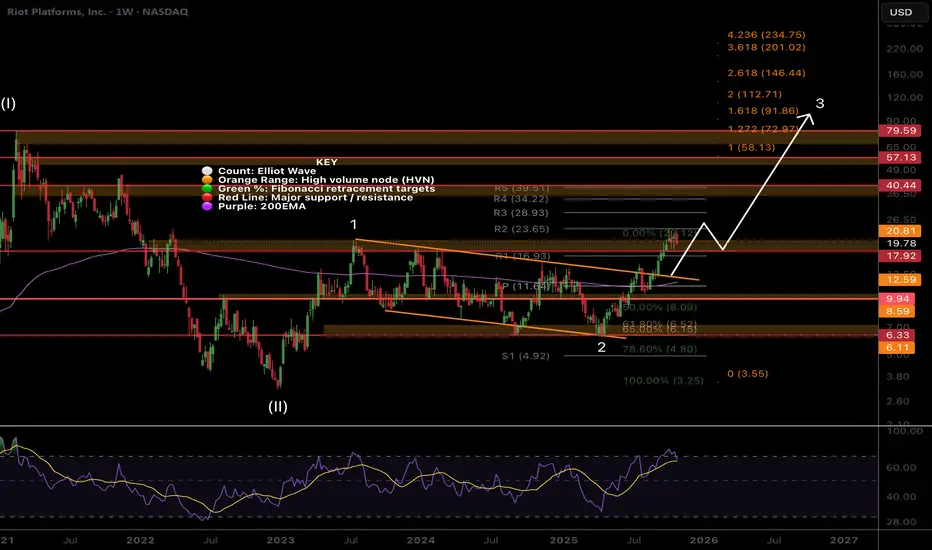
RIOT, nothing changed, Higher...Riot is another low cap volatile asset that keeps people afraid with its wild swings as I am seeing panic in my comments across platforms.
Price remains in momentum breaking out of the channel in a wave 3 with a minimum target of the 1.618 Fibonacci extension at $91, a 4x from here. Wave 2 completed at triple support- Fibonacci golden pocket, High Volume Node and channel boundary before quickly overcoming the weekly pivot and 200EMA. Breaking out above wave 1 is a show of strength.
Price should stall at the High Volume Nodes as supply comes in; $21, $40 and $57 but ultimately they should be overcome.
🎯 Terminal target for the business cycle could see prices as high as $112 based on Fibonacci extensions
📈 Weekly RSI is oversold with no divergence and can remain here for months as price keeps increasing.
👉 Analysis is invalidated if we close back below $9