ROSE: Buyers’ Zone in PlayPrice is currently trading inside a historical buyers’ zone , where prior downside objectives have already been met and selling pressure has diminished.
After the expansion, distribution, and unwind phases, the market has transitioned into acceptance at lower prices , suggesting potential interest from buyers rather than continuation to the downside.
This zone does not guarantee a reversal — but it is where bullish participation typically begins , if the market intends to rotate higher.
As long as price holds above this base, the expectation is for buyers to step in and attempt a reaction . Failure to do so would invalidate the bullish premise and keep price in balance.
This is a directional expectation, not a signal. Not financial advice.
Wave Analysis

XAU/USD: Bearish Correction from Premium Supply ZoneGold (XAU/USD) is currently undergoing a technical pullback on the 15-minute timeframe after reaching an extreme premium valuation. Following a massive bullish expansion, the price has encountered a high-interest institutional supply zone near the 5,650 - 5,693 range. The current price action indicates a "Mean Reversion" phase as the market seeks to rebalance the recent vertical surge.
Technical Deep-Dive:
Supply Zone Interaction: The upper purple box represents a significant resistance barrier where initial selling pressure has materialized. The failure to sustain momentum above 5,650 suggests that buyers are taking profits, allowing for a corrective structure to develop.
Correction Trajectory: As illustrated by the black forecast path, the market is expected to perform a series of lower highs. The projected move focuses on a retest of intermediate liquidity before continuing its descent toward established value areas.
Key Downside Objectives:
Primary Target: 5,450 – This minor demand zone serves as the first major area of interest for a potential bounce.
Major Target: 5,378 – A deeper retracement level that aligns with the green support block, where a significant pool of buy orders is anticipated.
Risk Management: The bearish outlook for this correction remains valid as long as the price holds below the 5,693 peak. A decisive close above this supply zone would invalidate the retracement thesis and signal a continuation into uncharted territory.
Trading Strategy: This setup favors a "Sell the Retest" approach within the distribution phase. Traders should monitor for bearish confirmation—such as a rejection wick or a shift in lower-timeframe structure—before targeting the expansion toward the identified support zones below.

GBPUSD 1H Outlook Today: Post-Rally DistributionGBPUSD 1H Outlook Today: Post-Rally Distribution, CHoCH Down and Sell-Rally Levels to Watch
GBPUSD on the 1H chart is transitioning from a strong bullish impulse into a distribution phase under a clear weak high. Price is now trading around 1.3750, and the latest CHoCH to the downside suggests the market is losing upside momentum. Unless buyers can reclaim the upper supply band, today’s higher-probability path is a pullback-sell (sell the rally) toward the nearest demand zone.
1H Market Structure and Price Action
The pair rallied aggressively, then stalled under the weak high (liquidity resting above the top).
Multiple rejections near the top show supply absorption and profit-taking.
A CHoCH down near the current range implies short-term control is shifting to sellers.
Price is consolidating after the drop, which often leads to either:
a retracement back into supply (ideal short location), or
a continued grind lower toward demand.
Key Support and Resistance Levels (Intraday)
Resistance (Supply / Sell Zones)
1.3790–1.3815: primary supply band (retest area for sell-rallies)
1.3845–1.3855: weak high liquidity (sweep risk, then reversal potential)
Support (Demand / Buy Reaction Zones)
1.3730–1.3740: intraday pivot (holds price from sliding quickly)
1.3660–1.3675: main demand zone (first major downside magnet)
1.3500 then 1.3440: deeper supports if 1.366 fails
Fibonacci Confluence (Best Map for Execution)
Using the swing 1.3825 (high) → 1.3665 (low), key retracements line up cleanly with the chart:
0.382: ~1.3726
0.500: ~1.3745
0.618: ~1.3764
0.786: ~1.3791
This makes 1.3764–1.3791 a high-quality “decision pocket” for shorts, especially if it overlaps with the supply band 1.3790–1.3815.
Trendline, EMA, RSI Filters (To Avoid Low-Quality Trades)
Trendline
Draw a rising trendline from the impulsive leg. If price continues to trade below that trendline after pullbacks, the market remains corrective and favors sells.
EMA (20/50/200)
Bearish continuation is favored if price holds below EMA20/EMA50 and EMA20 slopes down.
Bullish recovery requires reclaiming EMA50 and holding it on retest, not just a wick.
RSI
Shorts are higher quality when RSI fails below 50 during pullbacks.
Longs only become attractive if RSI reclaims 50 and price prints higher lows.
Trading Plans for GBPUSD Today (1H)
Plan A: Sell the Rally Into Supply (Primary Setup)
Entry zone: 1.3765–1.3815 (prefer 0.618–0.786 Fib area with rejection)
Trigger: bearish rejection candle or lower-high structure on 5–15m
Stop loss: above 1.3845–1.3855 (above weak high / sweep protection)
Take profit 1: 1.3740
Take profit 2: 1.3660–1.3675 demand
Extension: 1.3500 if momentum expands
Plan B: Breakdown + Retest (Momentum Setup)
Condition: 1H close below 1.3730–1.3740
Entry: sell the retest of 1.3730–1.3740 as resistance
Stop loss: above the retest swing high
Targets: 1.3670, then 1.3500
Plan C: Buy Only at Demand (Countertrend, Lower Priority)
Entry zone: 1.3660–1.3675 only after a clear rejection (wicks + structure shift up)
Stop loss: below demand base
Take profit: 1.3730–1.3740, then 1.3765 if momentum holds
Invalidation and Bullish Flip Conditions
The bearish intraday thesis weakens if GBPUSD reclaims and holds above 1.3815, and becomes bullish only if price accepts above 1.3845–1.3855 (weak high area) with structure building higher highs.

GBPJPY Is Bearish! Short!
Please, check our technical outlook for GBPJPY.
Time Frame: 1h
Current Trend: Bearish
Sentiment: Overbought (based on 7-period RSI)
Forecast: Bearish
The market is testing a major horizontal structure 211.866.
Taking into consideration the structure & trend analysis, I believe that the market will reach 211.242 level soon.
P.S
We determine oversold/overbought condition with RSI indicator.
When it drops below 30 - the market is considered to be oversold.
When it bounces above 70 - the market is considered to be overbought.
Like and subscribe and comment my ideas if you enjoy them!

GBP/CHF BEARS ARE STRONG HERE|SHORT
GBP/CHF SIGNAL
Trade Direction: short
Entry Level: 1.060
Target Level: 1.055
Stop Loss: 1.063
RISK PROFILE
Risk level: medium
Suggested risk: 1%
Timeframe: 1h
Disclosure: I am part of Trade Nation's Influencer program and receive a monthly fee for using their TradingView charts in my analysis.
✅LIKE AND COMMENT MY IDEAS✅

EURUSD 1H Analysis Today: Range Build After ImpulseEURUSD 1H Analysis Today: Range Build After Impulse, Buy-the-Dip Bias While 1.183–1.187 Holds
EURUSD is transitioning from a strong impulsive rally into a corrective range on the 1H chart. Price is currently hovering around 1.1938, sitting between a clear supply cap near 1.197–1.199 and a key demand zone around 1.183–1.187. The “weak high” liquidity remains parked above the swing top, which keeps the upside magnet active as long as structure does not break down.
This is a classic environment for Fibonacci + trendline + EMA/RSI confirmation: wait for price to reach levels, then execute with structure.
1H Market Structure and Price Behavior
The macro leg is bullish (strong push into a marked weak high), followed by profit-taking and consolidation.
Short-term CHoCH prints suggest chop and liquidity grabs inside the range, not a confirmed trend reversal yet.
Bias stays mildly bullish while price holds above the main demand zone and continues printing higher lows on lower timeframes.
Key Support and Resistance (Intraday Levels)
Resistance Zones (Supply / Sell Reaction Areas)
1.1970–1.1990: immediate supply cap (rejection zone under 1.2000)
1.2000–1.2020: psychological + structure pivot if reclaimed
1.2055–1.2075: weak high liquidity zone (highest probability target if bullish continuation triggers)
Support Zones (Demand / Buy Reaction Areas)
1.1910–1.1920: intraday pivot (decision area around current consolidation)
1.1830–1.1870: primary demand zone (major “buy-the-dip” area)
1.1730–1.1760: next support shelf (if demand fails)
1.1670: strong low (major downside magnet if bearish expansion occurs)
Fibonacci Confluence (Swing Low to Swing High)
Using the main move 1.1670 → 1.2065, the retracement levels align tightly with your zones:
0.236: ~1.1972 (matches the current supply band)
0.382: ~1.1914 (current pivot area)
0.50: ~1.1868 (upper edge of demand)
0.618: ~1.1821 (lower edge of demand)
0.786: ~1.1755 (next support shelf)
This makes 1.183–1.187 the most important “reaction” area on the chart.
Trendline, EMA, RSI Filters (How to Avoid Low-Quality Entries)
Trendline Logic
Draw a trendline from the impulse higher low into the current structure. As long as pullbacks respect the rising line (or reclaim quickly after a sweep), the bullish case remains valid.
EMA Confirmation (20/50/200)
Bullish continuation improves if price holds above EMA50 on pullbacks and EMA20 slopes upward.
If price stays below EMA20/EMA50 and EMA20 crosses down, treat rebounds as corrective sells into supply.
RSI Confirmation
Bullish setups are cleaner when RSI holds above 50 or reclaims 50 after a dip.
Bearish continuation strengthens if RSI fails repeatedly under 50 during rebounds.
EURUSD Trading Plans for Today (1H Execution)
Plan A: Buy the Dip at Demand (Primary Setup)
Best when price taps demand and prints a clear rejection (long lower wick, bullish engulfing, or lower-timeframe CHoCH up).
Entry zone: 1.1830–1.1870
Stop loss: below 1.1820 (or below the rejection wick low)
Take profit 1: 1.1910–1.1930
Take profit 2: 1.1970–1.1990
Extension target: 1.2055–1.2075 (weak high liquidity)
Plan B: Breakout Continuation Above Supply (Momentum Setup)
Only valid with acceptance above the cap, not a quick wick.
Trigger: 1H close above 1.1990–1.2000, then a retest that holds
Entry: buy the retest of 1.1990–1.2000
Stop loss: below the retest swing low
Targets: 1.2055–1.2075
Plan C: Bearish Breakdown (If Demand Fails)
If price closes below demand and cannot reclaim it, the market likely shifts into deeper correction.
Trigger: 1H close below 1.1820
Entry: sell the retest of 1.1830–1.1870 as resistance
Targets: 1.1760, then 1.1730, and potentially 1.1670 if momentum expands
What Invalidates the Bullish Bias
The bullish plan weakens significantly if EURUSD breaks and holds below 1.1820 (Fib 0.618 and demand base). Above 1.2000, upside continuation toward the weak high becomes the higher probability path.

AUD/USD posts a doji-style candle at the 34-month swing highThe rally was sold, and the dip was bought, resulting in AUD/USD posting a doji-style candle from the 34-month swing high of 0.7094.
With a continued risk-off tone, the overnight rally has found sellers.
Support is located at 0.6870. We have the projected AB leg of a BAT formation at 0.6862.
There is scope to build a cypher pattern over the medium term. The completion would be close to the previous month's high (PMH)
Conclusion: a break of yesterday's swing low should project AUD/USD to the downside towards the 0.6870 to 0.6862 confluence zone

CADJPY SELLThe price is pulling back after breaking the trend line... With the confirmation of selling pressure, a sell position can be opened.

Precipitously PrecariousGold seems to have finished the end of a double zig zag wave having lasting nearly 200 years. If my interpretation of its macro structure is correct, it will once again respect the decades long-trend and drop massively in value in the years ahead.
Gold is heavy. Its not easy to tender. It has no daily utility.
Let's see where this goes.

critical zones trades according my pervious post 1:1 is done now trail sl cost to cost or book some quantity all over tgt is upper zone

BTC | DailyCRYPTOCAP:BTC — Quantum Model Projection
Bottoming | 2nd Bullish Alt. 📈
BTC is holding at the Q-Structure λₛ confluence ➤ $78K, marking structural completion of the (W)(X)(Y) correction within Primary Wave ⓸.
🔖 This outlook is derived from insights within my Quantum Models framework.

today's levelsu can use it for perfect setups 2 lines one zone if zone break then we go for thqt side trade same in reversal and we not trade in zone only trade after zones breakout or breakdown use at your own risk

XAGUSD, Elliott wave analysis■Outlook of XAGUSD on 1W chart.
In the previous analysis, a long-term outlook for XAGUSD was presented using the 1M chart.
In this analysis, I have illustrated the internal structure of upper degree wave (5).
On the chart, the red wave represents the base degree, the orange wave is one degree lower, and the green wave is another degree below that.
From 2020 to April 2025, Waves 1 and 2 appeared across all three degrees, and a strong upward movement emerged as the Wave 3s (3-(ⅲ)-(3)) at each degree interacted with one another.
This composite wave interaction resembles a waveform reconstructed through an inverse Fourier transform.
At present, it is highly likely that Wave (4) has begun in the degree two levels below the base. However, since the higher‑degree Wave 3 (3-(ⅲ)) has not yet been completed, the broader trend still has room to extend further. The current wave is supported by the red channel line, and once the time correction is complete, the bullish trend is expected to resume.
■Previous analysis (Jan 25, 2026)

BTC heading to 69K zoneBTC is heading to 69K zone on implusive wave. expecting a distributing to lure buyers follow by a dip to 69K

Can we get a bounce from BONKBONK Showing Demand From the Golden Window
Bonk is in a 1:1.618 GW Extension. A large falling star through the 1.786 overshoot ratio suggests demand for this higher ranked meme coin. It's possible we could get a bounce from this potential B wave bottom. It comes with risk and I don't expect this area to be a reversal, but a connective wave more than likely.
This Publish Is Intended For Educational Purposes Only


This Is Not a Prediction — It’s What Price Knew Before the NewsThis is not a prediction.
It is an observation of how price behaves before narratives turn into headlines.
Lately, the uncomfortable reality is that we ourselves have become part of the news.
Not because we are large enough to move markets on our own,
but because the environment we operate in has become impossible for markets to ignore.
That said, there are forces far larger than any single event or group.
Factors that may not directly involve human lives, yet often carry even greater weight for capital flows.
The announcement of a new Federal Reserve chair is one such example.
Over the weekend, my analysis led to a conclusion on the chart that felt unusual.
From a structural and geometrical perspective, it was clean and consistent.
Yet finding confirmation in the real world was not straightforward.
That tension lingered — not because the chart appeared flawed,
but because price seemed to be processing information before it became visible in the news.
We already understand some fundamental truths.
News is a catalyst, not the cause.
Markets do not generate money.
Which means it is impossible for everyone to be positioned on the same side —
buyers cannot exist without sellers.
We also know that, particularly on lower timeframes, markets are effectively zero-sum.
One participant’s profit is another’s loss.
This is why rational exits and profit-taking are not optional decisions,
but structural necessities.
At the same time, the impact of war on gold and equity markets is well understood.
Not just through headlines, but through price behavior itself.
This brings us to the key question:
How can gold and silver move lower while equity markets push higher?
This is where the narrative around potential Iran–US negotiations becomes relevant.
The reality of conflict had already been fully visible to the world — and to the market.
Its effects were largely priced in long before escalation became a dominant headline.
In such an environment,
the idea of negotiations can temporarily reduce risk aversion.
Not because underlying risks have disappeared,
but because capital responds to perceived shifts in narrative.
For those accustomed to long-term geopolitical uncertainty,
market reactions to conflict and diplomacy tend to follow familiar patterns.
The result can be a deeper correction in gold,
alongside strength in equity markets.
Not necessarily because long-term direction has changed,
but because positioning is being adjusted.
This kind of price action often serves two purposes at once:
creating more favorable entry conditions in gold,
while allowing large participants to distribute exposure in equities.
Notably, this interpretation aligns closely with market geometry across multiple charts.
Even the lack of advance communication to key allies regarding the timing of military actions
may point less to disorder and more to deliberate opacity —
a condition that volatility thrives on.
It is difficult to believe that an experienced businessman would genuinely expect
such negotiations to deliver a meaningful or lasting resolution.
Is the current strength in equities a genuine signal of safety —
or simply the final window for capital to reposition?

EOS/VaultaThe cryptocurrency market is currently experiencing a phase reminiscent of the dot-com boom of the late 1990s. Back then, the internet was the revolutionary technology, sparking massive hype, sky-high valuations for anything with a ".com" in its name, and an explosion of startups. Investors poured billions into speculative ventures, many of which had little revenue, real products, or sustainable business models. When the bubble burst around 2000-2001, the NASDAQ crashed dramatically—wiping out trillions in value—and most companies vanished. Yet a handful survived and thrived: Amazon evolved from an online bookstore into an e-commerce and cloud computing giant, while Google (which went public later) dominated search and built an empire on advertising and innovation. The key? They focused on solving real problems, building durable infrastructure, and adapting through tough times.Today, crypto mirrors that explosion in several ways. We're seeing an influx of thousands of tokens and projects—many driven by hype, memes, or promises of quick riches—leading to rapid price surges, massive market caps for low-utility assets, and widespread speculation. Bitcoin hit new highs (around $125,000 in late 2025), and the broader market has seen booms fueled by institutional interest, regulatory shifts, and trends like digital asset treasuries. Analysts frequently draw parallels to the dot-com era, noting how overvaluation, FOMO (fear of missing out), and detachment from fundamentals echo the past. Predictions vary wildly for 2026, from conservative floors around $75,000 for Bitcoin to optimistic highs, but volatility remains high, with warnings of potential corrections or "bubble" elements in certain segments (like some corporate crypto treasury plays that have already seen sharp declines).The reality is stark: just like the dot-com era, where countless internet companies failed, the vast majority of today's cryptocurrencies and projects won't survive long-term. Estimates often suggest 90-95% could fade away or become irrelevant, as the market matures and weeds out the weak through "crypto winters," competition, regulatory pressure, and shifts toward real adoption. Only those with strong fundamentals—proven technology, active users, real-world utility, and adaptability—will endure and potentially dominate, much like Amazon and Google did in the internet space.A recent example of adaptation in this environment is Vaulta, which emerged from the rebranding of EOS in 2025. EOS was one of the standout projects from the 2017-2018 ICO boom, raising a record-breaking $4 billion+ and positioning itself as a high-performance, scalable smart contract platform to rival Ethereum. Despite early promise, it faced challenges like governance issues, competition, and declining momentum over the years.In March 2025, the EOS Network Foundation announced a full rebrand to Vaulta, shifting focus from a general-purpose blockchain to a specialized platform for Web3 banking. This pivot emphasizes fast, low-cost transactions, seamless integration for decentralized finance with traditional banking elements, and tools for regulated financial services—positioning it to bridge DeFi and institutional finance while harnessing trends like Bitcoin's dominance.The rebrand culminated in a token swap starting May 14, 2025: existing ASX:EOS tokens exchanged 1:1 for the new native token $A (Vaulta). It wasn't a fork or reset—the underlying blockchain, history, and infrastructure remained intact—but the new identity better aligned with its evolved vision. Exchanges like Binance, Coinbase, and others supported the swap, and the move drew attention (even from entities like Trump's World Liberty Fi acquiring EOS tokens pre-rebrand).This echoes dot-com survivors: EOS/Vaulta didn't disappear during market downturns; instead, it pivoted strategically, rebranded for clarity and relevance, and refocused on a high-potential niche (Web3 banking) amid broader crypto maturation. Like Amazon doubling down on e-commerce and logistics or Google on search and scalability, Vaulta is betting on utility in a sector with growing demand—potentially positioning it as one of the projects that not only survives but emerges stronger if the market consolidates.Crypto's "dot-com moment" is exciting but risky. The explosion creates opportunities, but survival depends on building lasting value. Focus on projects with real innovation, active development, and clear paths to adoption—those are the ones most likely to become the Amazons and Googles of tomorrow.
Not investment advice

Big Move coming for CFX 2026, Conflux is focused on expanding the CNHT₀ and AxCNH ecosystems to serve as "digital rails" for real-world trade.
Regional Hub: Conflux acts as a "regionally compliant infrastructure bridge" linking mainland China, Hong Kong, and over 150 BRI nations.
Technical Performance: The Conflux 3.0 upgrade, implemented in late 2025, supports over 15,000 transactions per second (TPS) specifically to handle large-scale global settlement volumes.
Hong Kong Integration: Following the launch of Hong Kong's Stablecoin Ordinance on January 30, 2026, Conflux-based projects are positioned to participate in the first batch of licensed stablecoin issuers expected in February 2026.
If we do go lower I have 0.044490 as a support (4.236 fib) . We found support at 0.053689 (3.236 fib).

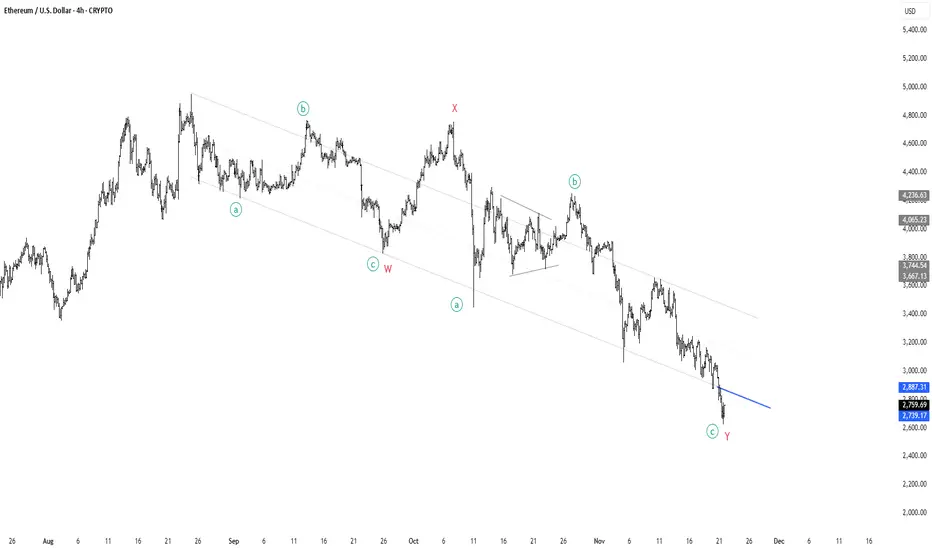
ETH to all time high! Lets go!🚨 ETH Elliott Wave Update 🚨
What we’re looking at here is a clean W-X-Y complex correction unfolding over months — a classic structure when the market wants to correct deeper without breaking the macro trend.
• Wave W completed with an ABC decline
• Wave X gave us the relief rally everyone thought was the bottom ❌
• Wave Y extended lower, subdividing into a-b-c, pulling price into the lower boundary of the corrective channel
Now we’re sitting right at the end of minor wave c of Y, the final leg of this entire structure. The pattern is mature, sellers look exhausted, and the downtrend channel is tightening — perfect conditions for a potential reversal.
🔵 The blue trendline is the key.
If ETH can punch through that level with momentum, it confirms the entire WXY correction is complete and opens the door for a major impulsive leg upward.
💥 Break the blue line → reclaim macro structure →
I believe ETH will begin the march toward new all-time highs.
This is where long-term bottoms historically form:
deep structure, clean proportions, fading downside velocity, and a clear invalidation level.
📈 Eyes on the breakout.
GBTC is hinting a major bottom soon on BTC!AMEX:GBTC
– Elliott Wave Update (1H Chart)
The decline from the Wave B high continues to follow a clean 5-wave impulse. Current price action suggests we are inside Wave (iv) before the final flush.
🧩 Structure so far:
🔻 Wave (i)
• Initial sharp drop
• Set the tone for the entire downtrend
🔻 Wave (ii)
• Reactive bounce into the mid-channel
• Perfect retracement behaviour for an impulse
🔻 Wave (iii)
• Long, persistent decline
• Strongest momentum segment
• Clean subdivisions visible on lower timeframes
🔵 Wave (iv) now forming:
• Grinding upward inside the corrective channel
• Should remain below upper channel resistance
• Likely forming a flat / zigzag corrective before rollover
🔻 Wave (v) expected next:
• Final leg down to complete C
• Target = lower channel + 60–62 region
• Completion of the larger corrective cycle
🟢 After Wave C completes:
• Expect a medium-term trend reversal
• First target = reclaiming broken channel lines
• Bigger target = recovery toward prior structure above 90+
📌 Summary:
Wave (iv) = corrective bounce.
Wave (v) = final drop → then macro reversal likely. ⚡
I am overall bullish on CRYPTOCAP:BTC after this drop. Please check my
BTC update here.

Nifty for Budget hello friends,
this for educational, for own trades, nifty am looking a down side move for tomorrow and this expiry. keep sl in system.
