MSTR: Mid-term and Macro Price Structure As price holds below $344, odds favor a continuation lower to retest February lows, with later potential bounce and one more push to macro-support levels: 160/150-120 (with a potential extension to 105)
(see. recent idea on BTC price structure)
If BTC and broad market indexes show signs of stabilization and short-term strength over the coming weeks with MSTR price rising above 344, the odds are shifting to a more pronounce bounce to 400-460 resistance levels.
Weekly chart:
From a macro perspective:
as long as price remains below the 460 level, I consider the bullish trend since 2008 lows to have topped in November 2024, with current price action unfolding as part of a larger corrective Wave c.4 structure. Otherwise, If price reclaims ATH the door opens for an extension to 780-1280 resistance levels.
Monthly chart
Recent idea on BTC:
Wavestructure

EURUSD ANALYSIS & FORECAST | Wave Structure That WORKSEURUSD MARKET ANALYSIS & FOREX FORECAST: Wave Structure Breakdown
Complete market analysis using wave structure methodology. High-probability sell entry executed with 2:1+ risk: reward targeting break below momentum low.
📊 TOP-DOWN MARKET ANALYSIS:
Recent High: 1.18042 (Tuesday, 17th December 2025)
Since making this momentum high, EURUSD has been attempting to complete its bearish secondary trend (pullback/correction phase).
🌊 1HR CHART WAVE STRUCTURE:
Wave Count Analysis:
Price has printed two momentum lows:
Wave 1 Momentum Low ✓
Wave 3 Momentum Low @ 1.17024 ✓
Current Position: Wave 4 (Bullish Pullback)
The current bullish run is Wave 4, a pullback from Momentum Low 3 to a structural point. This wave should terminate below Wave 2 (trend invalidation point).
🎯 FOREX FORECAST - What's Next:
Expected Move:
Once Wave 4 completes, we expect a break below Momentum Low 3 (1.17024) to form Wave 5 and complete the larger bearish structure.
💡 Why This WORKS - Objectivity Through Structure:
This market understanding and price behaviour analysis allows us to be:
✅ Objective - No emotion
✅ Clear - No guessing
✅ Strict - Follow the rules
We know exactly what we're looking for and when to act.
🔬 ADVANCED EXECUTION - Internal Wave Analysis:
Method: Isolating the minor wave within the major swing
Focus Area: Wave 4 → Wave 5 (final leg of this Wave 4 structure)
Fractal Nature Applied:
Counted the internal bars based on fractal, what WORKS on big timeframes WORKS on small timeframes. This is the beauty of understanding the wave structure.
💼 TRADE EXECUTION:
Entry: Internal Wave 5 completion @ 1.07454
Why This WORKS:
This timing is a key component of the WavesOfSuccess methodology because it provides:
✅ High-probability entries
✅ Low-risk execution
✅ Optimal entry at reversal point
Stop Loss: 1.1763 (17.6 pips risk)
Target: Break below 1.1703 (72.4 pips potential)
Risk:Reward: >2:1 (2.05:1 minimum, potential for more)
Key Principle:
Wave structure provides the roadmap. Fractals ensure consistency across timeframes. Precision timing creates asymmetric risk: reward opportunities.
This is market analysis that WORK, it is mechanical, objective and repeatable.
👍 Boost if this market analysis helps
👤 Follow for continued EURUSD FOREX FORECAST updates

How to Trade Reversals Like a Pro | CADJPY Wave 5 Entry hey Traders,
This is a live example of reversal trading using completed bullish wave structure. Entry executed, currently +10 pips, targeting 113.36 38:1 risk: reward.
🌊 Wave Structure Analysis:
Pattern Identified: Completed Bullish Wave Structure
What This Gives Us:
When a wave structure completes, it provides absolute clarity. We know exactly what our options are—no guessing, no confusion.
Our Two Options:
Sell the reversal (what we did)
Do nothing (if conditions aren't perfect)
That's it. No ambiguity. No emotional decision-making.
💡 The Power of WavesOfSuccess:
This is what proper wave counting provides:
✅ Objectivity - Remove emotion, follow structure
✅ Clarity - Know exactly what to do (or not do)
✅ Flawless Execution - Enter at precise levels
Important Reality Check:
Having clarity doesn't mean we never lose. Losing is an essential part of trading. We teach traders to accept losses quickly and immediately move to the next opportunity. The edge plays out over time, not on every single trade.
📊 Trade Execution Breakdown:
Focus Area: Last leg of bullish wave structure
Entry Method:
Counted the internal bar structures within the major Wave 5 swing. Precise entry at the 2nd Higher High (HH) bar of the internal wave count.
Entry: 114.42
Stop Loss: 114.46 (4Pips)
Why This Level:
The 2nd HH bar of Wave 5's internal structure represents peak momentum—the final push before exhaustion. This is where reversals should begin.
⚠️ Advanced Execution Warning:
This is NOT for novice traders.
Requirements for this type of execution:
Flawless wave counting ability
No guessing on wave positions
Internal bar structure recognition
Precise entry timing
When you master this:
Trading becomes effortless. You're not predicting—you're reading structure and executing mechanically. All you need to control is risk through proper stop placement.
✅ Trade Outcome (So Far):
Status: Success - Risk-free position
What Happened:
Price broke below the internal Wave 4 structural bar within the Wave 5 swing. This created immediate downside momentum and allowed us to move the stop to break-even (risk-free).
Current Profit: +10 pips (and counting)
Current Risk: 0 pips (break-even stop)
👍 Boost if you want more reversal trade breakdowns
👤 Follow for advanced wave structure execution
💬 Can you count internal waves? Comment below

EURUSD Price Action Entry | Failure Setup After NewsI did an analysis on the EURUSD expectation just before the news. We saw the noise as expected, now we have been presented with a cleaner price action which presented us with a failure entry.
Failure Setup Criteria:
Break of the Previous High (LPH)
Lack of Follow-Through after the break
Bearish close below a Momentum Low (ML) bar
✅ Short trade triggered
This type of price action failure trade offers high-probability entries for traders who have the patience and discipline to wait for confirmation rather than chasing impulsive moves.
If you found this analysis helpful, hit the boost and follow for more forex market education and analysis

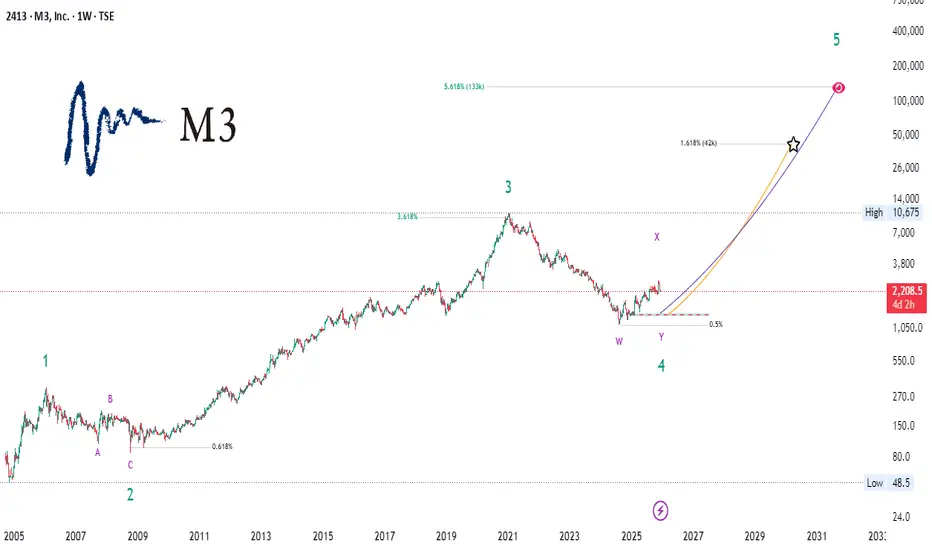
M3 (2413) — Wave 4 Completion and Long-Term StructureM3 (2413) — A Decade-Long Correction May Have Ended | The Architecture of a Potential Supercycle Wave 5
This study examines M3 (TSE:2413) through a deep-time structural lens, highlighting what may be the most technically significant inflection point in the stock’s modern history. By contextualizing the price evolution since 2005 within an Elliott Wave framework, this analysis aims to illuminate the broader architecture that could guide the next multi-year phase.
🔹 Why This Moment Matters
For nearly a decade, M3 has been navigating an extended W–X–Y corrective structure following its major Wave 3 peak. This was no ordinary pause—it was one of the longest and most complex retracements ever recorded in this symbol.
Despite its depth, the correction respected the higher-timeframe trend impeccably:
Termination at the 0.5–0.618 Fibonacci cluster
Structure consistent with a completed higher-degree Wave 4
Price stabilization occurring precisely where long-term cycles often reset
Such convergence across timeframes is rare and often meaningful.
🔹 A Framework for What Comes Next
If Wave 4 has indeed completed, M3 may be entering the foundational phase of Supercycle Wave 5 , historically the most structurally powerful leg in an established growth trend.
This chart outlines two macro trajectories:
Primary Path (Institutional Scenario)
A measured, sustainable advance toward the 1.618 Fibonacci extension , aligning with classical Wave 5 proportion and long-term market symmetry.
Extended Path (Innovation Cycle Scenario)
A more ambitious arc projecting into the 3.618–5.618 zone , reflecting behavior seen in past secular expansion phases—particularly in companies whose growth reaccelerates after prolonged consolidation.
Both paths are illustrated with curvature rather than straight-line projections to better represent the non-linear acceleration patterns commonly observed in late-cycle impulsive structures.
🔹 What the Chart Shows
The completed W–X–Y pattern marking the Wave 4 trough
A multi-year prior impulse (Wave 3) whose Fibonacci relationships remain intact
Historical highs and structural inflection zones for orientation
Two potential long-term trajectories, color-coded for clarity
A convergence of geometry, momentum stabilization, and structural completion—all aligning at the current price region
This confluence forms a compelling technical environment rarely seen on high-timeframe charts.
🔹 Strategic Perspective
This analysis does not make deterministic predictions.
Instead, it provides a macro-structural framework for institutions, portfolio strategists, and long-horizon investors seeking to understand where M3 may be positioned within its secular growth cycle.
Episodes of prolonged corrective unwinding often precede decisive shifts in trend character. If this framework proves correct, M3 may be transitioning from one of its largest consolidations into one of its most expansionary cycles.
🔹 Final Note
This chart is for educational and analytical purposes only.
It does not constitute financial advice.
If you found this useful, feel free to comment with your interpretation of the Wave 4 structure.
CADJPY – Update & ExecutionYesterday, our CADJPY position was stopped out at 111.65. The trend-changing pattern between Wave 3 and Wave 4 remains valid.
The wave that broke the Wave 3 structure extended beyond expectations, and price has now confirmed a breakdown with a second lower low on the M5 timeframe.
We have re-entered short at 111.94, with a stop loss at the high of the day (112.28).
Our target remains 110.92.

Gold — Liquidity Delivered Into WCL BreakerGold just tapped its higher-timeframe C target , completing the previous bullish cycle and leaving behind a clean WCL on the pullback. That WCL is now the boundary where the next phase should begin.
On the lower timeframes, price has been forming a controlled micro-bearish sequence. The important detail is that this micro-wave is delivering its C target directly into the 5-minute breaker block that's sitting inside the HTF WCL.
That combination is rare and powerful:
Liquidity has already been swept beneath the WCL
Momentum into the breaker is corrective, not impulsive
The breaker + WCL overlap is a classic launch zone
The next logical magnet is a revisit of the previous C
If Gold reacts from this breaker, the structure supports a full bullish wave back toward that C — and if C breaks, the matryoshka continuation opens.
I’m watching this zone as the potential ignition point for the next leg up.
This is not financial advice.

EURCAD | Liquidity Draw Toward HTF Order BlockPrice remains inside a higher-time-frame bullish structure and is now retracing into the 1.60–1.61 breaker block / BC correction zone — a logical refuel area before continuation.
Above, there’s an unmitigated HTF order block at 1.68–1.70 , likely the next draw on liquidity.
That zone should be mitigated before any true macro bearish shift.
Plan
Bias: short-term bullish continuation into 1.68–1.70
Entry: confirmation from the breaker around 1.60–1.61
Stop: below 1.576 (macro invalidation)
Target: 1.68–1.70 (HTF mitigation zone)
– After mitigation, watching for bearish structure to form
The correction still has business above — the HTF OB remains unmitigated.
Let’s see if EURCAD completes the move.

METISUSDT | Fractal BC–WCL ConfluencePrice is correcting into the 9.0–9.1 zone, where the yellow BC , pink WCL , and a clean breaker block all line up — strong confluence.
I’m expecting liquidity to sweep under the early reaction at the order block before reversing from the breaker.
Watching for confirmation inside that zone.
Stop : 8.745 (just below yellow B at 8.761 — structural invalidation)
Target : 10.10–10.40 (yellow C projection)
If price dips deeper first, it’s fine — that sweep would only strengthen the setup.
Below 8.761 , the whole idea’s off the table.

ASTER — OB Tap → WCL Retrace → Macro DownASTER is forming a clean ABC correction within a larger bearish structure. Price hasn’t yet tapped the order block — I expect a final dip to complete the C-leg before retracing toward the WCL zone. From there, the broader bearish wave should resume.
However, if Bitcoin continues its upward expansion, correlations could invalidate this structure and pull ASTER higher, overriding the current wave bias.
High-timeframe trend stays bearish, but intent always belongs to the present.
Strengths:
• Fractal alignment between macro and micro waves.
• Logical liquidity flow between OB and WCL.
• Flexible bias — corrective long, then macro short continuation.
Weaknesses:
• Requires precise OB tap and strong reaction.
• Bitcoin-driven expansion could neutralize bearish context.
• LTF volatility may distort confirmation signals.
SmellyTaz — decoding chaos

GBPUSD Price Action Analysis | Sell Setup Below 1.36106In this GBPUSD market overview, we break down recent price action following yesterday’s strong bullish rally from the momentum low. The session was highly emotional across major forex pairs, which is typical when a major wave structure reaches its end. This often results from incomplete auctions on one side of the market, causing order flow imbalances that drive sharp price movements.
The key price level we're watching on GBPUSD is 1.36326. Price approached this zone with momentum, and the rejection at 1.36267 triggered a classic TCP (Trend Changing Pattern), followed by a single upside break, confirming exhaustion at the highs.
📉 Sell Setup:
According to the Waves of Success execution model, the best short entry is below 1.36106, in alignment with the prevailing bearish structure.
⚠️ Alternative Scenario:
We are not looking for long setups on GBPUSD at this time — our bias remains bearish unless significant structure changes occur.
This analysis combines wave structure, trend confirmation patterns, and institutional price levels for a professional, risk-managed approach.
🔑 Key Levels:
Resistance: 1.36326
Rejection High: 1.36267
Sell Trigger: 1.36106

BTC Mid-Term Outlook: Key Levels & Wave StructureAs long as March lows hold, there remains a technical possibility for one more wave up toward the 130K resistance zone. However, given the corrective three-wave structure of the recovery (rather than an impulsive five-wave move), I am now leaning toward the mid-term top being in place at January highs.
If price remains below last week’s high, my operative scenario favors one more leg down to the 64K–55K–51K macro support zone. If the downside scenario unfolds, it would still be technically valid for the entire corrective wave (2) to complete within the support zone mentioned, especially considering the underlying fundamental strength of the asset.
Should price break above last week’s high in the coming weeks, the odds shift in favor of a renewed uptrend, potentially reclaiming ATH and targeting 130K.
The super-macro structure that I'm following as an operative wave count, assumes multi-decades bullish cycle, with the next long-term expansion phase expected once price establishes a firm bottom in the discussed support zone:
Wishing you successful trading & investing decisions. Thank you for your attention!
PS: The wave structure of BTC, proposed in March 2024 idea, has fulfilled itself:

GBPUSD Setup: Bullish Wave Structure & Fibonacci Buy ZoneThe GBPUSD has stabilised after a significant downward move. A completed bullish wave structure has emerged, with Wave 4 failing to break above Wave 3. This indicates a potential buying opportunity from the Fibonacci buy zone.
On the 15-minute chart, we can consider going long using the MSL pattern (Lower Low, Low of Day, Higher Low & Higher Close) as a confirmation signal.
Entry Point: 1.26303
Stop Loss: 1.2610
Target: 1.2710
Stay disciplined and manage your risk accordingly.

Intraday Analysis: CADJPY Forecast and Trade SetupThe overall trend on the major timeframes for CADJPY remains bullish, despite a breakdown continuation observed last week.
Current Market Overview:
The lower timeframe (M5) printed a bullish wave structure this morning.
We anticipate a corrective move below 105.76.
In the short term, a potential downside reversal is expected.
Trade Setup:
Look for shorting opportunities below 106.34, targeting a break below 105.77.
If price action breaks below 105.77, we can consider buying opportunities, aligning with the larger bullish trend.
Key Levels to Watch:
Sell Point : 106.34
Buy below : 105.77

WAVES: Massive 530% Gain at 10x LeverageTrade Overview:
WAVES surged to remarkable highs on the 4-hour timeframe. Utilizing the Risological Swing Trader , this long trade setup captured an extraordinary 530% gain at 10x leverage.
Key Levels:
Entry Price: $0.9990
Stop Loss (SL): $0.9565
Take Profit Targets:
TP1: $1.0520 ✅
TP2: $1.1375 ✅
TP3: $1.2230 ✅
TP4: $1.2755 ✅
WAVES/USDT Analysis:
The Risological Green Lines accurately depicted strong bullish momentum, allowing traders to trail the uptrend confidently. WAVES not only met all targets but exceeded expectations, reflecting robust market dynamics.
Outlook:
With such significant momentum, traders may keep monitoring WAVES for potential continuation patterns or retracements. This trade showcases the reliability of the Risological system for spotting high-profit opportunities.

Trends and Potential Trades in GBPUSD, EURUSD, and USDJPYThis morning's analysis focuses on the current state of play in GBPUSD, EURUSD, and USDJPY.
The overall trend for the USD remains downward, and this week has seen a continuation of that trend.
GBPUSD & EURUSD
In the short term, there is potential for a sell trade (Secondary Trend) as a retracement of the recent bull run towards the buy zone of the bullish wave.
USDJPY
We have observed a strong downward move to T1, and price action on the 15-minute chart suggests a potential buying opportunity after liquidity was grabbed at the low of the Tokyo session.
Buying USDJPY (Secondary Trend) is a possibility, as the wave structure 2 is approaching its low, with wave 3 correction expected to be the next phase.
Happy Trading!

GBPUSD- Trend Continuation setupSuccessful trading is knowing what to do and doing what you know. The knowing part is very simple but the doing part is not easy that is why most people struggle in trading.
This afternoon, during the New York session, my focus is on GBP/USD. We are buying based on the H4 timeframe, where the wave structure remains bullish since the price hasn’t closed below 1.30877.
Another confirmation comes from the H1, which has only shown three waves down so far. While a fifth wave may appear, it’s likely to be a higher low following the current upward move on the M15 chart.
As long as the M15 stays above the New York session opening range, we will continue buying.
Happy Trading!

GBP/JPY - Price is the leading IndicatorToday we are looking at GBP/JPY 5 Minutes timeframe.
Based on the price structure, we believe that the high probability direction in the short term is downtrend.
We have seen an ABC (Corrective) wave after the Low of Friday was made.
Key Structures to note:
Structure 4: 200.022 Downtrend continuation reversal point.
Structure 2: 200.674 Downtrend Violation Structure.
Always Think in Probability:
As traders, you must be careful to align your behavior and expectations with the following principles:
- Anything can happen
- An EDGE is only an indication of one thing happening over another
- There is a random distribution between wins and losses
- You don't need to know what will happen in order to make money in trading.

CAD/JPY Short Term SellBased on our weekly analysis yesterday, CADJPY is one of our Sell Pairs. We are trading the CAD/JPY for a short-term sell looking for a target below 113.30. Stop loss above 114.40.

GBPJPY Strong Reversal & GBPUSD UpdateThe Japanese Yen(D) is going through the B to C leg of its correction, which we saw in the yen pairs in the last 24 hours. The GBP/JPY is our pick for a long trade because it has a more technical-bullish outlook than most other yen pairs.
More info in the video.
GBP/USD
The cable broke higher yesterday above 1.2634 , the limit for any downtrend continuation. The violation of this point invalidated the expected downtrend continuation trade.
We must wait for the price to conclude the current rally before we can act on a new position in the cable.

Forex Weekly Trade planning sessionPlan your trades and trade your plans. Today we have the following rankings on the indexes:
@DXY ++VE
@EXY -VE
@AXY --VE
@SXY ++VE
@JXY --VE
@BXY --VE
@CXY --VE
@ZXY --VE
Based on the above rankings, we came up with the following pairings.
BUY PAIRS: USDJPY, USDCAD, CHFJPY,
SELL PAIRS: AUDUSD,GBPUSD,NZDUSD,GBPCHF,AUDCHF
The idea is to trade in the direction of the wave structure as long as the structure is not disturbed or violated, your high probability trade is to trade in the direction of the trend after a secondary trend (Pullback).
Important trend change facts you must know:
A trend will not change easily, it takes a great deal of time and effort for a trend to change.
The time required for a trend to change is very relevant to how long the ongoing trend has been in play.
The duration of a trend change will be greater than half of the period of the changing trend. Sometimes it is equal to the time the trend has been ongoing.

Trend Continuation - CADJPY Wave STructure AnalysisHey Traders,
This is my take on the CADJPY Looking at the 1HR and the 15 Mins timeframes.
Momentum precedes prices! When there's an ongoing primary trend and a completed wave structure, wait for the price to be discounted/pullback.
This discounting in price gives us a piece of important information, we can deduce whether the price will continue the primary trend or the trend will change in the opposite direction. The only tool that gives us this information is the price by counting the wave structure.
As long as the primary trend structural point is intact, the trend is intact and we can trade safely in harmony with the market.
This is not theory, it is practical, but the application is psychological.
CADJPY SHORT KEY LEVELS
Stop Loss:114.88
Target 1: 112.18
Target 2: 110.59

Forex Weekly Planning Session 28 Apr, 2024Plan your trades and trade your plan. The weekly planning session is one of the most important things you can do as a trader.
In this session, I analysed the Currency Index basket of the USD, EUR, GBP, CAD, CHF, AUD, NZD, and JPY.
The strength lies with the USD, the rest are still in a confirmed downtrend.
