Ethereum(ETH) - Macro Outlook by FIBCOS🔍 Ethereum - Macro Outlook by FIBCOS 🧠
“From Contraction to Expansion – The Supercycle Awakens”
🌌 Super Market Cycle: The Final Push Begins
Ethereum is in the final stage of a Grand Supercycle 🌍 — a massive multi-year wave count aligning with the Elliott Wave Theory .
✅ Wave (1) and (2) established early strength
✅ Wave (3) peaked explosively in 2021 📈
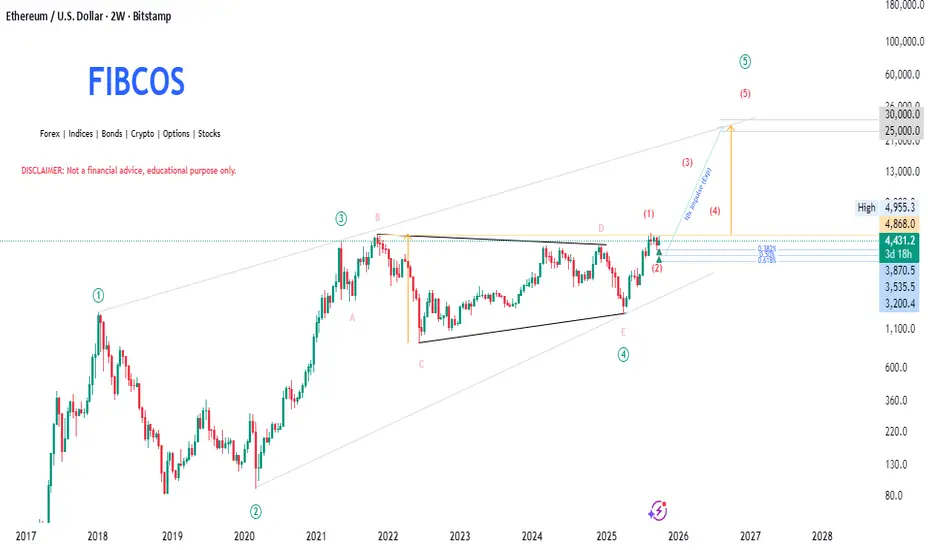
✅ Wave (4) formed a beautiful contracting triangle (ABCDE) , a classic wave 4 corrective pattern
🟢 Now breaking out of Wave (4), we're entering Wave (5) — the euphoric leg 🚀
🌊 Wave Theory Magic: Riding the Impulse
We're deep into the impulsive sequence — and here's what stands out:
1️⃣ Wave (1) initiated the reversal from the triangle bottom
2️⃣ Wave (2) retraced perfectly to key Fib levels — golden pocket zone ✨
3️⃣ Current move is Wave (3) of (5) — historically the most powerful and extended wave 💥
🔮 Wave (5) targets extend toward $25,000–$30,000 based on Fibonacci projections 🧭
📐 Fibonacci Retracement & Extension: Precision Tools
After Wave (1), ETH retraced to the following golden zones:
🔵 0.382 – $3,870
🟣 0.50 – $3,535
🟢 0.618 – $3,200
These levels acted as strong demand zones 🛡️, where price was absorbed and reversed, showing institutional interest.
📈 For extensions:
Wave (3) targets: ~$15,000 (1.618 extension)
Wave (5) projection: $25K–$30K 🎯
🧠 Smart Money Concept (SMC): Liquidity Engineered Setup
SMC confirms the big players have already positioned:
🪤 ABCDE triangle = liquidity trap
🔥 Wave E = final sweep before the breakout
✅ Structure Break = Smart Money entry signal
🧱 Demand Zone @ ~$3,800–$4,200 = institutional orders filling 🏦
The Change of Character (ChoCH) + Break of Structure (BoS) = textbook confirmation of bullish intent 📚
🧱 Market Structure: From Consolidation to Expansion
We’ve broken multi-year resistance 💥
🔁 Previous All-Time High (ATH) now acting as strong support
📈 Higher highs and higher lows = full bullish market structure
🚀 Confirmed trend shift after accumulation → expansion phase
🔎 Price Action: Clean, Convincing, Bullish
The breakout candle is powerful:
✅ Big-bodied green candles
✅ Little-to-no upper wick = aggressive buyers in control 🐂
✅ Imbalance created below — potential “buy-the-dip” zones between $3,800–$4,200 📉🛒
ETH is now printing strength with every candle — the market is speaking clearly.
🌍 Macro-Fundamental Context – Ethereum’s Underlying Strengths
Ethereum’s fundamentals provide strong structural support for this technical forecast:
ETH ETF Approvals (Pending):
U.S. and global ETF prospects are building momentum, opening gates to institutional inflows akin to Bitcoin's ETF impact.
Layer-2 Scaling Adoption:
Networks like Arbitrum, Optimism, and zkSync are maturing rapidly, improving transaction efficiency and reducing on-chain congestion.
Ethereum 2.0 Transition/PoS Era:
Ongoing deflationary tokenomics (EIP-1559 burn + staking lock-up) are reducing effective circulating supply, supporting price growth.
DeFi Revival:
With macro liquidity cycles turning upward, usage and TVL (Total Value Locked) in Ethereum-based DeFi is expected to rise sharply.
AI x Blockchain Synergy:
Ethereum remains positioned to become the base layer for decentralized AI infrastructure — a potential catalyst for long-term valuation expansion.
These catalysts serve as the fundamental “fuel” behind the unfolding Wave (3) and the eventual Wave (5) .
🎯 Final Word: All Systems GO 🚀
The confluence is undeniable:
✅ Super Cycle 🔁
✅ Elliott Wave 📊
✅ SMC Smart Money 📈
✅ Price Action 🔍
✅ Market Structure 🏗️
✅ Fibonacci Levels 📏
✅ Fundamentals 🌍
💡 Ethereum is positioned to explode into its Wave (5) super-cycle with $30,000 as a potential macro target.
If you're looking for the high time frame narrative , this is as strong as it gets . Don’t chase. Plan the entry on retracements and ride the wave 🌊.
💬 "Structure unlocks direction, and Fibonacci refines destination." – FIBCOS
📘 Disclaimer: This is a structural, educational market outlook. Not financial advice. Please do your own due diligence and risk management.
#FIBCOS #ElliottWave #SmartMoneyConcept #MarketAnalysis #Gold #XAUUSD #ElliottWave #WaveTheory #SuperCycle #MacroTrend #SmartMoney #Fibonacci #PriceAction #Commodities #TechnicalAnalysis #LongTermOutlook
Wavetheory
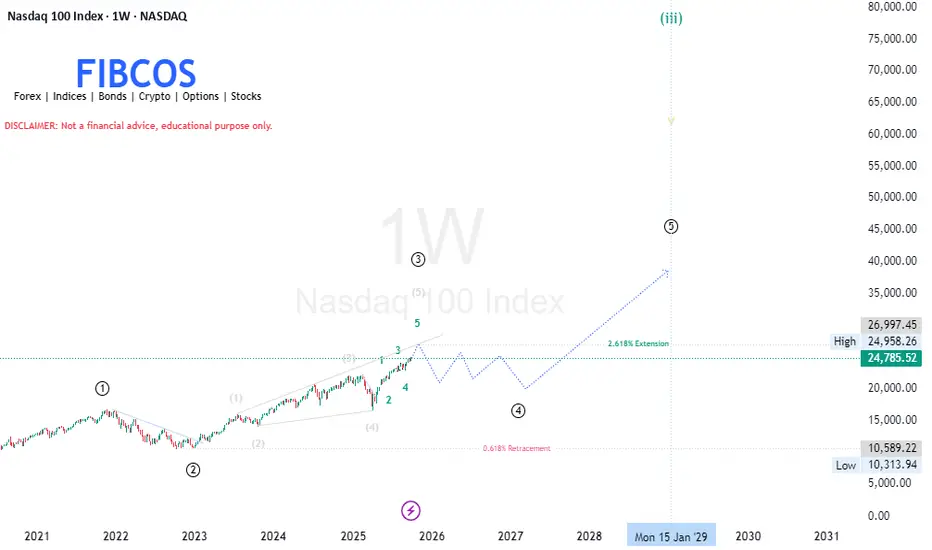
NASDAQ 100 (1W) – Elliott Wave + Smart Money Analysis by FIBCOSThe index (NASDAQ) continues its macro impulsive structure, now expanding through Wave (3) — targeting the 2.618 Fibonacci extension near 26,997( 27K ).
Smart Money is driving this leg with clear bullish order flow, creating multiple Fair Value Gaps and Breaks of Structure along the way.
After this expansion, we expect a Wave (4) correction between 22,000–17,500, where institutional demand zones await for re-accumulation before the next macro bullish leg (Wave 5) toward 35,000–38,000.
📊 Confluence Highlights:
Wave (3) → 2.618 extension (target zone: 26.9K–27K)
Wave (4) → 0.382–0.618 retracement (zone: 22K–18K)
Wave (5) → 1.618 projection (target zone: 35K–38K)
🧠 Elliott Wave Theory Interpretation
① Wave (1) — The Initial Expansion (2020–2021)
Early bullish impulse following pandemic recovery.
Represents Smart Money accumulation followed by a breakout.
Retail participation remains limited; institutional footprints dominate.
② Wave (2) — Corrective Pullback (2022–2023)
Sharp decline toward the 0.618 Fibonacci retracement zone.
This phase was a liquidity grab — Smart Money re-entering after shaking out weak hands.
Price formed a higher low , maintaining long-term bullish structure.
③ Wave (3) — The Power Leg (2023–2026)
The strongest and most extended wave — aligned perfectly with the 2.618 Fibonacci extension (~26,997 zone).
Confirms institutional markup phase , where:
Retail short sellers are trapped.
Fair Value Gaps (FVGs) are created during impulsive moves.
Continuous Break of Structure (BOS) validates bullish order flow.
Smaller degree sub-waves (1–5) visible inside, confirming internal impulse rhythm.
④ Wave (4) — The Upcoming Correction (2026–2027)
Expected macro re-accumulation zone , likely between 22,000 – 17,500 .
Market may enter a sideways complex correction (W–X–Y)/(W-X-Y-X-Z) pattern.
This is the Smart Money re-accumulation phase — liquidity collection before the next macro expansion.
Demand zones: previous unmitigated order blocks around 20,000–18,000 area.
⑤ Wave (5) — The Final Expansion (2028–2029)
After consolidation, the index may aim for new all-time highs toward 35,000–38,000 range.
This represents a distribution phase , where Smart Money offloads positions near cycle tops.
Expect divergence in momentum indicators , hinting at the end of the 5-wave structure.
---
💡 Smart Money Concept (SMC) Confluence
Concept | Observation | Implication
Liquidity Sweep - Below 2022–2023 lows (Smart Money accumulation confirmation)
Order Blocks - 22,000–18,000 zone {Institutional demand zone for Wave (4)}
Fair Value Gaps (FVGs) During Wave (3) impulsive rise {Will likely get mitigated during Wave (4)}
Break of Structure (BOS ) Continuous bullish BOS confirms institutional intent
Premium/Discount Zones Current price at premium (above equilibrium) Ideal region for institutional profit-taking
🧭 Smart Money Flow:
Accumulation → Expansion → Re-accumulation → Final Distribution
---
📐 Fibonacci Confluence Levels
Wave (3) → 2.618× extension of Wave (1–2) → ~26,997 (expected macro resistance).
Wave (4) → retracement likely between 0.382–0.618 → 22,000–17,500 zone.
Wave (5) → projected 1.618× of Wave (1–3) → 35,000–38,000 .
---
🧭 Market Outlook Summary
Timeframe | Bias | Expectation
Short-Term (2025–2026) 📈 Bullish Continuation toward 26,900–27,000
Medium-Term (2026–2027) ⚠ Corrective Re-accumulation phase, smart money reloads
Long-Term (2028–2029) 🚀 Bullish Wave (5) macro expansion toward 35K–38K
---
🔖 FIBCOS Summary
> NASDAQ 100 Weekly Chart (Elliott + SMC)
Currently expanding through a powerful Wave (3) toward the 2.618 Fibonacci extension (~27K).
After completion, a macro correction (Wave 4) is expected, providing the next Smart Money accumulation zone between 22K–18K before the final Wave 5 expansion toward new highs beyond 35K.
📘 Disclaimer: Not financial advice. Educational purpose only.
#FIBCOS #NASDAQ100 #ElliottWave #SmartMoneyConcept #MarketAnalysis #MarketCycle #Fibonacci
Hellena | Oil (4H): SHORT to support area of 60 (Wave 3).The price is still not reaching the target of 60. I decided to make a new forecast, slightly changing the labeling of waves, or rather their importance.
At this stage, as before, I think that the price will reach the area of the level 60 in the middle wave “3”.
This movement is the development of the big corrective wave “C”. In general, the plan remains the same.
Manage your capital correctly and competently! Only enter trades based on reliable patterns!

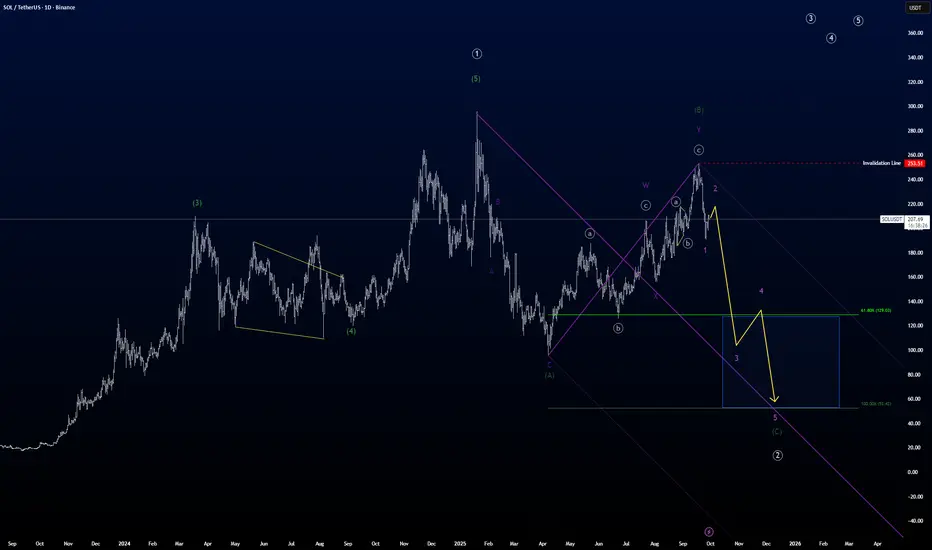
SOL is messy but is going through a correction.SOLs last move up in white primary ((1)) was not as large compared to the move up prior to that, which we can't see on the picture. So I guess we still have a large 3rd of a 3rd to come in a move up.
But first we still need to finish this correction SOL is in right now.
I believe SOL is doing a flat correction in a primary degree, so it takes some time to get through.
It looks like the green (B) wave is finally done, and now we just need the green intermediate (C) to finish. The 1st wave of that c-wave is almost over if not already, so anticipate a correction up in purple 2nd wave.
When that 2nd wave is done, SOL will move into a strong move down in wave purple 3 following the yellow path.
double (()) indicates circle on chart.
Hellena | GOLD (4H): LONG to support area of 3800.Dear colleagues, the last forecast is canceled, but I recommended that trades should be set trades to breakeven because there is a high probability of wave “3” extension.
It looks like the upward impulse is still not over and I expect the final formation of wave “5” to the 3800 area. Yes - this target is quite close, but now it makes no sense to make a long forecast with a correction in wave “2” of higher order (red).
As soon as I get confirmation that the correction in wave “2” has started - I will make a forecast with more points.
Manage your capital correctly and competently! Only enter trades based on reliable patterns!

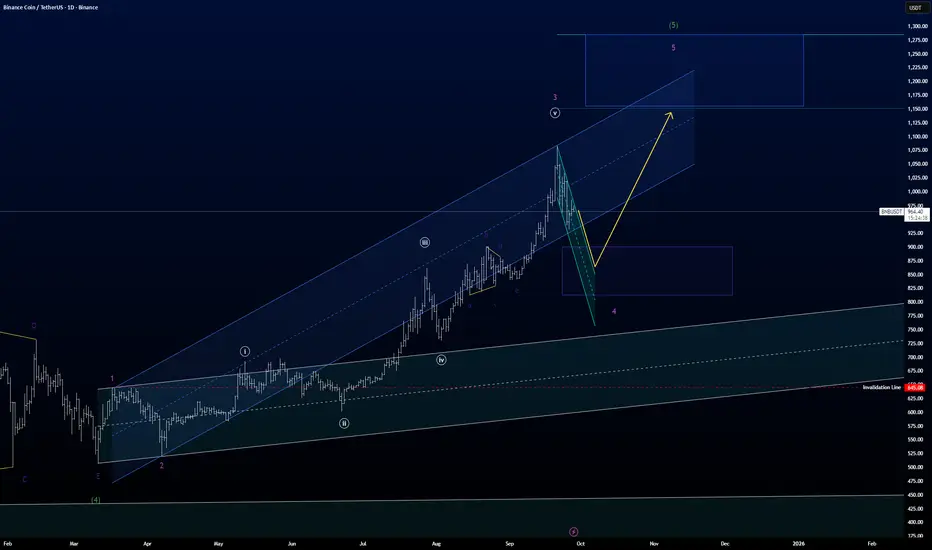
BNB does not completely obey, what BTC commands..In a count I did yesterday I wrote about BTC has started the decent, but from what I can see here, I still believe BNB need a little push up before going into a correction of a higher degree.
Right now BNB is in what I count to be purple wave 4.
And there is a chance purple wave 4 has already finished, and we therefor have started the move up in purple wave 5.
One of the guidelines in Kennedy channeling technique, which is a powerful tool in counting Elliott Waves, is that price has not completed wave 4 before tagging the bottom of the acceleration channel. (the blue channel).
Another guideline in Elliott Wave is that wave 4 often retraces down into wave 4 of the previous lower degree. (This area I have marked in the Purple box)
Therefor we could have a little downside left before starting the purple wave 5.
Being optimistic purple wave 4 is done, since I can count an simple zig-zig correction.
A confirmation of wave 4 is done and the purple wave 5 has started, is to wait for price to break the deceleration channel. (the green channel.)
But in either case, I believe BNB still has a wave 5 to finish before the correction down in a higher degree.
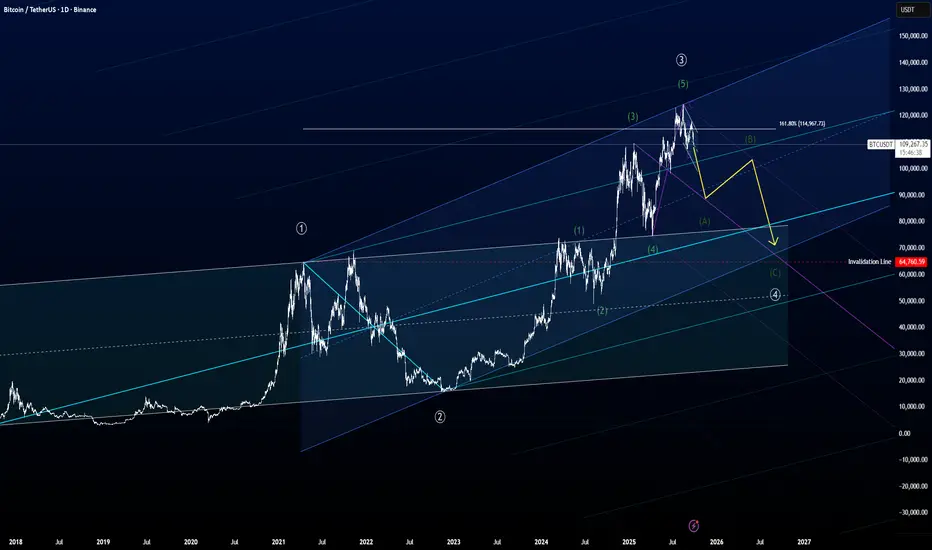
BTC has started going down the slope..I can easy count 5 green intermediate waves up.
Last top was just above the 161,8% fib level of primary white ((1)).
It's outside of the pitchfork, it's outside of the white base channel indicating the primary white 3 was underway.
By having a good 5 wave structure in the last wave up, I believe this is the intermediate green 5 wave done, and hereby primary white 4 has started.
How low can it go? By a rule from Elliott, wave 4 cannot enter the territory of wave 1, so this would mean the absolut low of wave 4 would be at the 64,760 level.
After we had, what I counted as a primary white wave 2 formed as a flat, it will be fair to presume we will have a relative quick primary white wave 4, because of the guideline of alternation. Also as a guideline we can lean to a Kennedy Channeling Technique, which states that wave 4 is usually not done before touching the bottom of the acceleration channel, which I have colored in blue.
The simplest path of wave 4 would be a zig-zag, which I have drawn in yellow. And I anticipate the first wave down, intermediate green A, not to end before around $90.000, then we will have a intermediate green B, then intermediate green C.
A choice could very well be that it will form as a triangle, because so many still believe the surge of BTC never stops. But still my anticipation of intermediate green wave A will be around the $90.000 level.
This is the most optimistic count I feel I could do on BTC. Another, but not as likely, count could be that we already have seen the wave 5, and then there is no absolute bottom other than 0.
Because this would mean we have seen the top of wave 1 of a higher degree, and wave 2 can retrace all the way back to the start of wave 1 without invalidating anything.
But this pessimistic count is not my preferred count at the moment.
Hellena | EUR/USD (4H): LONG to the resistance area 1.18935.We did pretty well last week and I was waiting for the correction to show us its movement in wave “4”. Now I believe that the correction is coming to an end and I expect the upward movement to continue in wave “5”.
I think that we will target the resistance area at 1.18935.
Fundamentals:
Euro is supported by stable inflation in the Euro area at 2.0% YoY in August, while in Germany it ticked slightly higher to 2.2%. Meanwhile, the U.S. Dollar Index (DXY) trades around 97.77, showing that dollar pressure hasn’t intensified.
Manage your capital correctly and competently! Only enter trades based on reliable patterns!

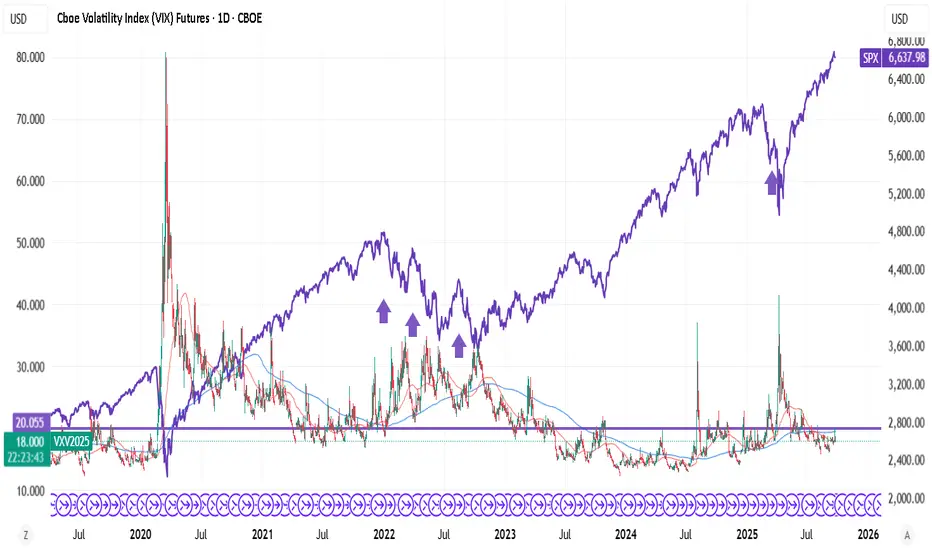
VIX FUT trending above 20 - high probability SPX crash indicatorVIX never trends above 20. You lose money buying VIX FUT above 20.
In nutshell, VIX FUT supporting at 20 is a guaranteed crash - for low risk positions.
Hellena | SPX500 (4H): LONG to resistance area of 6700.Colleagues, I think we should expect the upward movement to continue. The upward impulse is not over yet, but I think we may see a correction to the 6500 area, then I expect the upward movement to continue to the 6700 area, which is a pretty strong psychological level and is the area of 50% levels of Fibonacci extension.
Manage your capital correctly and competently! Only enter trades based on reliable patterns!

Understanding Elliott Wave Analysis: A Daily Outlook ExampleHello Friends, Welcome to RK_Chaarts!
Today we're going to explore Elliott Wave Analysis using a daily outlook example of Lloyds Enterprises Ltd Chart. Please note that this is for educational purposes only.
Important Disclaimer:
- This analysis is not trading advice.
- I am not a SEBI-registered analyst.
- Please consult your financial advisor before trading or investing.
Understanding Elliott Wave Analysis
In this educational guide, we'll walk through a daily outlook analysis using Elliott Wave theory. Our goal is to identify potential price movements and understand the underlying wave structure.
Current Market Analysis
We are currently analyzing a daily chart, and our analysis suggests:
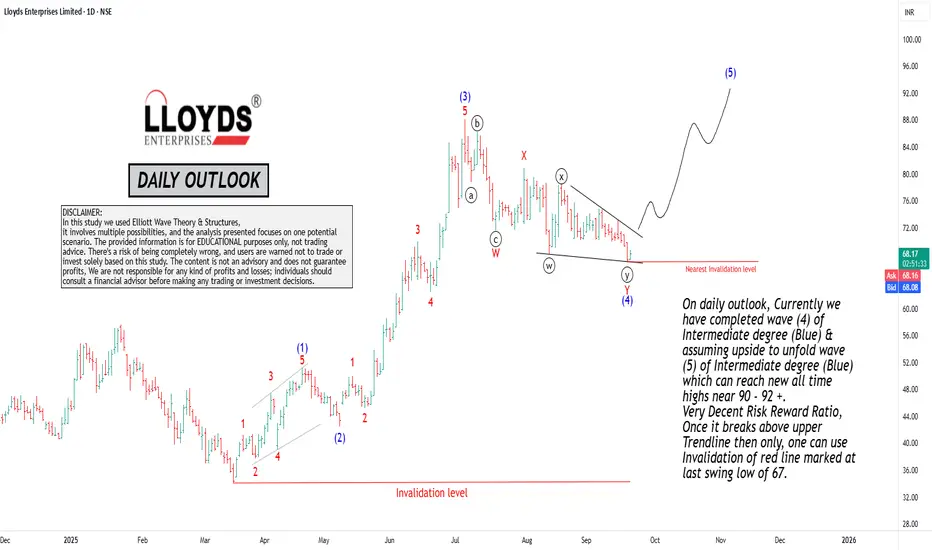
- We have completed wave (4) of Intermediate degree (blue).
- We assume an upside movement will unfold, forming wave (5) of Intermediate degree (blue).
- This wave (5) has the potential to reach new all-time highs near 90-92+.
Risk-Reward Ratio
Our analysis indicates a very decent risk-reward ratio. This means that the potential upside movement is substantial compared to the potential downside risk.
Trade Setup
To validate our trade setup, we are watching for a break above the upper trendline. Once this break occurs, we can consider using the invalidation level marked at the last swing low of 67.
Key Takeaways:
1. Elliott Wave Structure: Understand the current wave structure, including the completed wave (4) and the anticipated wave (5).
2. Potential Price Movement: Recognize the potential for wave (5) to reach new all-time highs.
3. Risk-Reward Ratio: Acknowledge the decent risk-reward ratio, which supports the trade setup.
4. Trade Validation: Wait for a break above the upper trendline to validate the trade setup.
By applying Elliott Wave analysis and understanding the underlying wave structure, traders can make more informed decisions and identify potential trading opportunities.
Remember:
Most investors treat trading as a hobby because they have a full-time job doing something else. However, if you treat trading like a business, it will pay you like a business. If you treat it like a hobby, hobbies don't pay, they cost you!
Hope this post is helpful to the community!
Thanks,
RK
Disclaimer and Risk Warning:
The analysis and discussion provided on in.tradingview.com are intended for educational purposes only and should not be relied upon for trading decisions. RK_Chaarts is not an investment adviser, and the information provided here should not be taken as professional investment advice. Before buying or selling any investments, securities, or precious metals, it is recommended that you conduct your own due diligence. RK_Chaarts does not share in your profits and will not take responsibility for any losses you may incur. So please consult your financial advisor before trading or investing.
Anticipation of GC / Gold over the next couple of weeks.For those who might have interest in a Elliott reading on gold:
In this post, everytime I write gold, I mean GC. This is just for info, since GC and gold doesn't have same prices, but the movement is very much the same.
If you follow along on a gold spot or similar, just translate the levels to there.
The picture is very messy for those who doesn't know what the lines and numbers are for, but please follow along.
I have a strong believe that with current PA the 3rd (white iii) wave is over, and now we will look for price to search for the bottom of the blue channel.
The blue channel is an acceleration channel, which is used to see if 4th (white iv) wave is under way. When the 4th (white iv) has developed some more, we are able to put another channel on, called the deceleration channel. This we will use to spot the end of the 4th (white iv).
Until now, it seems gold is respect the white 161 fib level, which is a very typical 3rd wave level to end.
The reason I started this post, was to tell you about my thoughts on when the 4th (white iv) is going to end, or at least how long it's going to be.
A typical scenario is that wave 4 is longer in duration than wave 2. For ease of spotting, I have put up these purple boxes, so now we do not anticipate gold to end the correction, before it has exited the purple box to the right.
The depth of wave 4 (white iv): I believe we are going to see prices in the level between 3600 and 3550 (the green box).
Reasons for the levels of the green box: when prices wave 2 (white ii) goes beyound the 61.8 fib level (in this case below), we tend to see a retracement between 38% and 50% in the 4th (white iv). And this is the area the green box indicates.
Timewise it is places outside of the previously mentioned purple box.
4th wave also tends to respect the base channel . Either the upper line or the middle line.
The lower line of the blue channel and the middle of the grey channel ( base channel ), the green box, outside of the purple box is all seeming to fall in the same place. So I like all the confluences falling together here, so that's why I feel pretty certain that, that is where the white iv wave is likely to end.
Timewise it'll be about 1st of october.
The white v wave i have also done a forecast on that fits if wave white iv retrace to the green box.
Normally the 5th wave is going to end in the area between 38% and 61% of the wave 1 and 3. This level is indicated with the blue fib.
Usually wave 5 is equal to wave 3. But can be extended if wave three isn't. Have indicated the 100% fib of white i wave with the cyan fib.
This 100% level falls between the blue fib, right around the yellow line I have talked a lot about before in previous post. So I also have a lot of confluences for price to go here in the white v wave.
If the white v is extended it could go to the blue 100% level, which also is confluenced with that cyan upgoing line. This is a pitchfork drawn from previous waves.
let's see where gold will take us.

Hellena | GOLD (4H): SHORT to support area of 3558.Colleagues, gold is in an active upward impulse of big wave “1” and if until now I was only talking about long positions, now it is time to think about the correction in wave “2”.
Wave “1” (red) consists of five waves and, to all appearances, wave “5” (blue) has either completed or is about to complete.
This means that I expect a corrective movement to the 3558 support area. I believe that this is the minimum retracement level, and the price may reach lower values, but we will work for the result, which we will achieve soon.
Manage your capital correctly and competently! Only enter trades based on reliable patterns!

Wave 3 Dynamics: Understanding the Most Powerful WaveHello Friends, Welcome to RK_Chaarts,
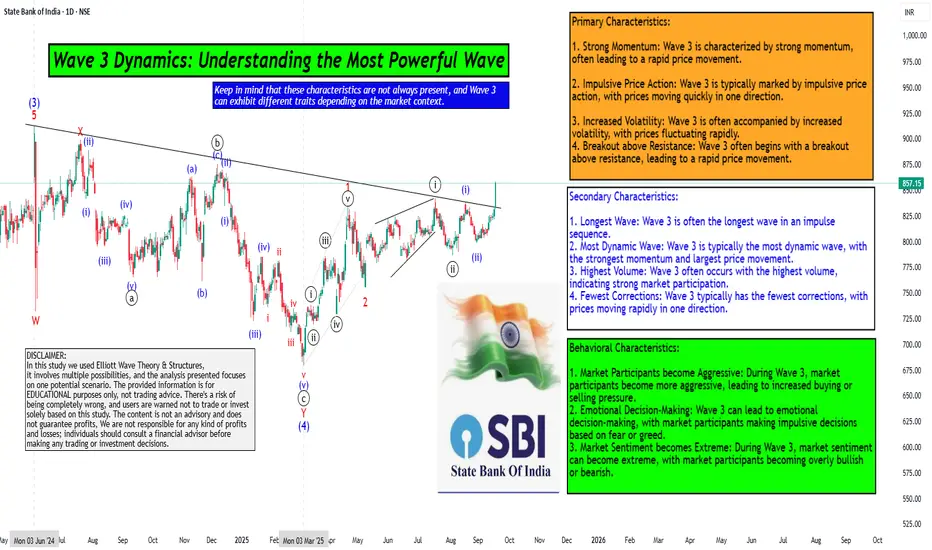
For Learning and Practicing chart Analyzing, Today we are trying to Analyse the State Bank of India (SBIN) chart from an Elliott Wave perspective, we can see that the intermediate-degree Wave (3) completed at the June 2024 high. This was followed by a complex correction that ended at the March 2025 low, marking the completion of Wave (4).
We are currently unfolding Wave (5), which will complete the higher-degree Wave ((3)) of Primary degree in black. Within Wave (5), we have five minor-degree subdivisions, which we can see unfolding.
The first minor-degree Wave 1 completed at the 22nd April 2025 high, followed by a Wave 2 correction that ended at the May 9, 2025 low. We are currently in Wave 3, which is a dynamic wave with strong momentum.
Within Wave 3, we have five minute-degree subdivisions, which are unfolding. The first two subdivisions are complete, and we are currently in the third subdivision.
The characteristics of Wave ((iii)) of 3 are evident in the price action, with a strong breakout above the resistance trend line and good intensity of volumes. The Moving Convergence Divergence (MACD) is also positive, and the Relative Strength Index (RSI) is above 60, indicating strong momentum.
The daily Exponential moving averages (50 and 200) are also aligned in favor of the trend. All these parameters support our view, and we can see an inverted head-and-shoulders pattern or a double rounding bottom pattern unfolding.
Overall, the breakout looks promising, and we can expect further upside in SBIN as per Elliott wave theory.
Detailed wave counts on chart
Primary Characteristics:
1. Strong Momentum: Wave 3 is characterized by strong momentum, often leading to a rapid price movement.
2. Impulsive Price Action: Wave 3 is typically marked by impulsive price action, with prices moving quickly in one direction.
3. Increased Volatility: Wave 3 is often accompanied by increased volatility, with prices fluctuating rapidly.
4. Breakout above Resistance: Wave 3 often begins with a breakout above resistance, leading to a rapid price movement.
Secondary Characteristics:
1. Longest Wave: Wave 3 is often the longest wave in an impulse sequence.
2. Most Dynamic Wave: Wave 3 is typically the most dynamic wave, with the strongest momentum and largest price movement.
3. Highest Volume: Wave 3 often occurs with the highest volume, indicating strong market participation.
4. Fewest Corrections: Wave 3 typically has the fewest corrections, with prices moving rapidly in one direction.
Behavioral Characteristics:
1. Market Participants become Aggressive: During Wave 3, market participants become more aggressive, leading to increased buying or selling pressure.
2. Emotional Decision-Making: Wave 3 can lead to emotional decision-making, with market participants making impulsive decisions based on fear or greed.
3. Market Sentiment becomes Extreme: During Wave 3, market sentiment can become extreme, with market participants becoming overly bullish or bearish.
Keep in mind that these characteristics are not always present, and Wave 3 can exhibit different traits depending on the market context.
Here are some snapshots shared below to understand the concept & example
Largest wave among wave 1-3-5
Strong Momentum like 90 degree move, Vertical move, Rapid move & Dynamic move
Breakout with good volumes
Price trading above 50, 100 & 200 Day Exponential Moving Average
RSI Breakout on Daily
RSI Breakout on Weekly
MACD weekly
MACD Daily
Pattern Repeating
I am not Sebi registered analyst. My studies are for educational purpose only.
Please Consult your financial advisor before trading or investing.
I am not responsible for any kinds of your profits and your losses.
Most investors treat trading as a hobby because they have a full-time job doing something else.
However, If you treat trading like a business, it will pay you like a business.
If you treat like a hobby, hobbies don't pay, they cost you...!
Hope this post is helpful to community
Thanks
RK💕
Disclaimer and Risk Warning.
The analysis and discussion provided on in.tradingview.com is intended for educational purposes only and should not be relied upon for trading decisions. RK_Chaarts is not an investment adviser and the information provided here should not be taken as professional investment advice. Before buying or selling any investments, securities, or precious metals, it is recommended that you conduct your own due diligence. RK_Chaarts does not share in your profits and will not take responsibility for any losses you may incur. So Please Consult your financial advisor before trading or investing.
Hellena | EUR/USD (4H): LONG to the resistance area 1.18500.Dear colleagues, the upward movement is not over yet and I think wave “3” is not over yet.
At this stage, I believe that the correction has already taken place or will soon end in the support area of 1.16573, then I expect the upward movement to continue to the resistance area of 1.18500.
This is a pretty strong area, as this is where the high of the big wave “3” (Red) is located.
Manage your capital correctly and competently! Only enter trades based on reliable patterns!

Hellena | SPX500 (4H): LONG to resistance area of 6600.Colleagues, the main idea is still the upward movement in the impulse of the middle wave “5”.
Wave “4” is likely to take place, because the bulls need to gain strength to update the local maximum of 6512.
The most important thing here is that the target of 6600 is a round number, which is quite attractive for buyers and limit sellers.
Manage your capital correctly and competently! Only enter trades based on reliable patterns!

EUR/USD 4H | Retest of Breakout Zone – Next Leg Higher?Market Structure:
EUR/USD has finally broken above its multi-week descending trendline and is now retesting the breakout zone. Price action has compressed into the 1.1680–1.1700 range, aligning with key technical factors.
Technical Confluence:
✔️ Fibonacci Retracement: Price sits at the 0.5–0.618 retracement (“golden pocket”) of the latest swing.
✔️ Moving Averages: 50 EMA and 200 EMA cluster at current support.
✔️ Trendline Retest: Old resistance flipped into potential new support.
✔️ Structure: Higher-low formation holding above 1.1640.
⚡ Key Levels to Watch:
Support / Buy Zone: 1.1680–1.1700
Invalidation (Stop-Loss Idea): Below 1.16080
Resistance / Targets:
TP1 → 1.1780 (previous high)
TP2 → 1.1825 (-0.27 Fib extension)
TP3 → 1.1885 (-0.618 Fib extension)
📌 Trade Idea:
(Swing Long Bias)
Entry Zone: 1.1680–1.1700
Stop: Below 1.16080
Targets: 1.1780 → 1.1825 → 1.1885
Risk/Reward: ~1:1.5 to 1:2.25
🧠 Bias:
Holding above 1.1690 = bullish continuation favored.
Losing 1.1680 could expose 1.1608, and deeper to 1.1485 monthly support.
🔮 Outlook:
The EUR/USD breakout + retest setup aligns fibs, EMAs, and structure into a strong confluence zone. If bulls hold this level, expect continuation toward 1.1825 → 1.1885 in the coming sessions.
What do you think traders does EUR/USD hold this breakout, or will sellers drag it back below 1.17?
#EURUSD #Forex #SwingTrading #PriceAction #Fibonacci #Breakout
@WrightWayInvestments
@WrightWayInvestments
@WrightWayInvestments

Elliott Wave Analysis: Balkrishna Industries LimitedHello friends,
Welcome to RK_Chaarts,
We're analyzing the chart of Balkrishna Industries Limited from the perspective of Elliott Waves.
Here's what we've observed: we've completed Primary Degree Wave ((3)) in Black at the peak of August 2024. Following that, we've witnessed a complete bearish and sideways movement, culminating in the low of April 7, 2025, which marks the end of Primary Degree Wave ((4)) in Black.
We've now initiated Wave ((5)) in Black, which should unfold as five Intermediate Degree subdivisions (1) to (5) in Blue. Furthermore, within Wave (1), we should see 1,2,3,4,& 5 Minor Degree subdivisions in Red. As we can see, we've marked Red Wave 1 as complete, and Red Wave 2 is almost complete.
According to Elliott Wave Theory, Wave 2 has retraced less than 100% of Wave 1, which is a valid point. Our invalidation level will be the low of Wave ((4)) in Black at 2150.
Since April 7, the price has made an impulsive move upwards, forming a high on May 9, 2025. We've labeled this as Minor Degree Wave 1 (in red). Within Wave 1, we've identified a lower degree, Minute Degree (in black), with subdivisions ((i))-((ii))-((iii))-((iv)) & ((v)).
Following Wave 1, a corrective move has unfolded in a 3-3-5 structure, specifically a flat correction. We've labeled this as Wave 2. If the price doesn't break below the low of Wave ((4)) (2150), and instead forms a higher high, it will increase the likelihood that our wave count is correct. However, if the price makes a lower low, it will introduce a doubtful scenario.
We've observed that Primary Degree Wave ((3)) in Black, which we identified at the top, has led to a corrective fall in Wave ((4)) in Black. Within Wave ((4)), we've labeled an Intermediate Degree (W)(X)(Y) correction (in blue) with subdivisions. This can be classified as a Double Three pattern.
Furthermore, within the (W) correction, we've identified another Minor Degree WXY pattern, and within the (X) wave, another WXY pattern. The (Y) wave has an ABC minor pattern. Additionally, we've noticed a slanting resistance trend line, which has been broken with the arrival of Wave 1.
Given the significant decline in price, market sentiments have likely contributed to the unfolding corrective structure. If the price forms a higher high, it will increase the likelihood that our potential Elliott Wave count is correct.
Elliott Wave analysis is always like solving a puzzle, requiring us to unfold the structure and make educated guesses about the emerging pattern. If the price breaks below the Wave ((4)) low 2150, our wave count will likely change. Until the price remains above this invalidation level, we'll continue to follow this wave count. If the price crosses the Wave 1 high, we'll have full confidence in this wave count.
In this study, we've applied Elliott wave theoretical structures to identify a potential scenario. However, markets can be unpredictable and may surprise us at any time, leading to new scenarios emerging.
The information, chart, and study shared in this post are solely for educational purposes. Our goal is to demonstrate how we plot market movements and make informed forecasting about future trends using Elliott Wave theory. If our predictions prove accurate, we can refine our wave counts accordingly. Conversely, if our predictions are incorrect, we will need to adjust our wave counts.
Please note that this analysis is not investment advice, and you should always consult with a financial expert before making any investment decisions.
I am not Sebi registered analyst. My studies are for educational purpose only.
Please Consult your financial advisor before trading or investing.
I am not responsible for any kinds of your profits and your losses.
Most investors treat trading as a hobby because they have a full-time job doing something else.
However, If you treat trading like a business, it will pay you like a business.
If you treat like a hobby, hobbies don't pay, they cost you...!
Hope this post is helpful to community
Thanks
RK💕
Disclaimer and Risk Warning.
The analysis and discussion provided on in.tradingview.com is intended for educational purposes only and should not be relied upon for trading decisions. RK_Chaarts is not an investment adviser and the information provided here should not be taken as professional investment advice. Before buying or selling any investments, securities, or precious metals, it is recommended that you conduct your own due diligence. RK_Chaarts does not share in your profits and will not take responsibility for any losses you may incur. So Please Consult your financial advisor before trading or investing.

Hellena | EUR/USD (4H): LONG to the resistance area 1.17800.Colleagues, I thought I'd update the forecast a bit.
The target remains almost the same, but the wave layout has changed slightly.
I believe that at the moment the development of wave “5” of the higher order and wave “3” of the lower wave is underway.
Therefore, I still consider the area of 1.15765 as a support area and the area of 1.17800 as a target area.
Manage your capital correctly and competently! Only enter trades based on reliable patterns!

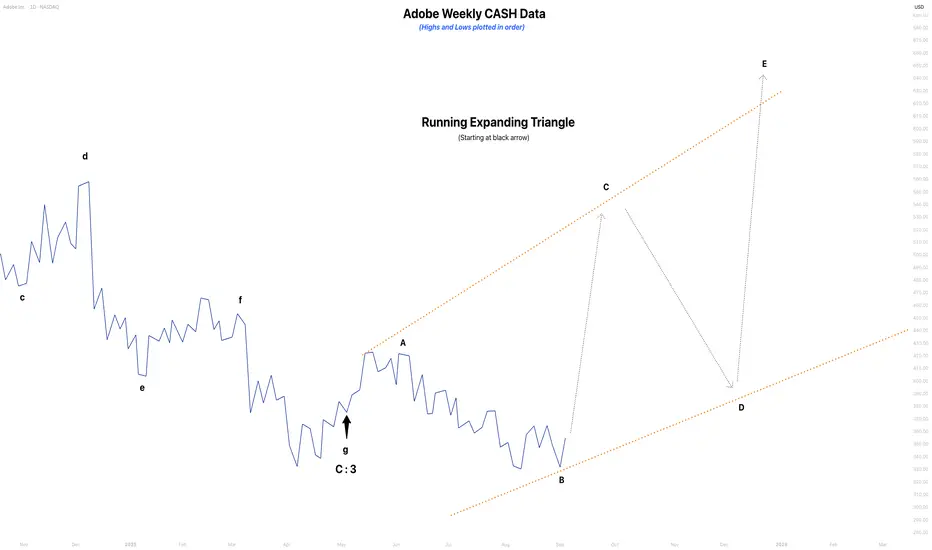
Adobe Weekly NEOWAVE AnalysisAdobe is set to report earnings next week, making this an ideal time to share my chart. Currently, Adobe appears to be forming an expanding triangle, as wave B has extended significantly below the start of wave A. We are now approaching the completion of wave B, with wave C expected to follow likely driving the price well above the start of wave B. The upcoming earnings release could provide clarity on Adobe’s outlook, potentially shifting sentiment and fueling the bullish momentum needed for wave C to unfold.
Hellena | GOLD (4H): LONG to resistance area of 3540.Colleagues, the forecast for an upward impulse has been confirmed and now I think that wave “3” is complete and I expect a correction in wave ‘4’ in the area of 3445 and then a continuation of the upward movement in the final wave “5”, which may meet resistance at the important level of 3540.
The most interesting thing is that if this is what happens - it would mean that there is a pretty strong correction ahead, after the execution of the scenario, and then a continuation of the upward movement, but we will talk about these plans later.
Manage your capital correctly and competently! Only enter trades based on reliable patterns!

Hellena | GOLD (4H): LONG to resistance area of 3460.Dear colleagues, the idea is generally simple and clear.
In the upward movement of waves “3”, “4”, “5” the price should update the maximum of waves ‘D’ and “B” 3448.87.
This means that we should expect the price in the area of 3460.
The target is quite close and I think there is reason to believe that it will be reached next week.
Manage your capital correctly and competently! Only enter trades based on reliable patterns!

Hellena | SPX500 (4H): LONG to resistance area of 6596 .Dear colleagues, I haven't made a forecast for the SNP500 in a long time and was waiting for a correction, but it seems that a major correction is not yet close, and at the moment the price continues to be in an upward five-wave movement.
Therefore, I believe that we should expect to reach the 6596 area, which will mark the end of the medium-term wave “3.”
The corrections are not very deep at the moment, but the price may reach the 6317 area before continuing its upward movement.
Manage your capital correctly and competently! Only enter trades based on reliable patterns!
