VSAT 1W – signal restoredOn the weekly chart, ViaSat (VSAT) finally broke out of a long-term falling wedge — a textbook bullish reversal pattern. After the breakout, price pulled back perfectly into the buy zone, confirming a clean retest on the weekly.
All moving averages (MA/EMA) now sit below the price - a clear sign that buyers are in control.
Technically, the setup looks strong:
✅ wedge breakout confirmed with volume;
✅ weekly retest completed;
✅ bullish momentum building up.
First target stands at 47.11, with higher resistances at 68.63 and 97.34 if the bullish structure holds.
Fundamentally, the company is stabilizing after a tough period - cost control, steady contracts, and renewed investor interest could all support the recovery.
After all, the ticker VSAT stands for communication - and right now, the market’s message seems pretty clear: “connection restored.”
Wedgebreakout

JD – Weekly Descending Wedge (Late-Stage Compression)Thesis
JD remains in a late-stage descending wedge, with volatility compression increasing the probability of a range resolution. Peers already broke out in 2025 a similar setup (BABA, BIDU). 2026 can be the time for JD to catch up.
Context
- Weekly timeframe
- Multi-year downtrend transitioning into a base
- Support zone acting as the wedge “floor”
What I see
- 12+ months of narrowing range
- Repeated rejection at descending resistance
- Demand holding the same support region
- Compression suggests a decision point approaching
What matters now
- A weekly close above wedge resistance is the confirmation trigger
- Until then, this remains a compression structure, not a breakout
Buy / Accumulation zone
- Support zone at the wedge floor (risk defined by a breakdown).
Targets
- First: $70s
- Next: higher extensions into Wave 5, once pull back held
Risk / Invalidation
Weekly breakdown below the support floor invalidates the wedge thesis.

BTC/USDT 4H - Bearish Descending Wedge SetupPrice compressing in a descending wedge: descending resistance (red) repeatedly rejecting at ~$96k-$98k zone, while rising support (green) holds lower lows.
Classic wedges are bullish, but heavy overhead resistance + liquidity pool marked below ~$80k-$82k suggests potential bearish resolution.
Bias: Short on rejection/break of green support line.
Target: Liquidity sweep $80k-82k lows.

Technical analysis of bitcoin key levels and wedge chart pattern1. Trend Structure
The descending trendline (Resistance line) at the top of the chart remains valid.
The price has repeatedly faced rejection at this level, indicating that the medium-term downtrend is still intact.
2. Key Price Levels and Indicators
50-week EMA
The price has recently recorded its third downward break below the 50-week EMA.
From a traditional technical perspective, this is viewed as a signal that strengthens the possibility of a medium- to long-term bearish shift.
POC (Point of Control)
The mid-range POC is acting as a strong supply zone,
and recent rebound attempts have also failed to break above this level decisively.
3. Liquidity Zones
Two major liquidity zones are marked in the upper and mid sections of the chart.
Liquidity zone near 112k (upper zone)
A cluster of large liquidity pockets and liquidation points
If a short-term rebound occurs, this is the first upside target likely to be tested
Liquidity zone near 102k (mid zone)
Overlaps with the 4h FVG, making it a level closely watched by both buyers and sellers
4. FVG (Fair Value Gap)
Multiple FVGs are present on the 4-hour timeframe, with some already filled.
Unfilled FVGs have a high probability of being revisited as the market corrects in the future.
5. CME Gap
All weekday CME gaps have already been filled and may act as short-term resistance.
A weekend gap forms when Monday’s CME opening price starts above 95.4K.
6. Current Market Structure Interpretation
The price is currently attempting a rebound from the lower boundary of the downtrend.
However, several resistance layers overlap—POC, FVG zones, and trendline resistance—raising the likelihood of heavy selling pressure on any upward move.
In the short term, volatility consolidation is expected within the 96k–100k range.
7. Potential Formation of a Lower Wedge Pattern
The price has broken below the lower boundary of the wedge pattern, accompanied by rising volume.
A short-term rebound is likely, and if the price re-enters the wedge, further upside momentum may follow.
If the lower trendline is not reclaimed, the structure may shift into a range after a retest.
8. USDT.D Chart Analysis
The price has once again touched the upper boundary of a downtrend line that has persisted for over a year.
Downward pressure on the USDT dominance chart suggests potential upward momentum for Bitcoin.
Technically, this zone offers conditions supportive of a short-term rebound.
9. Summary
The medium-term trend remains bearish, with the ongoing breakdown below the 50-week EMA reinforcing a sustained bearish outlook.
A short-term bottoming attempt is visible, but dense supply overhead limits the strength of any rebound.
FVGs, POC, and liquidity zones overlap near the current price region, increasing the probability of heightened volatility.
If you found this content helpful, feel free to support with a boost (🚀) and a comment (💬).
Your encouragement helps drive better analysis and more valuable content.
Follow the page to receive notifications (🔔) for future posts.

CHN ready to runCHN has demonstrated encouraging developments after emerging from a descending wedge pattern, bolstered by a bullish RSI divergence and the formation of a bull flag on the hourly chart. Furthermore, the daily chart reveals hidden bullish divergence, complemented by support from a trendline established in July and a .05 Fibonacci retracement level. A decisive move above $2 would serve as a strong indicator of a structural shift, potentially paving the way for a more substantial upward trend. Good luck and happy trading! 🍀

SPX wedge breakout: Reopen relief, 6780 tetest, 7k in SightS&P500 breaks out of a broadening wedge and retests 6780 support as government reopening odds fuel a relief bid.
Senate progress towards ending the record shutdown has lifted the overhang on data releases and growth, triggering a risk-on bounce across US indices. Price action confirmed a breakout with a clean throwback to 6780, aided by hidden bullish divergence on momentum before the surge to 6850.
Key drivers:
Government reopening: bipartisan Senate advance and White House support shift odds towards a near‑term resolution.
Technical confirmation: breakout from falling/broadening wedge, successful retest and RSI reset from overbought at 6850 towards midline supports continuation higher if 50 line holds.
Levels in play: support 6800–6775 and 6750; resistance 6850–6890 then 6930 with psychological 7000 on extension if momentum rebuilds.
Risk: reopening unleashes delayed macro data. A miss or policy hiccup could pull the price back toward the 50% area before the trend resumes and ahead of Nvidia earnings next week.
Bias stays long while above 6775: buy dips to 6750 with invalidation below 6725; If 6690 fails on a daily close, step aside and reassess.

TJX | Possible Break Out Incoming | LONGThe TJX Cos., Inc. engages in the retail of apparel and home fashion products. It operates through the following business segments: Marmaxx, HomeGoods, TJX Canada, and TJX International. The Marmaxx segment sells family apparel including apparel, home fashions, and other merchandise. The HomeGoods segment offers an assortment of home fashions, including furniture, rugs, lighting, soft home, decorative accessories, tabletop and cookware as well as expanded pet, kids, and gourmet food departments. The TJX Canada segment operates the Winners, Marshalls, and HomeSense chains in Canada. The TJX International segment includes operations of T.K. Maxx and Homesense chains in Europe and the T.K. Maxx chain in Australia. The company was founded by Bernard Cammarata in 1962 and is headquartered in Framingham, MA.

DASH/USDT , 1W ( Ready for 85% Up Move ) Dash is moving inside wedge or ascending channel pattern , when it is at support and forming the pattern at support after breaking out the pattern it is giving very good move like previous and now we can expect 80% move .
and at the same time Bitcoin dominance is decreasing and altcoins dominance is started increasing , so look on all the altcoins
and follow proper risk management , it has very good chances to move UP side but first we have to protect the down side , where risk management comes into game .

USDCHF 1D – the dollar wakes upAfter a long decline, the pair finally shows some life - on the daily chart we have a clean breakout from the falling wedge followed by a retest.
Price now holds inside the buy zone (0.795–0.803) - the perfect base for a potential bullish move.
Technically, the setup looks solid:
✅ breakout confirmed
✅ retest completed
✅ volume rising
✅ momentum turning bullish
The first resistance sits at 0.808, where a minor pause could appear.
If buyers hold control above that level - the path to 0.823 (1.618) and later 0.848 (2.618) opens up nicely.
Structure remains bullish as long as the buy zone stays intact.
And remember: you don’t fight the wedge - you ride the breakout.

GBPUSD – 30M | Testing Support Zone, Bullish Bounce ExpectedFX:GBPUSD
Market Overview
GBPUSD is consolidating within a tight structure after a strong sell-off.
The pair is currently testing a major support base where buyers previously defended aggressively.
If price maintains above this zone, we may see a bullish recovery leg toward mid and upper ranges.
Key Scenarios
✅ Bullish Case 🚀 →
🎯 Target 1: 1.3451 (mid-range)
🎯 Target 2: 1.3485 (rejection zone retest)
🎯 Target 3: 1.3510 (extended liquidity reach)
❌ Bearish Case 📉 →
Invalidation below 1.3390 (if support fails to hold).
Current Levels to Watch
Resistance 🔴: 1.3451 / 1.3485
Support 🟢: 1.3400 / 1.3410
⚠️ Disclaimer: This analysis is for educational purposes only. Not financial advice.

IMX/USDT , 1WIn Weekly if IMX breaks the Wedge pattern with strong candle close . it will move very fast (300%) like the same as past move . as the altcoins season is starting and slowing gaining momentum.
and at the same time Bitcoin dominance is decreasing and altcoins dominance is started increasing , so look on all the altcoins
and follow proper risk management , it has very good chances to move UP side but first we have to protect the down side , where risk management comes into game .

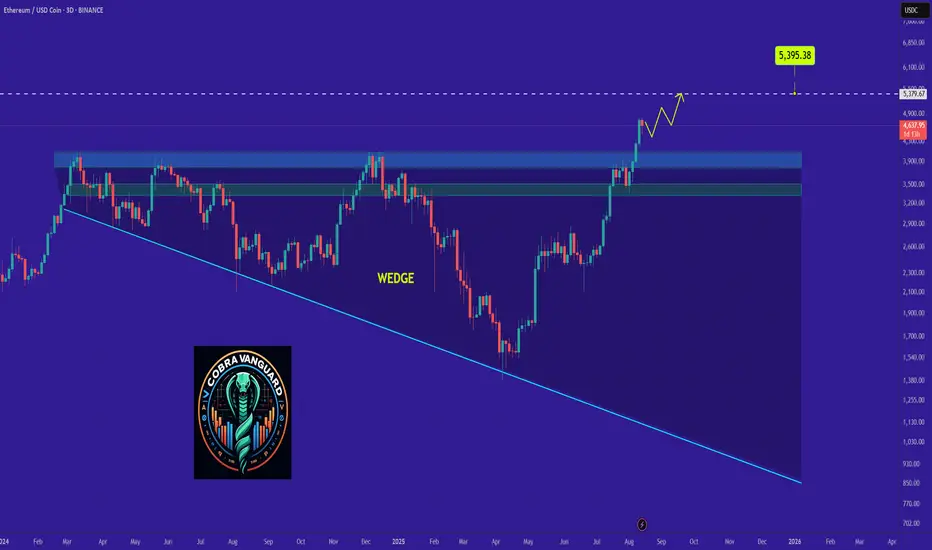
Why ETH Remains Bullish and Its Next Potential Move !As discussed in the previous analysis, the price has finally broken the wedge, and now, with a slight pullback, it could reach above $5k.
previous analysis
XAUUSD | Weekly Fakeout → Wedge Breakout | Targeting 3508+🔔 Summary:
Reclaimed liquidity, broke wedge structure with strength, and printed continuation signs.
Expecting bullish move toward 3,508 on higher timeframe if breakout holds.
Will reassess if price closes below 3,314 (invalidates short-term momentum).
🔔 Long Version:
📝 Description:
📆 Date: 2nd August 2025
📊 Timeframe: Weekly → Multi-TF Analysis
📈 Bias: Bullish
🧠 Setup: High-volume breakout from descending wedge + weekly fakeout/liquidity sweep.
⸻
🧱 Structure
• Weekly fakeout below trendline rejected with strength
• 4H bullish engulfing candle broke through EMA stack and wedge resistance
• Price retested previous Fair Value Gap (FVG) and confirmed buyer strength
• Strong volume spike and MACD momentum shift confirmed breakout conviction
📊 Indicators
• EMAs: Price above 20/50/100/200 on H1 & 4H
• MACD: 4H flipping bullish, Weekly still holding green
• Volume: Significant bullish breakout candle, multi-timeframe confluence

IPH 40% move coming?IPH has recently emerged from a descending wedge pattern, supported by bullish divergences in both the RSI and OBV, along with several divergences observed in shorter time frames. A pullback to the $5 level is anticipated, as the stock appears weaker on these smaller time frames. If IPH can maintain its position above the recent low of $4.40, it will indicate a structural shift, establishing higher highs and higher lows. My initial target is in the $6.50 range, followed by a potential move just above $7, representing a 40% increase. Good luck and happy trading 🍀

Understanding Wedge Patterns - A Real Bitcoin Case Study🎓📊 Understanding Wedge Patterns - A Real Bitcoin Case Study 🧠📈
Hi everyone, FXPROFESSOR here 👨🏫
From this moment forward, I will no longer be posting targets or trade setups here on TradingView. Instead, I’ll be focusing 100% on education only for here in Tradinfview.
Why? Because over time I’ve learned that even when traders receive the right charts, most still struggle to trade them effectively. So, from now on, FX Professor Crypto content here will be strictly educational — designed to teach you how to read and react to the markets like a professional. Unfortunately I cannot be posting on Tradingview frequent updates like I do all day. Education is always better for you guys. And i am very happy to share here with you what matters the most.
🧩 In today’s post, we dive into one of the most misunderstood formations: the wedge pattern.
Most resources show wedges breaking cleanly up or down — but real price action is messier.
🎥 I recorded a video a few days ago showing exactly how BTC respected a wedge formation.
⚠️ Note: Unfortunately, TradingView doesn’t play the audio of that clip — apologies that you can’t hear the live commentary — but the visuals are clear enough to follow the logic. (there is no advertising of any kind on the video so i hope i don't get banned again - i did make a mistake the last time and will avoid it-the community here is awesome and needs to stay clean and within the rules of TV).
Here’s what happened:
🔸 A clean wedge formed over several days
🔸 We anticipated a fake move to the downside, grabbing liquidity
🔸 BTC rebounded off support around a level marked in advance
🔸 Then price re-entered the wedge, flipping support into resistance
The lesson?
📉 Often price will exit the wedge in the wrong direction first — trapping retail traders — before making the real move. This is a classic liquidity trap strategy, exercised by the 'market'.
💡 Remember:
Wedges often compress price until it "runs out of space"
The initial breakout is often a trap
The true move tends to come after liquidity is taken
The timing of the 'exit' has a lot to do with the direction. In the future we will cover more examples so pay attention.
I stayed long throughout this move because the overall market context remained bullish — and patience paid off.
Let this be a reminder: it’s not about guessing the direction — it’s about understanding the mechanics.
More educational breakdowns to come — keep learning, keep growing.
One Love,
The FX PROFESSOR 💙
Disclosure: I am happy to be part of the Trade Nation's Influencer program and receive a monthly fee for using their TradingView charts in my analysis. Awesome broker, where the trader really comes first! 🌟🤝📈

AMD 1W: If Not Now — Then When?The weekly chart of AMD looks like it’s holding its breath: a well-defined falling wedge, double bottom support, and price pressing right against long-term trendline resistance. Everything’s in place — now it just needs to break and run, preferably without tripping over nearby Fibonacci levels.
The stock is trading around $114 and attempting to hold above the 50-week MA. Just ahead is the 200-week MA (~131) — not only a technical hurdle but also a psychological pivot. A move above it could reignite talk of $150+ targets.
The wedge has been narrowing since late 2024. After repeated bounces off support, price has returned to the top of the pattern. A confirmed weekly close above the wedge could trigger a real breakout. Without that — it risks yet another scripted pullback.
Key Fibonacci levels:
0.618 — $133.60
0.5 — $151.42
0.382 — $169.25
0.236 — $191.30
0.0 — $226.95 (all-time high)
The roadmap looks clean — but only if volume follows through. There are signs of quiet accumulation at the bottom, but no explosive buying just yet.
Fundamentals:
AMD delivered solid Q1 results: revenue is growing, EPS beat expectations, and margins are holding. More importantly, the company launched a new $6 billion stock buyback program — showing clear internal confidence in its long-term trajectory.
There’s also a strategic AI partnership underway with a Middle Eastern tech group. This move positions AMD to challenge not just for GPU market share, but for future AI infrastructure dominance — long game stuff.
Analyst sentiment has turned bullish again, with new price targets in the $130–150 range. All of this makes the current chart structure more than just technical noise — it’s backed by strong tailwinds.

Why I Went Long on AMD Near the 2025 Lows🔍 Reason for the Trade
This wasn’t just a “buy the dip” setup — this was a calculated trade based on strong confluence:
✅ Multi-Year Demand Zone
Price returned to a massive support level that’s held since 2020. This zone had previously triggered multiple large bullish reversals.
✅ Falling Wedge Breakout
A textbook falling wedge pattern formed during the pullback. Once price broke out, the momentum confirmed a structural reversal.
✅ Risk/Reward Optimization
I positioned my stop just under key support, with targets set at prior structure highs. The setup offered a clean 2.5:1+ R/R ratio, perfect for swing conviction.
✅ Institutional Accumulation Area
The volume and wick rejections in this zone screamed smart money stepping in. It was a classic sign of fear-based selling into patient buyers.
🧠 Lessons Reinforced
- Wait for the Zone, Then Act: Patience paid off — the best trades come from the best levels.
- Structure Over Emotion: I trusted the technical, not the bearish headlines.
- R/R Always Wins: You don’t need to be right every time, but when you’re right — let it run.
#AMD #SwingTrade #TechnicalAnalysis #SupportAndResistance #WedgeBreakout #RiskReward #PriceAction #StockMarket #TradingView #TradeRecap

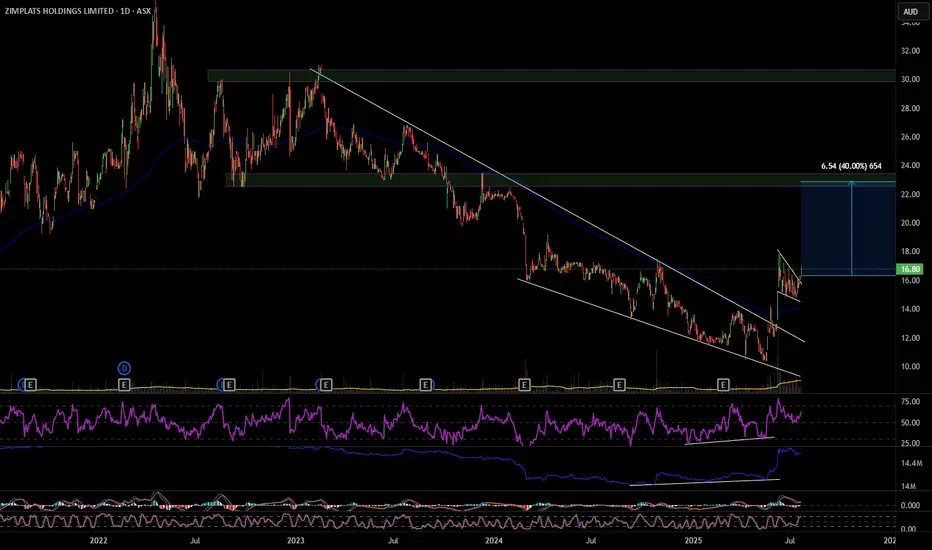
ZIM 40% move up
ZIM has broken out of a descending wedge with bullish RSI and OBV divergence, also multiple divergences on smaller time frames. On the hourly it's had a pull back and formed a bull flag that it has also broken out of. ZIM looks to have formed a change of structure forming higher highs and higher lows, my first target will be $22.90 a move of 40%. Definitely one to consider. Good luck and happy trading 🍀
NATURAL GAS - REBOUND FROM THE MAJOR TRENDLINE AND ANOTHER LONG CAPITALCOM:NATURALGAS
Last week on Wednesday and Thursday we observed the false breakout of the major trendline. Eventually, Thursday ended up bullish, gaining 4.8% day-to-day. On Friday the asset has been trading majorly sideways, retesting the major trendline (pic 1). Technically, looks like the divergence on RSI, MACD and Momentum works out as well as the bullish wedge (pic 2). Fundamentally, we still have warm temperature weather forecasts in the U.S. and bullish Thursday's EIA report. Additionally, today the market opened with a bullish gap and continues to grow, which is a good signal for the buyers.
Considering major levels here, I decided to open long positions:
🔼 a market buy order at 3.4556 with
❌a stop loss at 3.2995 and
🤑a take profit at 3.7927
At 3.6000 would be reasonable to reduce long position on a half. Thank you for the attention!

NC HAMMER CRYPTOOn my videos posted on another platform that starts with a Y. You can see once it breaks the wedge it typically has a bullish outcome. Good luck and have fun with it.

$LDO PUMP TO $1.20📊 1. Trend Analysis
HTF (Higher Time Frame) Bullish: Long-term trendline shows sustained upside momentum with 3 clean touches, indicating trend strength.
LTF (Lower Time Frame) Bearish: Short-term structure broke down from the trendline but is now showing signs of reversal with a falling wedge breakout.
📈 2. Chart Pattern
Falling Wedge: Classic bullish reversal setup. Price has broken out with strong momentum.
OBV (On-Balance Volume) shows bullish divergence—volume is rising while price was falling, signaling accumulation during the downtrend.
🔄 Market Structure
Swing Highs and Lows are respected—showing healthy structure.
Recent swing low held near the demand zone.
Break and retest of key levels and trendlines indicate potential continuation to the upside.
🟪 Supply & Demand
Demand Zone (~$0.65): Provided strong support, origin of latest move.
Supply Zone (~$1.15): Likely to offer resistance; aligns with upper FVG and volume gap.
🔵 Fair Value Gaps (FVGs)
Filled/Partial Below: $0.65–$0.68 – already mitigated.
Unfilled Above: Around $0.98–$1.05 – may act as a magnet for price.
🧠 Psychological Levels
$0.90 and $1.00: Price magnets due to trader behavior. Expect increased reaction or consolidation at these levels.
🔴 Volume Profile
High Volume Node (HVN) around $0.85–$0.95: Indicates acceptance zone where price may consolidate.
Low Volume Gap above $1.10: If price clears this, a fast move to $1.20+ is likely.
✅ Bullish Confluences
Falling wedge breakout confirms reversal potential.
OBV divergence supports accumulation narrative.
Price bounced from demand zone and reclaimed broken structure.
Room to move into FVG and low-resistance areas above.
❌ Bearish Risks
Rejection at $1.00–$1.05 psychological/FVG level.
Breakdown below $0.86–$0.88 invalidates bullish setup.
Heavy supply at $1.20 could cap upside.
📌 Summary
Bias: Bullish. Expect move toward $1.00–$1.15.
Confirmation: Clean break and hold above $1.00.
Invalidation: Break back below $0.86 swing low.

EUR/USD Triangle Pattern – 1H Timeframe
📊 EUR/USD Triangle Pattern – 1H Timeframe
🕐 Date: 17 June 2025
📌 Chart by: GreenfireForex
🔷 Pattern: Contracting Triangle (ABCDE)
🔍 Context: Forming inside Wave (4) – possible breakout before Wave (5)
📈 Upside Potential: Break above triangle → target near 1.16500+
📉 Downside Risk: If fails to break up → revisit demand zone around 1.15000
---
🔮 Possible Scenarios:
✅ Bullish Breakout:
Breaks above wave (e)
Clean rally toward target zone
Ideal for a long setup with tight SL
❌ Bearish Fakeout:
Rejection from triangle resistance
Falls back into demand zone
Look for reversal or retest opportunities
---
🎯 Strategy Tips:
Wait for a breakout candle
Use SL outside triangle zone
Entry based on confirmation – avoid early trades
💬 Let’s discuss live market reaction as price nears triangle edge. Stay ready .

Wedge Pattern – Simple Explanation
📚 Wedge Pattern – Simple Explanation
A wedge pattern is a shape on the chart that looks like a triangle or cone. It tells us that the price is getting ready to break out — either up or down.
---
🔻 Falling Wedge (Bullish)
Looks like price is going down, but slowly.
Lines move closer together.
Usually means the price will go up soon.
It's a bullish signal (good for buying).
---
🔺 Rising Wedge (Bearish)
Price goes up, but losing strength.
Lines get closer together.
Usually means the price will go down soon.
It's a bearish signal (good for selling).
---
💡 Easy Tips:
Wait for breakout (big move out of the wedge).
Use a stop-loss below/above the pattern.
Target = height of the wedge.
---
📌 In Short:
Wedge = Squeeze pattern.
Falling wedge = Buy chance.
Rising wedge = Sell chance.
---
Let me know if you have sny doubt in comments
