HPQ could make a big move from here! OptionsMastery:
🔉Sound on!🔉
📣Make sure to watch fullscreen!📣
Thank you as always for watching my videos. I hope that you learned something very educational! Please feel free to like, share, and comment on this post. Remember only risk what you are willing to lose. Trading is very risky but it can change your life!
Weeklychart

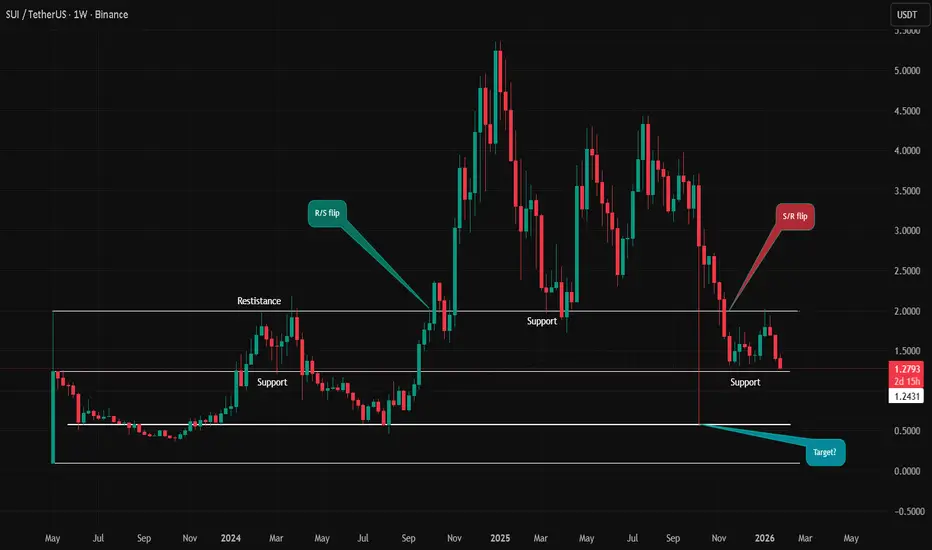
SUI / USDT – Weekly OverviewPrice is currently trading below a key support zone, which previously acted as strong demand.
This level has now turned into resistance (S/R flip).
Key Levels
Resistance: 1.55 – 1.65
Major Resistance: 2.00
Support: 1.20 – 1.25
Downside Target: 0.85 – 0.90
Scenario 1 – Bearish Continuation
As long as price remains below 1.55, the bias stays bearish.
Failure to reclaim this level increases the probability of a move toward 0.85, which aligns with previous demand on the higher timeframe.
Scenario 2 – Bullish Recovery
A clean weekly close above 1.55–1.65 would invalidate the bearish scenario.
In that case, price could rotate back toward 2.00, where heavy resistance is expected.
Conclusion
This is a high-timeframe decision zone.
Patience is key — wait for confirmation instead of anticipating the move.
What do you think: breakdown continuation or reclaim of resistance?
MrC
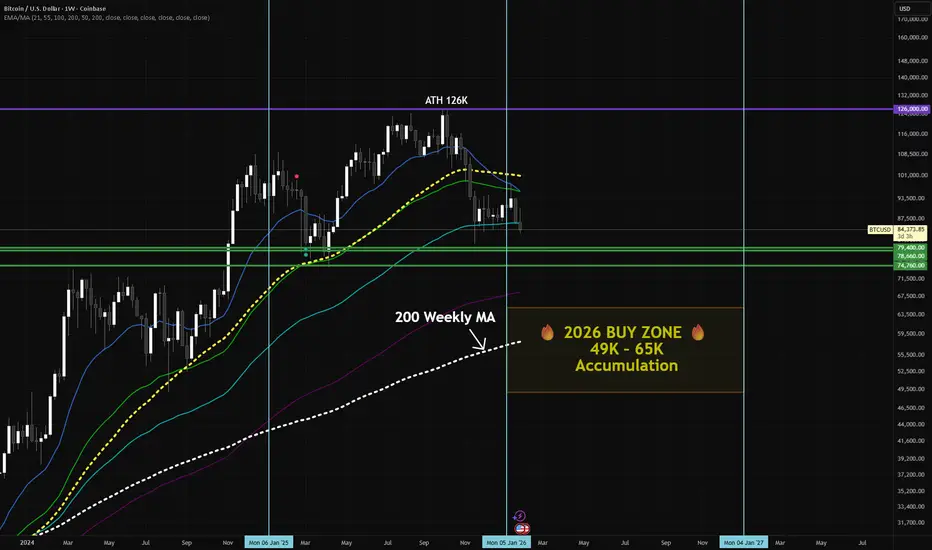
BTC Weekly Update – January 2026Current positions highlighted on the chart: 74K–79K , which are holding as near-term support.
I also have longer-term DCA positions not shown here.
Key 2026 accumulation zone: 49K–65K, near the weekly 200 MA, which has historically acted as long-term support.
BTC has recently pulled back from the 2025 peak (~126K) and is consolidating in the mid 80K range. Holding these support levels will be important before potential moves lower toward structural long-term support zones.
For educational purposes only – not financial advice.
TTE Weekly: Gap Breakout Above Kumo + 200MAOn the weekly chart, TTE is showing a clear polarity shift:
Bullish breakout on the weekly timeframe, supported by a gap-up move this week.
Price is now back above the Ichimoku Kumo (cloud) → typically a sign of a regime change from bearish/neutral to bullish when sustained.
The stock has also reclaimed the 200-day moving average, reinforcing the idea that medium/long-term bias is turning upward.
What I’m watching next
Confirmation: a weekly close holding above the Kumo + 200MA zone (roughly the €56–57 area on this chart) would strengthen the bullish case.
Resistance / upside areas to monitor: the prior supply zone around 60–62, then 64–66 if momentum continues.
Invalidation: a weekly close back into the cloud / below the reclaimed averages would weaken the polarity-flip thesis.
Catalyst
This technical shift could be validated (or rejected) by the next earnings release on Feb 11. I’m treating that event as the key “confirmation trigger” for follow-through.

NVO – Long-Term Cycle View (5–7 Years)Thesis
NYSE:NVO is transitioning from a completed Cycle Wave 2 into a new multi-year expansion phase. The long-term bull structure remains intact, with fundamentals now acting as a catalyst for the next cycle leg.
Context
- Weekly timeframe
- Primary bull trend originates from the 2009 GFC low (< $1)
- Cycle Wave 1 completed in July 2024
- Deep corrective Cycle Wave 2 now appears complete
What I see
-Structural reversal underway from long-term trend support
- Price stabilizing in a major accumulation / buy zone
- New Wegovy pill acts as a fundamental trigger aligning with the technical reversal
- Momentum and structure support the start of Cycle Wave 3
What matters now
- Holding the current base keeps the Cycle Wave 3 thesis intact
- This phase is about accumulation, not timing short-term moves
Buy / Accumulation zone
- Current zone remains suitable for long-term positioning
- This is where multi-year risk/reward is defined
Targets
- Cycle Wave 3 (1.618 Fib): ~$273. Expected around early 2029. Approx. +450% from the buy area
- Cycle Wave 5: ~$415. Expected around 2033. Approx. +730% from the buy area
Income
- Dividend yield ~2.1% adds meaningful carry while holding
Conclusion
Strong technical cycle alignment + improving fundamentals make NYSE:NVO a compelling long-term hold. This is a position built to be held through volatility, not traded.

POLUSDT - Weekly outlookPOL is currently trading at a key weekly resistance zone after a strong bounce from the lows.
On the higher timeframe, price has been respecting clear support & resistance flips. Previous support levels have turned into resistance, and price is now testing one of those key areas again.
Key levels to watch:
Weekly Resistance: ~0.17 – 0.18
Weekly Support: ~0.12 – 0.13
For bullish continuation, price must flip this resistance into support. Without a clean S/R flip and weekly close above this level, this move remains a relief bounce inside a broader downtrend.
Rejection here would keep the structure bearish, with a high chance of price revisiting lower support zones.
Acceptance and hold above resistance would open the door for a move toward the next major resistance around 0.30.
Patience is key on the weekly timeframe — structure confirmation comes first.
👉 Do you expect a clean weekly S/R flip, or will this level act as resistance again?
Like & comment if this helps your bias 👇
MrC

Bitcoin Cash (BCH) — Weekly OutlookPrice is approaching a major weekly resistance zone that has capped price multiple times in the past.
This level is key — how price reacts here will define the next macro leg.
Current structure:
Strong impulse from long-term support
Clean higher highs & higher lows
Momentum remains intact while holding above weekly support
Key level to watch:
~630–680 zone → previous resistance
This area must flip into support to unlock continuation
If price:
Flips & holds above resistance → continuation toward the $1,000+ region becomes likely
Rejects hard → expect a deeper retracement before continuation
No need to front-run.
Weekly closes will tell the real story.
What’s your bias here — clean flip or first rejection before continuation? 👇👇👇
MrC

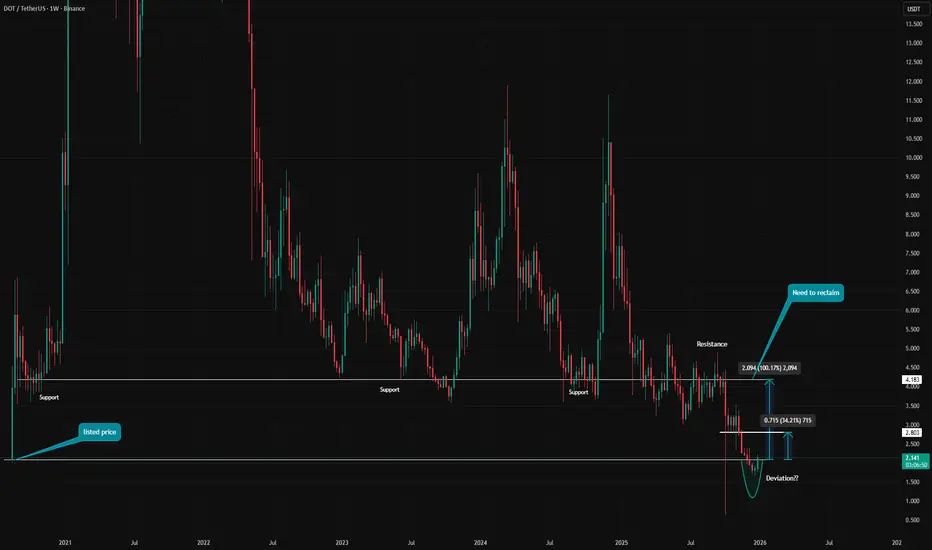
DOT / USDT – Weekly Structure Price is currently reacting around the listed price / origin level
This level has limited historical validation as support and should be treated as a reaction zone, not a confirmed long-term support.
Recent price action shows a strong move below this level followed by a reclaim, suggesting a possible deviation.
However, deviation alone does not confirm a structural shift.
From here, a short-term continuation toward local resistance is possible.
For any meaningful bullish continuation, price needs to reclaim and hold above that resistance.
As long as price remains below resistance, this move should be treated as a reactive bounce within a broader bearish structure, not a confirmed reversal.
This is a key decision area.
Let acceptance and structure confirm the next move.
Do you see this as a deviation reclaim, or just a temporary reaction?
MrC
PENDLE – Weekly Structure Higher timeframe structure remains bearish
Price continues to trade below a key resistance after a clear rejection
Previous support has flipped into resistance
→ R/S flip is holding, keeping downside pressure intact
Recent downside move fully filled the lower wick
This indicates liquidity has been taken and short-term relief is possible
On the lower timeframe, a Market Structure Shift (MSS) has formed
→ This suggests a potential corrective move
As long as price remains below HTF resistance, any bounce should be treated as reactive
Bullish continuation only becomes valid after a reclaim and hold
Level-to-level market
Wait for confirmation, not anticipation
Do you expect a corrective bounce or continuation to new lows from here?
Should I break this down on the lower timeframe?
MrC

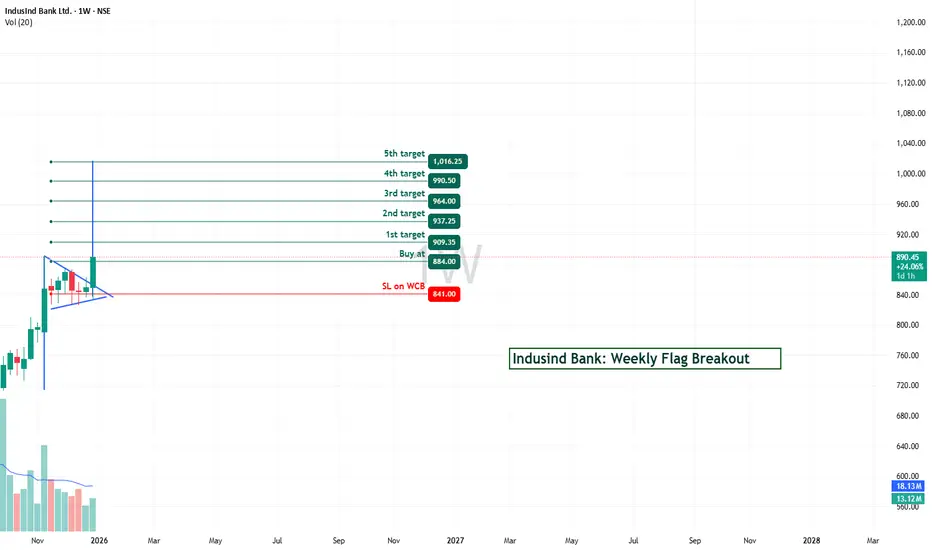
INDUSINDBK Bull Flag Breakout | Target ₹1,016+ | Weekly AnalysisINDUSINDBK Bull Flag Breakout | Target ₹1,016+ | Weekly Analysis
━━━━━━━━━━━━━━━━━━━━━━━━━━━━━━━━━━━━━━━━━━━
📊 TECHNICAL SETUP
Current Price: ₹890.20 (+3.01%)
Timeframe: Weekly (1W)
Pattern: Bull Flag Breakout (Confirmed)
Exchange: NSE
Sector: Banking / Financial Services
━━━━━━━━━━━━━━━━━━━━━━━━━━━━━━━━━━━━━━━━━━━
🎯 PATTERN ANALYSIS
IndusInd Bank has formed a TEXTBOOK BULL FLAG pattern on the weekly timeframe:
✅ Impulsive Move: Strong upside momentum establishing the flag pole
✅ Consolidation Phase: Higher lows and controlled pullback forming the flag
✅ Breakout: Successful breakout above flag resistance at ₹884.00
✅ Volume Confirmation: 12.8M-13M weekly volume confirming strength
✅ RSI Divergence: Advanced RSI showing Regular Bullish Divergence
The stock has decisively moved above the consolidation zone, confirming bullish intent. Bull flags are continuation patterns with approximately 75% success rate on higher timeframes.
━━━━━━━━━━━━━━━━━━━━━━━━━━━━━━━━━━━━━━━━━━━
📈 PRICE TARGETS (Progressive)
1st Target: ₹909.35 (Immediate) - 2.1% from current
2nd Target: ₹937.25 (Short-term) - 5.3% from current
3rd Target: ₹964.00 (Medium-term) - 8.3% from current
4th Target: ₹990.50 (Extended) - 11.3% from current
5th Target: ₹1,016.25 (Long-term) - 14.1% from current
Targets are derived from flag height projected from the breakout point, a standard technical approach for pattern continuation measurements.
━━━━━━━━━━━━━━━━━━━━━━━━━━━━━━━━━━━━━━━━━━━
🛡️ RISK MANAGEMENT
Entry Zone: ₹884.00 - ₹890.20 (Breakout confirmation)
Stoploss: ₹841.00 (Weekly Close Entry basis)
Risk/Reward Ratio:
- Risk (890 to 841) = 49 points
- Reward (890 to 1016) = 126 points
- R:R Ratio = 1:2.57 (Excellent)
Position Sizing: Risk only 1-2% of your capital per trade
Stoploss placement is BELOW the consolidation zone.
━━━━━━━━━━━━━━━━━━━━━━━━━━━━━━━━━━━━━━━━━━━
📍 KEY LEVELS
Immediate Support: ₹884.00 (Breakout level)
Secondary Support: ₹841.00 (Stoploss level)
Resistance 1: ₹909.35 (1st Target)
Resistance 2: ₹937.25 (2nd Target)
Major Resistance: ₹1,016.25 (Long-term Target)
━━━━━━━━━━━━━━━━━━━━━━━━━━━━━━━━━━━━━━━━━━━
⚙️ ACTIVE INDICATORS
🔹 Volume Profile (20-period)
Confirming accumulation and rising breakout volume
🔹 Advanced RSI Divergence Detector (14-period)
Regular Bullish Label detected
RSI at 60 level (Strength confirmation, not overbought)
🔹 Dynamic Swing Anchored VWAP
Providing dynamic support during uptrend
━━━━━━━━━━━━━━━━━━━━━━━━━━━━━━━━━━━━━━━━━━━
✨ TRADING STRATEGY NOTES
• Bull flags have ~75% success rate on weekly timeframes
• Weekly breakouts carry higher conviction than intraday
• Volume confirmation during breakout is CRUCIAL - present here
• RSI bullish divergence adds confluence to thesis
• Consider taking partial profits at each target level
• Trail stoploss after hitting first target (₹909.35)
• Manage position size according to your risk tolerance
━━━━━━━━━━━━━━━━━━━━━━━━━━━━━━━━━━━━━━━━━━━
⚠️ CRITICAL DISCLAIMER
🔴 THIS IS TECHNICAL ANALYSIS FOR EDUCATIONAL PURPOSES ONLY
🔴 THIS IS NOT FINANCIAL ADVICE OR AN INVESTMENT RECOMMENDATION
This analysis:
- Is based on historical price patterns and technical indicators
- Does NOT constitute investment advice or a buy/sell recommendation
- Is my personal observation and analysis
- Should NOT be the sole basis for any investment decision
━━━━━━━━━━━━━━━━━━━━━━━━━━━━━━━━━━━━━━━━━━━
⚠️ IMPORTANT RISKS TO UNDERSTAND
✓ Past performance does NOT guarantee future results
✓ Technical patterns can FAIL and breakouts can reverse
✓ Market conditions can change rapidly without warning
✓ This analysis is based on historical data only
✓ All equity investments carry significant risk of loss
✓ You may lose your ENTIRE investment amount
✓ This is a pattern observation, NOT a guaranteed trade signal
✓ Consult a qualified financial advisor before trading
✓ Do your own independent research (DYOR)
✓ Use strict position sizing and risk management
✓ Never trade with leverage unless you fully understand risks
✓ News events, earnings, and market gaps can invalidate patterns
✓ Market liquidity and slippage can affect entry/exit prices
✓ Regulatory changes can impact stock performance
━━━━━━━━━━━━━━━━━━━━━━━━━━━━━━━━━━━━━━━━━━━
🔴 FINAL RISK ACKNOWLEDGMENT
TRADING AND INVESTING IN STOCKS INVOLVES SUBSTANTIAL RISK OF LOSS.
I am NOT a financial advisor, fund manager, or investment professional. This analysis is provided for educational purposes only.
BEFORE MAKING ANY INVESTMENT DECISION:
✓ Conduct your own thorough research
✓ Understand the company's fundamentals
✓ Check news and recent developments
✓ Verify your risk appetite and capital availability
✓ Consult with a qualified financial advisor
✓ Only invest capital you can afford to lose
✓ Never follow this as a guaranteed strategy
Your investment decisions are YOUR responsibility. Use proper risk management, stop losses, and position sizing.
━━━━━━━━━━━━━━━━━━━━━━━━━━━━━━━━━━━━━━━━━━━
Trade responsibly. Risk management is paramount.
#INDUSINDBK #BullFlag #TechnicalAnalysis #NSE #Trading #Breakout #WeeklyChart
HYPE – Weekly Structure Price got rejected from a major weekly resistance
Clear distribution at the highs → structure shifted bearish
Previous support has flipped into resistance (R/S flip)
As long as price stays below this level, downside pressure remains valid
Price is currently consolidating above a local support zone
This area is critical for short-term direction
If support fails on a weekly close, continuation to the downside becomes likely
Bullish scenario only activates if price reclaims resistance and holds
Level-to-level market
No prediction — wait for confirmation. Monitor on the LTF
What’s your bias from here: support hold or further continuation?
MrC

LINKUSDT – Weekly TimeframePrice is currently reacting at a major support zone that has been respected multiple times in the past.
This area previously acted as both support and resistance, making it a key decision point for the market.
Market structure
Higher timeframe structure is still correcting
Price is testing a previous support area
Momentum has slowed down, showing hesitation
Scenario 1 – Support holds (bullish):
If buyers step in and this support holds, we could see a relief move towards the next resistance zone, where price was previously rejected.
Scenario 2 – Support fails (bearish):
If this support breaks with a strong close, price may continue towards the lower support zone, which acted as a base earlier in the structure.
Conclusion:
Price is at a make-or-break area. Waiting for confirmation is safer than anticipating the move.
Do you expect a bounce from support or a breakdown continuation?
MrC

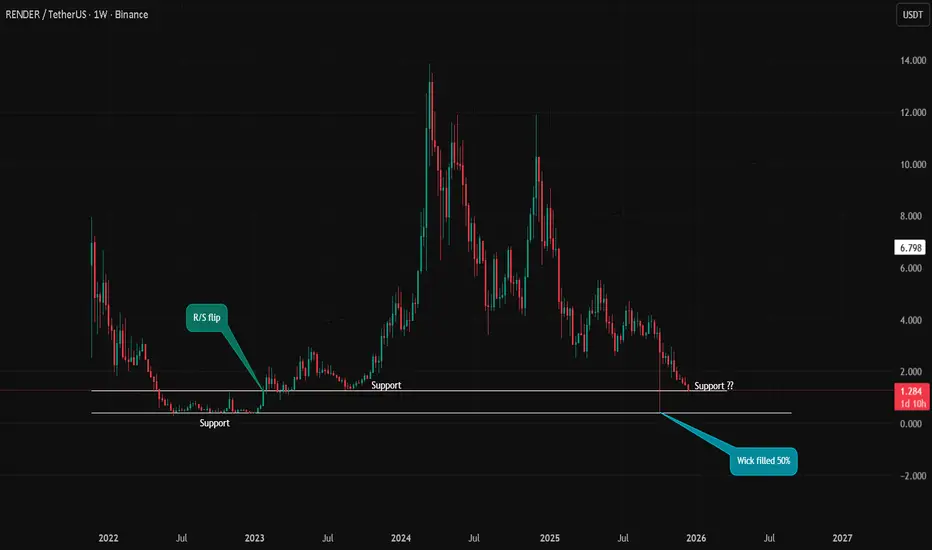
RNDR – Weekly Structure Price is currently trading at a major HTF support zone around $1.20–$1.30.
This level previously acted as strong support and resistance, making it a key decision area.
The recent downside wick has been partially filled (~50%), which often signals temporary demand, but structure is still bearish on the higher timeframe.
Key levels to watch:
Support: $1.20 – $1.30
Next downside risk: If this level fails → possible continuation lower
Bias:
As long as price holds above support → potential range / relief bounce
Weekly close below support → bearish continuation scenario
Patience is key here. Let price confirm direction before entering.
Not financial advice. Always manage risk.
MrC
JTO – Weekly OutlookPrice broke below the previous support and confirmed an S/R flip, turning that level into resistance.
Last wick from October 6th is now fully filled, which means that inefficiency has been resolved.
We are currently trading below key weekly support, and price is consolidating at lows.
At this point, there is no clear confirmation of a reversal yet.
Key observation:
If price creates a deviation below current support, I’ll be watching for long opportunities on lower timeframes, targeting a move back into the range.
If not, this level may act as acceptance and continuation to the downside.
Patience is key here — let the market show its hand.
Levels to watch:
Resistance: previous weekly support (now S/R flip)
Support: current lows after wick fill
What do you think — deviation reclaim incoming or further downside first?

FETCH – Weekly AnalysisFETCH is currently trading at a key HTF support zone that has acted as
support → resistance → support multiple times in the past.
Price is also compressing against a descending trendline, which increases the probability of a volatility expansion.
Key observations:
Strong historical support around current price
Downtrend structure still intact
Potential trendline breakout if buyers step in
No confirmation yet → patience required
Bullish scenario:
Weekly close above the descending trendline
Support holds as higher low
➡️ Possible trend reversal / expansion
Bearish scenario:
❌ Loss of HTF support
➡️ Continuation of the macro downtrend
Always wait for confirmation. What’s your bias here?

BTC/USDT: Double Top Pattern - Bearish Target $75k-$78kANALYSIS OVERVIEW
Bitcoin is showing a confirmed Double Top pattern at $108,000 level with a breakdown of the neckline around $92,000-$95,000. Current price action suggests a continuation of the bearish trend toward key support levels.
TECHNICAL STRUCTURE
Elliott Wave Analysis:
The price has dropped from $108k to $85k, representing a 21% correction. This appears to be an ABC corrective wave following the fifth wave completion at $108k.
Key Price Levels:
Resistance Zones:
R1: $90,000-$92,000
R2: $95,000-$98,000 (Broken Neckline)
R3: $100,000 (Psychological level)
R4: $108,000 (Previous ATH)
Support Zones:
S1: $82,000-$84,000 (Current range)
S2: $75,000-$78,000 (Double Top target - Strong support)
S3: $68,000-$70,000
S4: $56,000-$58,000 (Major support from previous Wave 4)
TRADING SCENARIOS
Scenario 1 - Bearish Continuation (60% probability):
Short Setup:
Entry: $88,000-$92,000 (on pullback to broken neckline)
Stop Loss: $95,000
Take Profit 1: $78,000 (R/R = 1:2)
Take Profit 2: $70,000 (R/R = 1:3)
Take Profit 3: $58,000 (R/R = 1:4)
Reasoning:
- Confirmed Double Top breakdown
- Break of market structure
- Strong selling pressure
- Multiple consecutive bearish weekly candles
Scenario 2 - Correction and Reversal (40% probability):
Long Setup:
Entry 1: $75,000-$78,000 (Medium risk)
Entry 2: $68,000-$70,000 (Lower risk)
Entry 3: $56,000-$58,000 (Lowest risk)
Stop Loss: Below $52,000
Take Profit 1: $90,000-$95,000
Take Profit 2: $108,000-$110,000
Take Profit 3: $130,000-$150,000
CURRENT MARKET STATUS
Warning: No buying recommendation at current levels. Wait for bottom confirmation.
For swing traders:
- Wait for bottoming pattern at $75k-$80k range
- Look for Hammer or Bullish Engulfing candlestick confirmation
- Confirm with increased buying volume
For long-term investors (DCA approach):
- 25% allocation at $75k-$78k
- 35% allocation at $68k-$70k
- 40% allocation at $56k-$58k
SHORT-TERM FORECAST (1-2 months):
- Primary scenario (60%): Decline to $75k-$78k
- Secondary scenario (30%): Range-bound $82k-$95k
- Alternative scenario (10%): Quick recovery to $100k
CONCLUSION
Current Signal: BEARISH
Primary Target: $75,000-$78,000
Timeframe: 2-4 weeks
Risk Management:
- Always use stop-loss orders
- Risk maximum 3-5% of capital per trade
- Wait for confirmation before entering positions
The Double Top pattern remains active until price reclaims $95,000 with strong volume. Until then, downside pressure is expected to continue toward the measured move target.

ORDI Weekly AnalysisORDI is currently trading at a major higher timeframe support zone after a prolonged downtrend.
This level has acted as support multiple times in the past, making it an important area to monitor for potential price reactions.
Market structure remains bearish on the higher timeframe, but downside momentum is slowing down and price is starting to consolidate.
Key levels to watch:
Support at the current range low
Resistance at the previous breakdown level
Higher timeframe resistance above, as marked on the chart
If price holds support and manages to reclaim resistance, continuation toward the next resistance levels becomes possible.
If price fails to hold support, consolidation or further downside cannot be ruled out.
This analysis is based on market structure and support and resistance levels.
No predictions, only scenarios.
All levels and scenarios are clearly marked on the chart.
Questions or comments are welcome in the comments below.
MrC

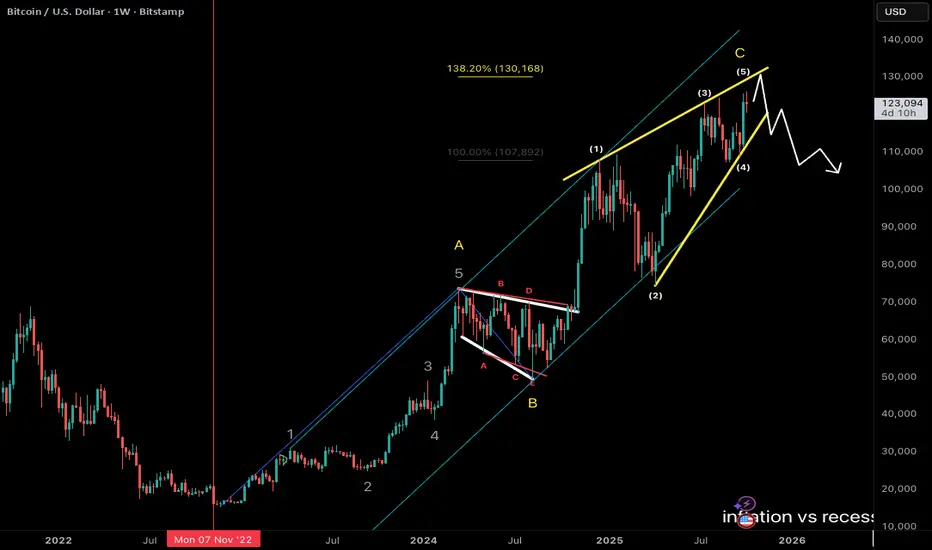
bitcoin ending diagonalbitcoin price going up in a parallel channel
wave A = 12345 and wave C making ending diagonal pattern
C = 138% of A
wave C projection, yellow ending diagonal upper line near 130k
so 130k area is big resistance zone
it has been three years for debasement trade gold and bitcoin are going up
feels like crowd panic on debt
$TGT Weekly Target $quezeWeekly is squeezing tight, looking for a possible momentum shift as its been very quiet and low volume compare to just a few years ago. Targeting $110-$130 in the short-term.

$SPX — WEEK 49 TREND REPORTSPX — WEEK 49 TREND REPORT
Ticker: SP:SPX — 12/01/2025 @ 6812.63
Timeframe: WEEKLY
This is a reactive structural classification of SPX based on the weekly chart as of this timestamp. Price conditions are evaluated as they stand — nothing here is predictive or forward-assumptive.
⸻
1) Current Trend Condition
• Trend Duration: +2 weeks (bullish)
• Trend Reversal Level ( Origin ): 6,721
• Trend Reversal Level ( Confirmation ): 6,432
⸻
2) Structure Health
Retracement Phase:
• Uptrend (operating above 78.6%)
Position Status:
• Healthy (price above both structural layers)
⸻
3) Temperature: Warming Phase
⸻
4) Momentum: Bullish
⸻
5) Market Sentiment: Bullish
⸻
Author’s Note
This analysis is fully reactive, not predictive. Market conditions, trend structure, and behavior are classified as they appear in real time. The objective is to identify where directional shifts first occurred, where structural integrity remains intact, and where it would begin to weaken if key levels were breached.
Predictive analysis projects outcomes that do not exist yet. Without price confirmation, prediction is built on baseless assumptions. This framework avoids that entirely by responding only to verified structural changes and live conditions.
The levels shown simply identify where the current trend structure first shifted and where it would begin to lose integrity if breached. Recognizing these boundaries allows for clearer interpretation of market behavior without relying on forward guarantees, speculative projections, or unsupported assumptions.
⸻
Methodology Overview
This classification framework evaluates directional conditions using internal trend-interpretation logic that references price behavior relative to its structural layers. These relationships are used to identify when price movement aligns with the framework’s criteria for directional phases, transition points, or regime shifts. Visual elements or structural labels reflect these internal interpretations, rather than explicit trading signals or preset indicator crossovers. This framework is observational only and does not imply future outcomes.

USDJPY: I want to see a light correction!Hello Traders,
This is 5Years chart!
We are around a zone! We might soon see a reaction!
and this is our daily chart!
the middle of bullish channel is well broken.
this was an obvious triangle around too!
if you didn't catch the break, you can get profit from pullbacks. specially if it is not and IMPULSE move!
"I want to see a light correction!" and then buy!

Bitcoin Weekly Technical Analysis Report $BTCBitcoin Weekly Technical Analysis Report BINANCE:BTCUSDT
Background Overview
Bitcoin (BTC) has become the most influential digital asset globally due to its decentralization, fixed supply, and transparent transactions. At the intersection of traditional finance and the crypto market, Technical Analysis (TA) is a crucial tool for investors to assess price trends and develop trading strategies. Based on the three key assumptions—“history repeats itself,” “price moves in trends,” and “market action discounts all information”—technical analysis uses chart patterns, trend lines, support and resistance levels, volume, and various indicators to make probabilistic forecasts about future price movements.
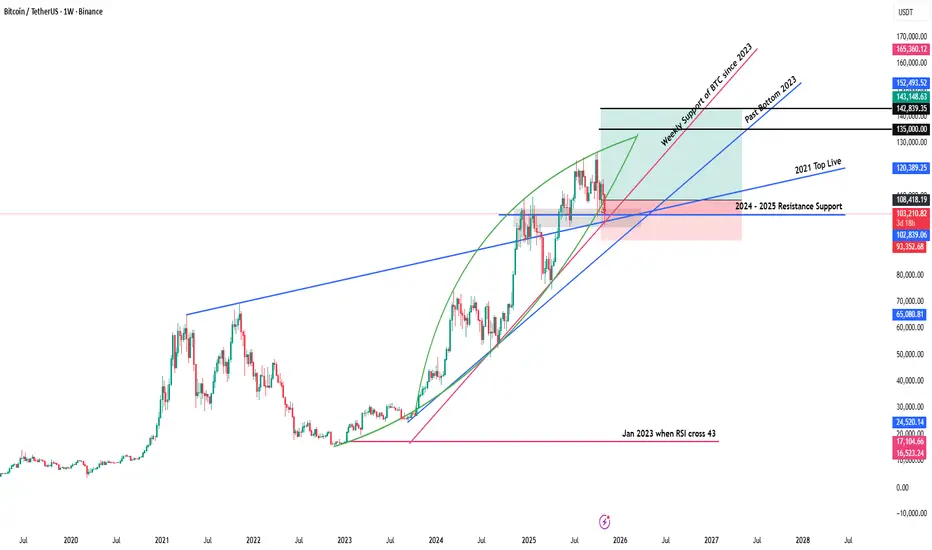
The weekly chart, as a core time frame for medium- to long-term trend analysis, filters out noise from daily and lower time frames, providing a clearer view of the main trend direction, key turning points, and the balance between bulls and bears. The BTC/USDT weekly chart analyzed here (from TradingView) covers price movements from 2023 to the present. It includes annotations such as “Weekly Support of BTC since 2023,” “Past Bottom 2023,” and “2024–2025 Resistance Support,” along with green and pink shaded areas that visually represent different stages of market psychological levels.
Currently, Bitcoin is priced at 103,384.25 USDT, with a weekly decline of -6.47% and a weekly volume of 118,000 USDT. From the chart structure, the price is near the 2024–2025 resistance-turned-support zone while being supported by the ascending trend line that has formed since 2023. The battle between bulls and bears is intense in this range, and price movements over the coming weeks will have a decisive impact on the medium- to long-term trend.
This report will combine key support and resistance levels, trend lines, volume, and technical indicators from the chart, compare historical patterns with the current market environment, conduct an in-depth analysis from multiple perspectives, and propose corresponding strategic recommendations and risk warnings.
Research Support and Evidence Analysis
This analysis is strictly based on the technical elements and relevant market data presented in the chart, with the following key supporting points:
• Current price and change: 103,384.25 USDT, weekly decline of -6.47%, indicating short-term bearish dominance, but the price has not yet broken key support.
• Weekly volume: 118,000 USDT, which has expanded compared to the recent average, suggesting increased market participation and greater divergence between bulls and bears.
• Key support levels:
– “Weekly Support of BTC since 2023” trend line: An ascending trend line connecting the weekly lows since 2023, currently around 100,000 USDT, providing important support.
– “Past Bottom 2023” zone: The 2023 Bitcoin low accumulation area, around 95,000–98,000 USDT, serving as the last line of defense for bulls.
• Key resistance levels:
– “2024–2025 Resistance Support” level: Previous high points where price repeatedly failed to break through, around 110,000–115,000 USDT, now acting as resistance.
– Pink resistance zone: Corresponds to historical accumulation areas and Fibonacci extension levels, around 118,000–122,000 USDT, serving as both a target for bulls and a point for bears to counterattack.
• Trend line analysis:
– Main ascending trend line: Extending upward from the 2023 low with a moderate slope, reflecting the medium- to long-term bullish trend.
– Secondary descending trend line: Connecting the late 2024 and early 2025 highs, forming a short-term descending channel; the price is currently approaching the upper boundary of this channel.
• Volume confirmation:
– When the 2023 support zone formed, volume gradually decreased, indicating easing selling pressure.
– When breaking through resistance in 2024, volume expanded significantly, confirming the validity of the breakout.
– During the current pullback, volume has expanded again, requiring vigilance against panic selling.
Data Comparison and Detailed Summary
To more intuitively present the relationship between key price levels and historical movements, the main support and resistance levels, trend lines, and volume characteristics are summarized as follows:
drive.google.com
From the table, it is clear that the support system formed in 2023 remains effective, while the resistance zone from late 2024 to early 2025 is pressuring the current price. Volume shows distinct patterns at different stages: decreasing at support zones, expanding on breakouts, and expanding again during pullbacks, reflecting cyclical changes in market sentiment.
Source Origin and Citation Interpretation
• Data authority: TradingView integrates real-time quotes from major global exchanges, ensuring the accuracy of price and volume data.
• Annotation professionalism: The trend lines, support and resistance zones on the chart are drawn by experienced analysts based on classic technical analysis methods such as historical highs and lows, accumulation areas, and Fibonacci retracements.
• Time frame representativeness: The weekly chart filters short-term fluctuations and is more suitable for medium- to long-term trend analysis, matching the decision cycles of institutional investors and long-term holders.
For labels such as “Weekly Support of BTC since 2023,” “Past Bottom 2023,” and “2024–2025 Resistance Support,” their origin is the chart drawer’s summary of historical key price levels. Although somewhat subjective, they align with the general definitions in technical analysis for “significant highs and lows” and “accumulation areas.” Therefore, interpretation should combine multiple verifications (such as volume and indicator confirmation) to reduce the risk of bias from single labels.
In-depth Insights and Independent Thinking
Combining the above data and chart features, deeper market insights can be gained from the following perspectives:
The medium- to long-term trend remains healthy
– The main ascending trend line has been extending upward from the 2023 low, and each pullback has not broken below it, indicating that the bullish structure is intact.
– The current price is approaching this trend line. If it can stabilize and rebound here, it will validate the effectiveness of the trend support and lay the foundation for the next upward wave.
The importance of the resistance-turned-support zone
– The 110,000–115,000 USDT zone repeatedly acted as resistance from late 2024 to early 2025. After being recently broken, it has turned into support.
– If the price can stabilize above this zone, it will further consolidate the bulls’ advantage and challenge the pink resistance zone (118,000–122,000 USDT).
Volume signals reveal market sentiment
– Volume decreased at the 2023 bottom, indicating exhausted selling pressure and paving the way for the subsequent rebound.
– Volume expanded during the resistance breakout, confirming increased market participation, while the current pullback’s expanded volume requires vigilance against panic selling.
– Future signs of stabilization with decreasing volume will present a better opportunity for bulls to enter.
Risks and opportunities coexist
– Short-term bears dominate, and the price is approaching the main ascending trend line. A breakdown below could trigger larger-scale stop-losses, targeting the 95,000–98,000 USDT zone.
– If the trend line support holds, combined with oversold signals from technical indicators, a wave of buying opportunities will emerge, with an initial target of 110,000–115,000 USDT.
Macro environment and market structure
– Global liquidity, regulatory policies, and institutional capital flows are exogenous variables affecting Bitcoin’s medium- to long-term trends.
– Although technical analysis can provide probabilistic judgments on price paths, it still needs to be combined with fundamental analysis and market sentiment to improve decision-making success rates.
Extended Discussion / Related Topics
In the current technical context, the following topics can be further explored:
• Multi-dimensional verification of technical indicators
– Relative Strength Index (RSI): Whether the weekly RSI is in overbought or oversold territory, and any divergence with price.
– Moving Averages (MA): The arrangement and divergence of the 50-week, 100-week, and 200-week MAs, and their confirmation of trend direction.
– MACD histogram and signal line: Weekly golden crosses and death crosses, as well as momentum changes in the histogram, indicating trend continuation or reversal.
• Fibonacci retracement and extension
– The role of Fibonacci retracement levels (38.2%, 50%, 61.8%) from the 2023–2024 main upward wave in the current pullback.
– If the price breaks above the pink resistance zone, the next targets can be referenced by Fibonacci extension levels (161.8%, 261.8%).
• Market sentiment and capital flows
– Can data such as futures open interest, funding rates, and exchange net inflows/outflows resonate with chart patterns?
– The impact of continuous buying by institutions like Grayscale and MicroStrategy, compared with the long-short ratio of retail leveraged funds, on medium- to long-term support and resistance.
• Risk management strategies
– Near key support and resistance levels, how to set stop-loss and take-profit to optimize risk-reward ratios.
– When volatility surges, should position size be adjusted, or derivatives like options be used for hedging?
• Future trend outlook
– If the price stabilizes above 110,000–115,000 USDT, the bullish target could extend to 130,000–150,000 USDT.
– If it breaks below the main ascending trend line and loses the 95,000 USDT support, a larger-scale correction may begin, with a downside target around 80,000 USDT.
Through in-depth exploration of the above topics, a more comprehensive investment decision framework can be constructed. On the basis of technical analysis, combining market structure and macro factors will improve the ability to predict price movements.
KERNEX buy setupKERNEX buy setup : I take position in weekly candle basis. hold for 2-3-5 months until the trend is reversing. Please Note: This template is for informational purposes only and is not a substitute for professional legal advice.
